Printable Version of Topic
Click here to view this topic in its original format
Unmanned Spaceflight.com _ Titan _ Updated Titan Map
Posted by: alan Sep 9 2006, 09:46 PM
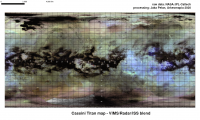
I'm looking for a recent map ot Titan. Steve Albers's page links to one done by Fridger Schrempp in April 2005. Cassini has done a dozen flybys since then. Does anyone know if an updated map has been released.
Posted by: Decepticon Sep 10 2006, 12:48 AM
I believe we have one coming soon!?
VP did talk about it earlier this year.
Posted by: volcanopele Sep 10 2006, 02:36 AM
It's going ![]()
I'm hoping to have it done in the next couple of weeks.
Posted by: Decepticon Sep 10 2006, 03:32 AM
^ Wow I got goose bumps!!
Very excited now! ![]()
Posted by: CAP-Team Oct 10 2006, 07:45 PM
Any idea when the new map is released? ![]()
Posted by: volcanopele Oct 10 2006, 11:16 PM
Anytime between 20 minutes ago and next year.
Posted by: ugordan Oct 11 2006, 06:57 AM
Umm...Is that estimate given with 3-sigma confidence or? ![]()
Posted by: edstrick Oct 11 2006, 10:02 AM
"...Anytime between 20 minutes ago and next year...."
REAL-SOON-NOW: Anytime between now and the decay of the last proton in the universe.
Posted by: paxdan Oct 11 2006, 10:27 AM
I always liked this method from the http://qntm.org/destroy website, I know it is a little of topic but relevent to the last comment nonetheless.
You will need: all-surpassing patience
Method: If the Big Crunch doesn't happen, and the Big Rip doesn't happen either, then we come back to the third option: the Big Chill. For this, the universe will just expand, forever. The laws of thermodynamics take over. Every galaxy becomes isolated from its neighbours. All the stars burn out. Everything gets colder until it's all the same temperature. And after that, nothing ever changes in the universe. For eternity.
A lot can happen in an eternity. Protons, for example, while incredibly stable, are believed to eventually decay like any other particle. So simply wait for a period of time of the order of 1,000,000,000,000,000,000,000,000,000,000,000,000 years, and roughly half of the constituent particles of Earth will have http://en.wikipedia.org/wiki/Proton_decay. If that's still too much like a planet for you, you could wait for another 10^36 years, leaving only a quarter of the original Earth. Or wait even longer. Eventually there will be as little of Earth left as you wish.
Earth's final resting place: Miscellaneous positrons and gamma radiation (pions decay almost instantly into gamma ray photons) scattered thinly across the entire universe.
Posted by: jsheff Oct 11 2006, 01:21 PM
Sure, and by then all the Titan maps will be gone, and I will have waited all that time for Nothing!
![]()
-
John Sheff
Cambridge, MA
Posted by: angel1801 Oct 11 2006, 03:33 PM
I think the map makers are holding off until the poorly imaged area are imaged well from Febraury 2007.
Posted by: volcanopele Oct 11 2006, 03:56 PM
actually no. I'm just a perfectionist...
Posted by: Spirit Nov 5 2006, 01:22 PM
So where can I find the last published map?
Posted by: ugordan Nov 5 2006, 02:02 PM
Try this: http://ciclops.org/view.php?id=871
I don't know if any more up-to-date maps were released in the meantime. IMHO, it would be high time to release an updated map with better Fensal-Aztlan coverage! (hint, hint, Jason ![]() )
)
Posted by: Greg Hullender Nov 22 2006, 05:52 AM
Almost half way -- 42 days down, 40 to go.
Unless that was a Saturn year, of course . . .
--Greg :-)
Posted by: Decepticon Nov 22 2006, 10:17 AM
I hope we get some color this time! ![]()
I can't wait to see a hybrid image/radar combination. ![]()
Posted by: JRehling Nov 22 2006, 06:48 PM
I can't wait to see a hybrid image/radar combination.
One way to do that would be to replace ISS data with RADAR where both are available, but the two are really different, and doing that would "hide" the nonredundant ISS data.
Maybe the ideal all-Titan display would be to take the ISS as the base map, perform a primary-component analysis on the VIMS data to associate with VIMS the #1 most important dimension that is different than the ISS imagery, and then use RADAR as the third input channel. Then associate G and B to ISS and VIMS (in whichever order) and R to RADAR in an RGB map: where RADAR is not available, set red to some baseline --not zero.
Posted by: Phil Stooke Nov 22 2006, 09:11 PM
Ingenious! But I think it might look like Grandma's wallpaper. I'd rather have separate maps of each dataset.
Phil
Posted by: volcanopele Nov 22 2006, 10:47 PM
for those with Photoshop, a map with different layers for each data set might be possible.
Posted by: scalbers Nov 23 2006, 03:53 PM
Greetings,
I think it might be interesting to try a map based on spatial filtering. In other words, larger scale details could be from ISS data and moderately finer details could be filled in with radar. VIMS could help perhaps in areas that ISS doesn't have coverage and vice versa? In any case, each dataset could fill in for those locations and spatial scales where they do best. Might be some effort, yet could provide a single more complete view.
Posted by: ngunn Nov 23 2006, 04:19 PM
I agree. Then each can do their own fancy tricks with them. I think an interesting one would be to do difference maps of infrared minus radar albedos
Posted by: antoniseb Dec 14 2006, 12:22 PM
The Ciclops page pointed to earlier was last updated in Early 2005. Have the more recent flybys covered new territory? Since we seem to be focusing mostly on Titan, it might be nice to get an updated composite image like that for every flyby. We have a new pass coming on December 27th. Can we get a nice new map in honour of Kepler's 435th birthday?
Posted by: ugordan Dec 14 2006, 01:30 PM
The official and updated Titan map was finished a while ago. It's obviously pending a release sometime soon (I'm really hoping by the end of the year, this hiatus has IMHO gone for long enough), maybe they're waiting for one of those significant dates to release. I'm thinking Christmas or the sorts. Probably updated maps of other icy sats as well.
Posted by: Julius Dec 19 2006, 08:23 PM
Has someone got an explanation why Titans dark flat plains are along the equator??Dont think that is coincidental!
Posted by: tuvas Dec 19 2006, 08:26 PM
It sounds like what you guys want is a JMARS for Titan. Jmars allows one to get all of the latest images (It doesn't do MRO, yet...), and compare between several different missions. It would work well to compare VIMS/RADAR/ISS images, there'd just be a layer for the whole planet. Of course, Titan doesn't have the large number of images that Mars does, but...
Posted by: Olvegg Dec 19 2006, 09:09 PM
It could be probably due to tides of Saturns that trigger plate tectonic. They are strongest in equatorial region. So dark areas may be analogue of ocean floor on Earth. And Xanadu and Adiri - Titanian analogue of continents?
Posted by: Matt Dec 19 2006, 10:13 PM
There was a time in Titan's earlier history when, apparently, it was subject to the same degree of tidal squeezing that Europa experiences today at Jupiter.
And thats a lot of tidal stress.
Posted by: JRehling Dec 19 2006, 11:16 PM
Notice that Venus's rifts run primarily along the equator and that the Valles Marineris is roughly equatorial on Mars. With the exception of Ganymede and Callisto (which is surfacewise totally dead), all of the solid worlds in that size range have signs of equatorial tectonism.
There's a compelling overlap to be made between Venus, Mars, and Titan. Xanadu = Tharsis? Hotei = Aphrodite? The similarities are intriguing.
Posted by: dvandorn Dec 20 2006, 06:14 AM
Hmmm... not *all* of the worlds in that range, since Venus and Earth are of near-identical size and mass. Earth has a lot of tectonic activity, but its shattered crust seems to exert more control over the orientation of rifts and crustal cracking than whatever it is on these other worlds that causes equatorial tectonics.
-the other Doug
Posted by: Juramike Dec 21 2006, 03:24 PM
Could differences with Earth and Venus be explained away by past/current history?
Earth's moon-making impact probably caused massive new cracks as it's surface reformed, and Venus's periodic resurfacing may reset the tectonic lines with each resurfacing event.
Maybe equatorial tectonics is the norm for mid-size worlds?
-Mike
Posted by: JRehling Dec 21 2006, 04:12 PM
-the other Doug
Yeah, but Earth is *slightly* out of the Titan-to-Venus size range...
To address Juramike's post, it's unclear why Venus and Earth have evolved so differently, but one suggestion is that Earth's ocean is a critical difference, because metamorphic rock formed when lava meets water is inherently lighter and softer than that formed when lava erupts onto a solid surface. As small as the ocean is compared to the bulk of the mantle below it, that may change everything, creating soft, light continental plates that form on top of the heavier slabs of ocean crust.
It's clear that Earth tends to dispose of its inner heat via horizontal movement of its crust while on Venus convection is more vertical. Earth lets a little heat out all the time whereas Venus seems to have rare global meltdowns when the crustal lid gets too much heat built up underneath it. The ocean difference is a plausible explanation.
Because Earth's heat dissipation involves the horizontal displacement of crust, "aboriginal" patterns have been obliterating by the wandering of plates, whereas on Mars, Ganymede, and possibly Titan, some of the ancient crustal landmasses are still there relatively intact with some considerable tectonism having reworked large portions of the surface.
Venus's case is different: The surface there is "ancient", but only about 700 million years old, showing the scars formed since then. The oldest surfaces of Mars and Ganymede are very roughly 3.5 and 4 billion years old, respectively. As for Titan, that's not clear, but there is more than just geology going on there, so on the small scale, we can't expect anything ancient. However, the large scale features (Xanadu, Tsegihi, etc.) may be quite old, and my bet is that they are, simply because Titan's large-scale features look more like Mars's than Earth's.
Posted by: jsheff Dec 28 2006, 07:24 PM
Please, please, please, can we have an updated map?
- John Sheff
Cambridge, MA
Posted by: volcanopele Dec 28 2006, 07:56 PM
- John Sheff
Cambridge, MA
Patience, it's not the end of the year yet.
Posted by: tuvas Dec 28 2006, 08:05 PM
Are you going to release the same map that you showed me once upon a time? Just curious, that's all.
Posted by: ugordan Dec 28 2006, 08:09 PM
Now see, THAT is not fair. You could have easily PM-ed him asking the same thing, but you wanted to "subtly" let the rest of us know you've seen the map as well. Not being a very good sport.
Posted by: tuvas Dec 28 2006, 08:15 PM
Actually, I could have waited for a few hours until he shows up here and ask him in person (We work in the same room and share an office that neither of us uses), but... It happens though when you share a room, he shows me pictures of Titan, Mimas, and the other Saturnian moons before they are released to the general public, while I show him pictures of Vikings, MER rovers, cool Martian geography, etc before it's released. It's all a fair trade, just so long as neither of us takes the pictures of the other, but merely looks at them, it's fair enough.
Oh, and I'm pretty sure that the map that will be released will be somewhat different, but... There's been a few flybys since that map was created, and there's been some names that have become official that weren't beforehand.
Posted by: ugordan Dec 28 2006, 08:23 PM
I'm perfectly aware you work near each other and are bound to see each others' work before the rest of us get to see it. I still feel that post of yours was more about rubbing our noses than anything else.
Just my 2c.
Posted by: AlexBlackwell Dec 28 2006, 08:36 PM
Just my 2c.
Hey, Gordan, it could have been worse: tuvas could have teased you with http://hirise.lpl.arizona.edu/HiBlog/?p=27#more-27 of Jason showing him the map. With the back of the map facing the camera, natch.
Posted by: tuvas Dec 28 2006, 08:57 PM
Hey, those images were released only a few hours later to the general public, so...
Posted by: ugordan Dec 28 2006, 09:21 PM
Brilliant, Stu! Brilliant! ![]()
Posted by: alan Dec 28 2006, 10:41 PM
End of year in 78 hours 19 minutes.
Now where is the smiley thats tapping his foot impatiently.
Posted by: ugordan Dec 28 2006, 10:47 PM
Actually, if we consider there's only one working day left this year, that End-Of-Year might be as well be tomorrow.
Posted by: Bob Shaw Dec 28 2006, 11:45 PM
Just my 2c.
My nose may be polished anytime; I look forward to more information, however slowly it has to appear, and enjoy the sense of antici...
...
...
(say it!)
...
...
...pation!
Bob 'Rocky' Shaw
Posted by: Decepticon Dec 29 2006, 12:15 AM
Wow cutie in the front!
Posted by: Decepticon Dec 29 2006, 12:18 AM
tuvas, from what you saw is the Titan map gonna blow last the last map out of the water?
I'm trying to get a feel for what to expect. ![]()
Posted by: volcanopele Dec 29 2006, 05:51 PM
Happy now?
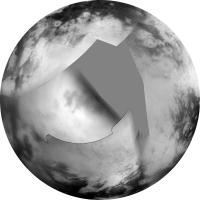
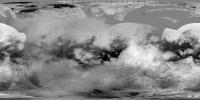
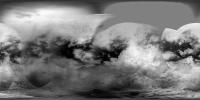
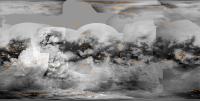
http://photojournal.jpl.nasa.gov/catalog/PIA08346
Posted by: AlexBlackwell Dec 29 2006, 05:55 PM
You've gotta be kidding. This is what all the fuss was about?
Posted by: JRehling Dec 29 2006, 06:56 PM
Boy, Alex is underwhelmed.
I'm glad to see it. I do find some of the seams surprising since they are "texture" seams, with shading captured pretty well. It seems like sometimes limited resolution was rendered hazily and sometimes it was rendered with an almost half-tone-looking grainy -- but sharp -- quality.
We're basically four good flybys away from bringing most of the "Here There Be Dragons" areas up to the standard of the rest of it: Two over Senkyo and Belet and two over the northern areas when the extended mission puts them into daylight.
Now let's add a splash of VIMS color and see if there's a graceful way to use RADAR data to sharpen up portions of the map without miscasting the RADAR data as being equivalent to IR (which it isn't).
Posted by: jsheff Dec 29 2006, 07:33 PM
I'm happy to have it, too.
-John Sheff
Cambridge, MA
Posted by: Stu Dec 29 2006, 07:40 PM
Ahhh, how soon we forget... ![]()
A couple of years ago Titan was just an orange-tinted spark next to Saturn in my telescope eyepiece on clear nights. I knew it was a world, because Voyager had sent back those images showing it as a murky orange ball, fuzzy atmosphere and all, but that was all anyone knew really. Now we have a picture of its surface, and, wonder of wonders, an actual map, showing it has landscapes and topography beyond our wildest dreams. I'm sure that map will get much, much better as time goes by, but for now I'm happy to have any map at all. Good work guys, thanks. ![]()
Posted by: volcanopele Dec 29 2006, 07:49 PM
For those who want a combined ISS map and RADAR swath (up to T8) Photoshop file, check out: http://pirlwww.lpl.arizona.edu/~perry/Titan_map/2006_map.release.psd. I was going to include a VIMS map from T8 and T9, but that ballooned the file to over 164 MB, almost 5 times its current 35 MB size.
Posted by: Decepticon Dec 29 2006, 08:08 PM
Ummm yes and no! I expected something a little more cleaned up.
I'm not bashing your work, I thought it would be a little more cleaned up.
Anyways gives all the Photoshop artist and chance to have some fun!
Thanks VP!
PS Great PDF!!!!
Posted by: volcanopele Dec 29 2006, 08:14 PM
Well, I'm still work on smoothing techniques across multiple data sets. I'll admit this one was more of a case of needing to get something out since we haven't had a released map update since January of last year. Unfortunately that's about as cleaned up as I could get it without using destructive low pass filters. The data is already a bit blurry, I see no point in making it worse.
Posted by: ugordan Dec 29 2006, 08:43 PM
I for one am not underwhelmed by the update as I realized any update couldn't bring much greater resolution than what was already available at Shangri-La. This is probably as high a resolution as we'll get from ISS. One must always keep the expectations reasonable. That's one of the reasons the overdue release delay bothered me, though. That said, I do find the Fensal-Aztlan region to be better defined than Shangri-La. As JRehling said, it appears less grainy. Weren't the pixel scales for the mosaics comparable? Is this a result of different camera parameters / filter combos as the Fensal region looks well defined, albeit including those texture seams? Am I right in assuming you didn't use every flyby that provided repeated coverage (over Fensal), for improved S/N ratio and reduced seaming?
Posted by: volcanopele Dec 29 2006, 08:46 PM
The mosaics used in the Fensal-Aztlan region have a higher pixel scale than those used in the Shangri-la region. Maps incorporating Ta and Tb REGMAP and HIRES should be available in a future release.
Posted by: Bob Shaw Dec 29 2006, 10:18 PM
Well, I for one am far from underwhelmed. A couple of years back, even seeing the 'H' in those early Earth-based images - remember? - seemed beyond belief. Now we're seeing so much more, and with the promise of more to come!
I can wait!
Bob Shaw
Posted by: ustrax Dec 29 2006, 11:09 PM
I can wait!
Bob Shaw
Bob is back!
Bob is raw!
Here's an "HURRAH!" for Bob,
the Shaw!
Posted by: Decepticon Dec 30 2006, 12:38 AM
![]()
![]() LOL
LOL
Posted by: nprev Dec 30 2006, 01:36 AM
I for one would love to see a surface temp overlay on all these features (yep...cryovolcano seeker here! ![]() )
)
Posted by: Decepticon Dec 30 2006, 02:40 AM
^^Maybe next Holiday Season! ![]()
Posted by: Olvegg Dec 30 2006, 11:31 AM
Well, there are some changes on Titan surface! ![]() Mezzoramia looks very pale compared to previous map and two or three white spots appear near 15 and 20 degrees WL. Yet another one white dot encircled in dark near 50 WL 65 SL disappear. What can it be? Really changes, artefacts of processing or just clouds?
Mezzoramia looks very pale compared to previous map and two or three white spots appear near 15 and 20 degrees WL. Yet another one white dot encircled in dark near 50 WL 65 SL disappear. What can it be? Really changes, artefacts of processing or just clouds?
Posted by: nprev Dec 30 2006, 06:34 PM
Good eye, Olvegg. I'd have to bet on convective clouds, especially for high-latitude features like these; seems like the polar regions are where most of the action's at for Titan's weather.
Posted by: volcanopele Dec 30 2006, 06:52 PM
Yeah, really bright spots at high latitudes are more than likely clouds. It seems that when ever we look at the south polar region at decent enough emission angles that the images can be used in maps, there are clouds down there, so it is hard to remove ALL the clouds from the map.
In terms of contrast difference, I chalk that up to differences in the my sharpening filter in the last 2 years.
Posted by: JTN Dec 30 2006, 11:16 PM
I've always been surprised that there aren't more amateur Titan ORS mosaics here. (I realise it's a bit of a challenge, but that doesn't usually stop you lot...)
Posted by: ugordan Dec 31 2006, 12:06 AM
Surprisingly, there aren't a whole lot of people playing around any Cassini images that I can see. Titan would make a pretty hard target to work with, given no easy way to reduce atmospheric haze. You really need excellent flatfields and either you can brew your own ones (hard to do manually) or work with the not so good ones on the calibration volumes. There's a lot to be desired there, especially for the wide-angle camera flatfields which would make simple mosaics easier than taking a shot at high-res NAC footprints. Geometric reprojection would also be handy since the exposures are long and the flybys pretty fast. SPICE kernels in other words...
Posted by: nprev Dec 31 2006, 02:31 AM
Just had an odd thought...Is Titan a cold "desert" planet?
Specifically, it almost seems as if the polar regions are the only areas where precipitation seems to occur with any degree of regularity. If Titan was a terrestrial planet with a similar pattern, the expectation would be that the lower latitudes were too hot to sustain an Earth-style hydrological cycle, and only the poles were temperate enough for habitation...like some of the pre-UMSF ideas about Venus, in some ways.
Again, just a thought. No matter how good our maps get, I think that interpreting them within an understandable framework will be a challenge for a LONG time.
Posted by: JRehling Dec 31 2006, 03:49 AM
Yeah. When the first flybys happened in 2004, I tried my hand at it, with some success, but it was a lot of work to lead to a modest product not that far in advance of the "pro" releases. I attached my work from the first 24 hours of the first flyby in July 2004. I didn't try this again.
I used a Hapke map I'd produced for some other world to adjust for phase effects, but I forget which world I had developed the model for. Mercury, I think. Then I just twiddled in Photoshop with no principles but what seemed to look OK. Composite of three ISS frames.
Posted by: Decepticon Dec 31 2006, 04:01 AM
Is there any online reference as to how the titan images are produced??
Tricks and Tips! ![]()
Posted by: Gsnorgathon Dec 31 2006, 07:45 AM
...
Why is that an odd thought? It sure seems a good fit to the available evidence. I wouldn't want to make any firm generalizations about poles vs equatorial regions until we've seen what happens as the equinox approaches, though. I'm hoping Cassini lasts long enough.
Posted by: Bob Shaw Dec 31 2006, 08:08 AM
Hmm... ...that'd mean camels, wouldn't it? Camels might indicate *life*. If there's life there must be awl (it's a dessert, see?). If there's awl, we better invade!
Hey, things are looking up for the unmanned spaceflight budgie!
Still, if it's a dessert the proof will always be in the pudding.
Bob Shaw
Posted by: scalbers Dec 31 2006, 03:51 PM
Tricks and Tips!
I think there was a CICLOPS release illustrating some of the processing steps. VP may also have mentioned some details. One of the more unique steps involved subtracting an image in a neighboring wavelength (from the 900nm passband) thus acting as a flat field. I suppose having a simple atmospheric model can provide similar flat-fielding information.
There were some sharpening steps as well to compensate for the haze diffusion.
Posted by: volcanopele Dec 31 2006, 07:28 PM
Tricks and Tips!
Check out my LPSC abstract on the subject from a couple of years ago:
http://www.lpi.usra.edu/meetings/lpsc2005/pdf/2312.pdf
Posted by: nprev Dec 31 2006, 08:40 PM
Hey, things are looking up for the unmanned spaceflight budgie!
Still, if it's a dessert the proof will always be in the pudding.
Bob Shaw
Well, at least we know the ice cream won't melt...EVER!
BTW, does anyone know what the current thinking is as far as 'methane monsoons'? Presumably they occur (if in fact they do) twice per Saturn year as the polar illumination gradually switches, and they probably wouldn't happen precisely at the time of the equinox due to thermal inertia. Any evidence of convective clouds creeping north from the southern hemisphere yet, or even happening further south due to the aformentioned inertia?
Some of the features in the equatorial regions remind me more and more of arroyos in the US Southwest. You have to wonder whether the atmosphere becomes supersaturated with methane and then one day just busts loose all over the equator...
Posted by: JRehling Dec 31 2006, 10:17 PM
BTW, does anyone know what the current thinking is as far as 'methane monsoons'? Presumably they occur (if in fact they do) twice per Saturn year as the polar illumination gradually switches, and they probably wouldn't happen precisely at the time of the equinox due to thermal inertia. Any evidence of convective clouds creeping north from the southern hemisphere yet, or even happening further south due to the aformentioned inertia?
Some of the features in the equatorial regions remind me more and more of arroyos in the US Southwest. You have to wonder whether the atmosphere becomes supersaturated with methane and then one day just busts loose all over the equator...
I happened to drive across Arizona on I40 on a snowy day shortly after the second (?) Cassini flyby of Titan and I couldn't help but notice how much it seemed to fit what we knew about Titan.
What we know from Voyager and Cassini seems to indicate that the summer pole gets a ring of convection around 80 N/S that creates a lot of rain there. What happens at the equinox or in the dark of the winter pole we don't know yet, but notice that there appear to be lakes in the winter pole now and perhaps at the summer pole as well. I imagine Ralph Lorenz has ventured some opinions. I would guess that the (near) poles get more rain than any other location, enough to fill up lakes that are still full through a decades-long drought.
One of the most important things about Cassini's extended mission will be to see what seasonal changes take place on Titan. Bigger cloud structures can be seen from Earth, though, and presumably from the Webb Space Telescope.
Posted by: nprev Jan 1 2007, 03:09 AM
Yeah, JR--I used to live in Tucson, and that's exactly the same impression I got. The entire area is usually dry as a bone all year until monsoon season hits in June/July, and then it's flash-flood time which produces/reinforces all these massive arroyos. Perhaps the same thing happens in Titan's equatorial regions every 14.5 terrestrial years or so...
Posted by: Juramike Jan 2 2007, 08:35 PM
Does anyone out there have a hypothesis/explanation for the distinctly swoopy pattern of the overall look of the margin of the of the bright terrain against the dark terrain?
It seems that the bright features have an almost parallel aerodynamic look to them. This is particulary evident in the margins around Shangri-La (basin).
This has been fascinating me since the first pass: to my eyes, they look almost like a terrestrial fjord landscape.
Could this be resulting from wind deposition of upland (bright) material from cryovolcanic airfall?
Or could this be from wind deposition of the organic “shizzle” which piles up downwind against the bright material?
Or is it possible that there has been an equivalent of a past ice age on Titan, with methane snows piling up, forming methane glaciers, and coming down off Xanadu and other upland terrains?
Any ideas?
-Mike
Posted by: Bob Shaw Jan 2 2007, 10:54 PM
It seems that the bright features have an almost parallel aerodynamic look to them. This is particulary evident in the margins around Shangri-La (basin).
This has been fascinating me since the first pass: to my eyes, they look almost like a terrestrial fjord landscape.
-Mike
Mike:
I don't quite know what 'swoopy' landforms are like, but as for the rest it looks just like the west coast of Scotland - a fjord landscape... ...AIRC, 'Scotland' was indeed one of the nicknames used back in the early days!
Bob Shaw
Posted by: JRehling Jan 3 2007, 03:29 PM
I don't quite know what 'swoopy' landforms are like, but as for the rest it looks just like the west coast of Scotland - a fjord landscape... ...AIRC, 'Scotland' was indeed one of the nicknames used back in the early days!
Bob Shaw
I just went back to the Planetary Sciences Yahoo! group and saw that at 4:09pm on July 2, 2004, I posted:
"Image N00006513.jpg... first thing I think of is a map of Scotland."
That was about 2 1/2 hours after the first images came down. Took a while to de-haze them enough.
My half-considered explanation for the Scottish shape would be that tectonic uplift in this area caused a lot of faulting with the same orientation, with the crust buckling according to different spatial frequencies. Large-scale buckles give the overall shape of Xanadu's northwestern "coast" while small-scale buckles make the whole thing look like corduroy... as do various locations up the Pacific Coast of the Americas, Scotland, and other places on Earth.
One of the interesting things is that Xanadu has moderately dark "lochs" near but not part of (or as dark as) Shangri-La. Probably the same sediments that darkened Shangri-La, but in lesser amounts.
Posted by: Juramike Jan 3 2007, 06:22 PM
One of the interesting things is that Xanadu has moderately dark "lochs" near but not part of (or as dark as) Shangri-La. Probably the same sediments that darkened Shangri-La, but in lesser amounts.
So, the tectonic uplift causes the general buckling....and then the infilling of the lowland basins by the dark material causes a ria (drowned valley) topography?
In this case the drowning of the valleys is caused not by a rise in seawater (like on Earth), but by the gradual infilling of the the dark material basins due to the organic "schizzle" raining down?
[Thus the dark lochs are shallower accumulations of the organic ooze.]
Or is a glacial event still a possibility?
-Mike
Posted by: Bjorn Jonsson Jan 3 2007, 11:17 PM
Yes, this is very surprising. In my case one reason is that all of my recent Cassini image processing has involved a huge map covering Saturn's entire southern hemisphere. See http://www.unmannedspaceflight.com/index.php?showtopic=2891, especially the message I posted there today.
One idea might be to reduce noise by reprojecting several images of the same (or roughly same) area into a simple cylindrical map containing their 'sum' (a similar idea to superresolution processing). However, this requires extremely accurate pointing information since there are no high contrast features to use as an accurate guide if the results of reprojecting two or more images don't exactly match. The Cassini index files (index.tab) contain viewing geometry information but when making the previously mentioned map of Saturn I got slightly more accurate results by using the SPICE kernels directly.
Posted by: Holder of the Two Leashes Jan 17 2007, 01:10 AM
Edit: Sorry, didn't realize the map had already posted. Should have read the earlier posts.
Posted by: scalbers Jun 21 2007, 09:47 PM
Greetings,
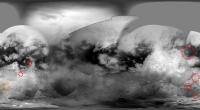
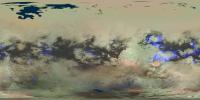
Here's a real quick 1K Titan map taking the latest official one from late 2006 and overlaying mosaics from a couple of the recent flybys. As usual this can be refined in the future. Perhaps even some north polar radar mosaics can be added if they are on a suitable projection - a certain map I noticed from EC comes to mind.
http://laps.noaa.gov/albers/sos/saturn/titan/titan_rgb_cyl_070621c.jpg
Posted by: David Jun 22 2007, 12:04 AM
Here's a real quick 1K Titan map taking the latest official one from late 2006 and overlaying mosaics from a couple of the recent flybys.
Very nice!
But it gets me thinking again about the global distributions of different terrains and climates on Titan. The overall picture seems clear: Titan is a semi-desert moon, wet at the poles, very dry around the equator, with an equatorial belt of sand-seas in (it seems) lower terrain. Which raises the following questions for me:
1) Why is the equatorial belt so irregular in shape? Just chance variations in elevation?
2) What constrains the desert belt to north and south? Or to put it another way, what's going on in the temperate zone in terrains that would be deserts if they were equatorial?
Posted by: stevesliva Jun 22 2007, 04:53 AM
That's nice!
Although a mercator projection centered at the equator distorts exactly what is interesting at Titan... ![]()
Posted by: Juramike Jun 22 2007, 03:00 PM
Wow! Nice job!
-Mike
Posted by: Juramike Jun 22 2007, 03:15 PM
Elevation differences, yes. Chance? Maybe not.
I suspect Xanadu might be playing a role. It might be acting like Tharsis bulge on Mars. Big cryovolcanic construct, big mass put on surface, gets drifted to equator. Why the Sand Seas are where they are on either side of Xanadu and in approximate line with the Equater is bugging me too. The pattern of Tharsis/Vallis Marineris on Mars and Xanadu/Fensal-Quivra-Azltan = "The Big H" on Titan is eerily similar.
Also, since we haven't imaged all of Titan in really good detail, there could be other low-lying Sand Seas in temperate zones as well. (And what would a raised Sand Sea basin look like?) Mezzoramia might be one of these.
A really good question! Is it elevation? Or is it methane rainfall? Or is it something else entirely? (Maybe the sand sea basins are "special" and the "normal" surface is like the temperate zones.)
-Mike
Posted by: dvandorn Jun 22 2007, 04:13 PM
Interesting speculation, Mike. I see your point about the similarities between the Xanadu/Fensal-Quivra-Azltan construct and Mars' Tharsis bulge.
However -- just how efficiently could Titan shift its orientation when locked into a tidal resonance with Saturn? Mars spins very fast, relatively speaking, and has a whole lot more rotational energy with which to shift the entire planet onto its side (so to speak). Titan, in contrast, spins very slowly on its axis and has the very deep Saturnian gravity well to deal with. I'd almost believe that tidal attraction from Saturn would supply more energy to such a process than Titan's own rotational energy could provide.
If Titan's mass was redistributed in a manner similar to what happened on Mars, I'd be willing to bet you'd see the thing reach an equilibrium with the "heaviest" part of the mass tidally locked, facing Saturn. Is that what we're seeing here? If not, I have to wonder a bit as to how the mechanism would work...
-the other Doug
Posted by: Juramike Jun 22 2007, 06:53 PM
That's a really good point, David.
Without doing the math (yuk!), I'd guess tidal effects (including eccentricity) would swamp out the rotation rate.
So I'd guess it would make more sense for the Xanadu bulge to be at either the Subsaturn point or at the AntiSaturn point. And at longitude 90-100 W, it's pretty much in the wrong spot.
Now I'm even more clueless.... ![]()
-Mike
Posted by: dvandorn Jun 22 2007, 06:57 PM
I'm glad I could confuse you even moreso than before, Mark... ![]()
-the other DOUG (![]() )
)
Posted by: Juramike Jun 22 2007, 07:20 PM
Apologies! I meant "That's a really good point, DOUG".
(With all this new information, the connection between the two hemispheres of Juramike's brain finally snapped. Juramike could never again place the name of an object with it's shape. For the rest of his natural life, Juramike referred to any bowl-like object as "crater" )
![]()
Posted by: scalbers Jun 22 2007, 10:20 PM
Hi again,
I've made a few more map updates and increased the size to 4K. This is also now posted on my regular web site at the following URL:
http://laps.fsl.noaa.gov/albers/sos/sos.html#TITAN
Interesting to see what looks like those long rivers flowing toward the seas of the north pole.
Posted by: alan Jun 23 2007, 05:05 AM
But it gets me thinking again about the global distributions of different terrains and climates on Titan. The overall picture seems clear: Titan is a semi-desert moon, wet at the poles, very dry around the equator, with an equatorial belt of sand-seas in (it seems) lower terrain. Which raises the following questions for me:
1) Why is the equatorial belt so irregular in shape? Just chance variations in elevation?
2) What constrains the desert belt to north and south? Or to put it another way, what's going on in the temperate zone in terrains that would be deserts if they were equatorial?
Looking at the global view I see three different units: large areas of bright terrain, the dark 'sand seas' forming an incomplete belt around the crater, and below 30 degrees south a gray area.
The gray area appears to have been overlooked in these discussions. Anyone have an idea about why it is it different that the bright terrain with a similar latitude in the northern hemisphere?
Posted by: belleraphon1 Jun 23 2007, 04:32 PM
Beautiful work ....
Agree that Titan seems to be a desert world but we have to be careful not to carry that analogy too far.
Remember that Huygens detected a lot of methane coming out of the ice/hdrocarbon regolith (smurst?) after it impacted.
I am REALLY looking forward to better views of the southern pole. We need to understand how the the 7 year summer at the south pole has affected the methane cycle and the geochemistry and geophysics in that region as well.
More FUN coming up juramike!!!!!!!!
Craig
Posted by: Phil Stooke Jun 23 2007, 07:23 PM
stevesliva said:
"That's nice!
Although a mercator projection centered at the equator distorts exactly what is interesting at Titan... "
I want to comment on this because I have encountered this elsewhere. The most fundamental cartographic product - and the hardest to make - is the initial global mosaic itself. Once you have it, it can be reprojected into any other form of map with appropriate software. I will post a polar view of Steve's new map later to demonstrate. Don't think of the simple cylindrical map as an end in itself, it's an image database which can be turned into any other map projection, or wrapped around a sphere, or animated... etc. And frankly the simple cylindrical is just about the easiest of those things to make the other products from.
I encountered this with my new Eros mosaic - why make an old-fashioned flat map? Why not project it onto a 3-D shape model and animate it? - but where do you think the mosaic to project onto the model comes from in the first place?
(oh, and yes, it's not Mercator! It's Simple Cylindrical, where a degree is represented by a specified number of pixels in both E-W or N-S directions. In Mercator the N-S spacing varies away from the equator.)
Phil
Posted by: ngunn Jun 23 2007, 08:44 PM
I can't wait for that polar version. I've been hoping someone would provide a south polar map of Titan for ages. I even posted a request on CICLOPS. So far I've only seen it in small PDF format used as a base for the flyby groundtracks.
Posted by: ngunn Jun 23 2007, 09:16 PM
Hallelujah!
Posted by: David Jun 24 2007, 12:40 AM
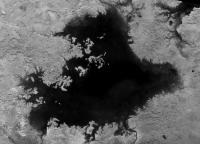
Beautiful, just beautiful. Now that we've seen the radar of the northern region, it's a little easier to interpret the dark markings at the south pole, although it now becomes a matter of wonder why the 'bean-shaped' lake is, not just a lake, but one with such smooth and nicely curved boundaries, unlike both the northern lakes and the other lakes in its vicinity.
I wonder if the "gray" areas in the temperate zones might be -- I'm not sure of a proper terminology that doesn't imply vegetation, but anyway -- swamp, or wetland -- shallow lacustrine regions that are intermittently (seasonally?) dry, or at any rate more like perpetually damp, methanelogged land, than like lakes, thus perhaps being an intermediate term between the polar lakes and the equatorial deserts, which (as suggested above) might be concealing a fair bit of subterranean moisture as well.
Posted by: alan Jun 24 2007, 06:03 AM
Maybe they aren't perpetually damp. It could be a seasonal change.
I'll stick my neck out and make a wild prediction: after the equinox the gray area in the southern hemisphere will brighten and a new gray area will form in the northern hemisphere.
Remember, you heard it here first.
Posted by: Reckless Jun 24 2007, 10:12 AM
This is my first post on a Titan thread.
The Bean shaped lake looks like it is sitting in a volcanic caldera.
I know it's only a 2d map on which deapth is very hard to infer, the area around the lake seems to be sloping away from it.
Roy ![]()
Posted by: Ian R Jun 25 2007, 12:42 PM
I'm not sure how useful this will be, but here's my attempt at combining the ISS and VIMS mosiacs of Titan:
The original ISS image (thanks Steve!):
The original VIMS from the JPL Photojournal (latitude and longitude lines removed):
Ian.
Posted by: ngunn Jun 25 2007, 12:49 PM
I think the bean-shaped Ontario Lacus does in fact resemble the individual lobate extremities of the large northern lake as seen by ISS, both in size and apparent roundness.
Posted by: Juramike Jun 25 2007, 02:41 PM
Dear Steve, Alan, and Phil,
Wow! That's an awesome combination (of effort and images)!
Based on this combination of ISS and VIMS images, I speculatively identified additional "circular objects of interest" beyond those in this http://www.unmannedspaceflight.com/index.php?s=&showtopic=4177&view=findpost&p=91758.
Here are the newly tentatively identified "craterforms" drawn on the mosaic made by Steve (Circles drawn outside the tentative diameter of the craterform for clarity):
What is also really cool about the combo of ISS and VIMS data is the huge amount of dark blue ice sand in the outer dark halo of Minrva. This would help support that connection between the dark blue ice sand halo and Minrva.
Wow!
-Mike
Posted by: tty Jun 25 2007, 02:56 PM
The word you are looking for is "playa"
tty
Posted by: David Jun 25 2007, 06:01 PM
tty
Playas are typically a bit drier than what I was imagining. The "desert" regions might equally be characterized as playa.
Posted by: ngunn Jun 25 2007, 07:26 PM
mudflats?
Posted by: Juramike Jun 25 2007, 07:53 PM
How about a "goo-flat"?
Methane rain bring down organic shizzle where it accumulates into masses/drifts/globs on the surface. Without a major flooding event it will sit and get coated in "bright material" or other atmospheric coatings.
Picture an on Earth full of shallow water like a flooded bayou. Then frogs lay oodles and oodles of humungous egg masses all over the place. As the water evaporates (or drains away) the gelatinous gooey egg masses are revealed on the surface. Imagine walking around with jiggling, gross, yukky masses forming a rough terrain as far as the eye can see.
I imagine the Titanian "goo-flat" would look like that.
(Slightly RADAR rough, ISS/VIMS would look like brighter material - definitely not dark blue ice sands nor dark brown dune sands)
[[Not a place for a romantic holiday]].
-Mike
P.S. Does anyone know what Death Valley (Badwater with the salt crystals) would look like by SAR? Would it appear roughish?
Posted by: JRehling Jun 25 2007, 08:30 PM
Funnily enough, Death Valley is shown on the Wikipedia page for SAR.
http://upload.wikimedia.org/wikipedia/en/2/20/Death-valley-sar.jpg
Looks somewhat Huygens-like to me!
Posted by: Juramike Jun 25 2007, 09:14 PM
Amazing! It does look pretty similar!
It took a few twists and turns with Google Earth to realize that this is of the northern (dune) part of Death Valley.
Unfortunately, Badwater is just to the SSW from the lowest part of the image. I was wondering if the knobby little salt incrustations ('bout 10-20 inches across if I remember correct) of Devil's Golfcourse (near Badwater) would show up and similar to Cassini SAR of the Temperate zones.
So close....
-Mike
Posted by: rlorenz Jun 26 2007, 02:39 PM
Highly variable, as it turns out (as the image posted shows).
Some of the very saline salt flats at Death Valley buckle on
scales larger than the radar wavelength and thus are very rough and hence bright ;
ditto the very rubbly Devils's Golfcourse or whatever it is called.
Then you have really flat things like Racetrack playa which acts like a mirror
(even more so when wet) and thus appears radar dark...
Posted by: scalbers Jun 26 2007, 08:23 PM
Greetings,
Thought I'd mention a slight cleanup on the Titan map that I've now posted at this URL:
http://laps.noaa.gov/albers/sos/sos.html#TITAN
One can keep fiddling with this thing for quite a while...
Posted by: CAP-Team Jun 26 2007, 08:47 PM
Steve, isn't your map aligned in a different way other maps have been submitted? I can't overlay your map onto previous maps.
Posted by: scalbers Jun 26 2007, 09:08 PM
Cap-Team - this is hard for me to say. This should be the same as my previous iteration. It is centered on 180 degrees longitude and is a cylindrical equidistant projection if that helps you to overlay it.
Posted by: Juramike Oct 11 2007, 05:00 PM
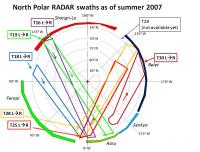
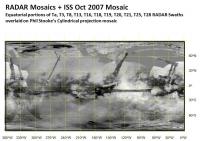
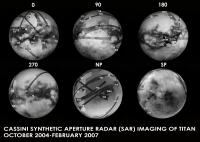
I created a graphic showing currently available north polar RADAR swaths that dip partially into the Equatorial Sand Sea.
This is adapted from the graphic in Mitchell et al IOF 2007 Abstract 6042 "Titan's North Polar Lakes as Observed by Cassini RADAR: An Update." (Abstract freely NO LONGER available http://adsabs.harvard.edu/abs/2007LPICo1357...97M. ![]() )
)
I've been using this to help make RADAR composites of Equatorial Sand Sea Basins:
-Mike
Posted by: Juramike Oct 16 2007, 03:15 AM
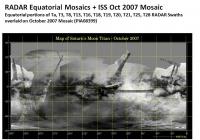
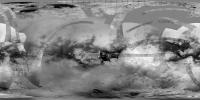
The Planetary Photojournal has release a new ISS Mosaic of Titan today! PIA08399.
Available at: http://photojournal.jpl.nasa.gov/catalog/PIA08399
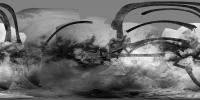
I have taken all the Equatorial RADAR swath sections and overlaid them onto this new Mosaic:
Enjoy!
-Mike
Posted by: belleraphon1 Oct 16 2007, 12:54 PM
Nice map. Mike.... thanks.
And we have your plots on the south polar projection....
http://www.unmannedspaceflight.com/index.php?s=&showtopic=3698&view=findpost&p=102003
Will be very interesting to see what ALL the instruments reveal there.
Been reviewing the literature on clouds and hydrocarbon lakes and Titan climate models. What CHANGES will we see in the future....will comment later.
A world-view is slowly beginning to develop.
Craig
Posted by: Phil Stooke Oct 16 2007, 01:11 PM
Juramike - post 115: go through LPI instead:
http://www.lpi.usra.edu/meetings/icysat2007/pdf/6042.pdf
Phil
Posted by: Phil Stooke Oct 16 2007, 01:49 PM
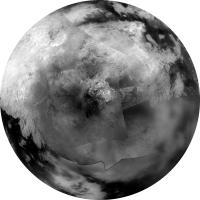
This is the new radar map of the north pole added to the new ISS map:
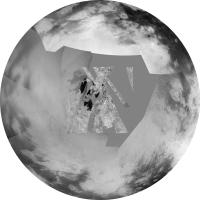
and here's the northern hemisphere from that map in polar (equidistant azimuthal) projection.
Phil
Posted by: ugordan Oct 16 2007, 01:54 PM
Great stuff, Phil!
I don't suppose there's a slightly less compressed version of the cylindrical map to be had?
Posted by: Juramike Oct 16 2007, 04:21 PM
Wow! Thanks, Phil!
That really fills in the northern terra incognita in the cylindrical projection! Nice to see it all being realized.
-Mike
Posted by: belleraphon1 Oct 16 2007, 04:27 PM
Fantastic Phil....
Craig
Posted by: Olvegg Oct 16 2007, 04:37 PM
Phil, it's really fantastic ![]() Thank you very much.
Thank you very much.
Posted by: Juramike Oct 16 2007, 05:16 PM
Hokay.... I tried to add the equatorial RADAR pieces over Phil Stooke's latest map to give a big RADAR composite on top of ISS images:
It sorta lines up, except in the mid-latitudes of the equatorial pieces (my fault, I have no idea how to warp and adapt the equatorial swaths to cylindrical projection in the higher latitudes.)
At least it might help some future mapping goo-roo line it all up for real. (Phil? ExploitCorporations? Scalbers? Somebody heeeelp?)
-Mike
Posted by: David Oct 16 2007, 05:58 PM
I'd love to see Phil's map in a proper Mercator projection -- those northern lakes would look HUGE. ![]()
Posted by: volcanopele Oct 16 2007, 10:29 PM
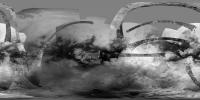
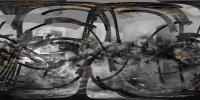
Here is the simple cylindrical map with reprojected versions of all the SAR swaths between Ta and T21 except the HiSAR stuff and T18 (will try to add that soon):
Posted by: Juramike Oct 16 2007, 10:38 PM
Beautiful!
Thanks, VP!
-Mike
Posted by: elakdawalla Oct 17 2007, 04:22 AM
You're the man, VP.
--Emily
Posted by: belleraphon1 Oct 17 2007, 01:11 PM
Thanks VP!!!!
Is this release of the ISS Titan map part of your work?
I was just using this map to enlighten an office mate!!!!! Exploring a world by investigating the different equatorial albedo regions. Then the serendipty of the north polar passes (I know that main reason was to crank the inclination for CASSINI).
Soon we will have more RADAR over the south pole.
Those radar noodles across the surface and the refined imaging data really serve to illustrate that method. Fuzzy features slowly come into focus. The slow pealing away of mystery to reveal details with even more mystery.
Neat thing would be to have a movie showing the early Keck maps and then slowly overlaying the different CASSINI map versions (including each RADAR noodle as it occurred) until we see the current state. That would be a neat educational tool.
Any of you image gurus game for that?
Thanks to the CASINI team and all you UMSF folks!!!!!
Just Glorious!!!!
Craig
Posted by: Phil Stooke Oct 17 2007, 06:01 PM
... and another version. Here I've taken VP's latest map and combined it with mine to link the radar strips. Then I did a bit of contrast modification. Less compressed, for ugordan.
Phil
Posted by: ugordan Oct 17 2007, 06:24 PM
Outstanding, thanks a lot Phil. That's a keeper!
Posted by: rlorenz Oct 17 2007, 11:37 PM
Phil
Nice map
I'd love to see the movie someone described of morphing HST-Keck-etc-Cassini as our
knowledge improves. Could even start with the two-spot model fit to the near-IR lightcurve
in the early 90s
I notice on this map at the extreme left, just above the bunny rabbit, some vaguely
N-S striations (dunes) that I hadnt seen before and seem to be orthogonal to the
more typical orientation. Are these real or are they some sort of ISS artifact ?
Posted by: Phil Stooke Oct 18 2007, 01:33 AM
"I notice on this map at the extreme left, just above the bunny rabbit, some vaguely
N-S striations (dunes) that I hadnt seen before and seem to be orthogonal to the
more typical orientation. Are these real or are they some sort of ISS artifact ?"
Heh heh! Good one, Ralph...
Phil
Posted by: David Oct 18 2007, 06:38 AM
N-S striations (dunes) that I hadnt seen before and seem to be orthogonal to the
more typical orientation. Are these real or are they some sort of ISS artifact ?"
Heh heh! Good one, Ralph...
Er... isn't he being serious? I certainly think I see what he's talking about (including the "bunny rabbit", a bright two-eared formation that seems to be jogging along briskly to the west.) There's a rather large north-south dune field surrounding the Martha's Vineyard-shaped island with the big crater up around Tisbury. Doubtless I'm being dense and not seeing the joke -- unless this is just an in-joke between Ralph and Phil, in which case I won't be embarrassed.
Posted by: rlorenz Oct 18 2007, 05:00 PM
I think Phil is picking up on my possibly unfair skepticism : if it's not Scottish, it's crap. Same for
RADAR.
Ralphocentric view is - orientation of features is contrary to expectation , could it be an
artifact? If so, it is then an ISS artifact.
If it is real, it would be very interesting.
Posted by: David Oct 18 2007, 05:59 PM
RADAR.
Ralphocentric view is - orientation of features is contrary to expectation , could it be an
artifact? If so, it is then an ISS artifact.
If it is real, it would be very interesting.
Well, the more northerly of that set of ISS images overlaps with a radar swath, so you could compare them. I'm having no luck finding a more detailed version of that swath, though -- I expect that won't be a problem for you.
Posted by: Juramike Oct 18 2007, 07:17 PM
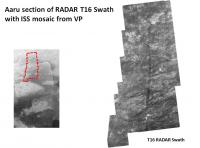
The more northerly set of images is part of the T16 RADAR Swath (the leftmost section) which has been released as PIA09112 (available http://photojournal.jpl.nasa.gov/catalog/?IDNumber=PIA09112). The right end of this swath is the section that drops down into Aaru basin. Here is a graphic which shows where T16 ends up in relation to the ISS "verticle lines".
There is a "secret swath" that passes much closer to the Playboy peninsula and also overlaps with some of the Ta RADAR swath. Unfortunately, this has not yet been released. [I'm drooling with anticipation since this might've come close to a cool-o interesting multi-ring feature].
-Mike
Posted by: Phil Stooke Oct 18 2007, 07:24 PM
Duh - sorry, Ralph. I thought you were making a joke about the n-s trending straight lines at the top of the map... reprojected grid lines. I should never have doubted you. I never will again... well, not very often.
Phil
Posted by: David Oct 18 2007, 07:53 PM
Thanks, Mike! That certainly does make it look like the seeming N-S dune field is artifactual -- there are real dunes in there, but they're going W-E. I'll certainly look forward to further radar swaths in this region.
Posted by: volcanopele Oct 18 2007, 11:46 PM
Ralph, those are artifacts. The original CB3 images (or MT1 images, I can't recall at the moment) were taken in 8-bit mode in that area, so you see some effects from the dithering. And regarding the implication that if it isn't RADAR, it's cr@p, I'm telling!!! ![]()
BTW, here is the updated map with all RADAR SAR swaths in the PDS at the moment (including all the HiSAR stuff).
Posted by: belleraphon1 Oct 19 2007, 12:07 AM
VP...
Right now, you rule, man!!!!!
Even if I am more partial to the detail in the SAR...
Craig
Posted by: Juramike Oct 19 2007, 02:31 PM
OK, I've [almost] given up.
Does anyone have any idea where the T19 Distant targeted look fits in?
I've been struggling to fit this in and just haven't been able make it work.
-Mike
Posted by: rlorenz Oct 19 2007, 04:07 PM
Thanks VP - I figured that was the case. I guess a partial retraction is in order -
IF you take out the artifacts, and IF you somehow know whether a dark splot is
a sand sea or a methane lake, THEN the imaging is really pretty interesting .....
Posted by: volcanopele Oct 19 2007, 04:26 PM
a sand sea or a methane lake, THEN the imaging is really pretty interesting .....
That's what my divining rod is for.
Posted by: Juramike Oct 19 2007, 05:01 PM
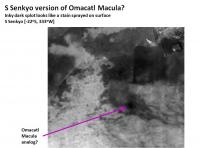
Speaking of dark splots...the new mosaic shows a really nice dark splot down in S Senkyo basin.
Could this be an artifact or a Senkyo version of Omacatl Macula?
(It seemed to be present on the older maps as well, the newer mosaic brings out the contrast).
-Mike
[EDIT: Feature indicated]:
Posted by: volcanopele Oct 19 2007, 06:20 PM
That little spot is one of my favorite little areas. Not sure what it is. It isn't an artifact, it has been seen in a number of mosaics covering this region. One possibility is that it could be a buried impact crater. In this area, it would appear we have bright material partly covered in dunes, but we have this circular feature that is much darker than the surrounding terrain. Perhaps this is an impact crater that has been subsequently filled in with sediment, then covered in dunes. Another possibility is that it is similar to Omacatl, a cryovolcano with an ashfall deposit, but this really doesn't have the same, parabolic shape that Omacatl and Elpis have.
Posted by: Juramike Oct 19 2007, 06:54 PM
The parabolic inky black shape of Omacatl and Elpis Macula(e?) would be due to the prevailing winds causing the cryoashfall drift.
But the wind strength varies as Titan moves around in it's orbit, if the General Circulation Models are correct.
So...maybe the S Senkyo splot [name needed here] was a single-shot deal done during a calm-wind period. That would give it a nice regular circular diffusion to the fallout pattern rather than a downwind parabola.
Any chance this feature was imaged in the "secret unreleased RADAR swath"?
-Mike
Posted by: volcanopele Oct 19 2007, 07:14 PM
I doubt that. Winds can vary, but I doubt there would dead calm for the duration or an eruption or eruptions, particularly at the altitude of the top of the eruption column.
Okay, I'll bite. What secret, unreleased SAR swath? T23?
Posted by: Juramike Oct 20 2007, 01:15 AM
Yup. T23 (Jan 13, 2007) RADAR Swath.
I'm hoping they release it soon.....
The few images they've released (Ganesa Macula, half-crater image) are teasingly cool-o....
-Mike
Posted by: alan Oct 27 2007, 06:19 PM
Some new images of Titan were taken on October 22. They cover the lowest resolution area on the latest Titan maps.
http://saturn.jpl.nasa.gov/multimedia/images/raw/raw-images-details.cfm?feiImageID=130136
Posted by: ugordan Oct 27 2007, 06:52 PM
http://saturn.jpl.nasa.gov/multimedia/images/raw/raw-images-details.cfm?feiImageID=130136
And here's a quazi-flatfielded version of that image along with a really dodgy enhancement:
http://i108.photobucket.com/albums/n15/ugordan/N00094374_flat.jpg http://i108.photobucket.com/albums/n15/ugordan/enhanced2.jpg
Edit: updated with a slightly better enhanced image.
Posted by: Floyd Nov 18 2007, 02:52 PM
Maping question. For locked moons, is 0 degrees on the maps the direction towards Saturn? What is the convention for this sort of thing? Hope this is not too stupid a question.
Posted by: scalbers Nov 18 2007, 04:45 PM
Yes that is how I understand it with zero degrees longitude towards Saturn...
Posted by: JRehling Nov 18 2007, 05:41 PM
That's the convention everywhere from Luna to Charon. Given nutation, etc., the details may be more complicated, but that's the gist.
Posted by: Phil Stooke Nov 18 2007, 06:55 PM
That is indeed the basic idea, but because of orbital eccentricity etc which makes the sub-planet point move around a bit the actual zero point is defined relative to a specific feature on the surface. That has not yet been done for Titan. The feature in question does not have to be on zero longitude, but zero is measured relative to it.
Phil
Posted by: dilo Nov 18 2007, 09:56 PM
Hey Gordan, what do you think of this further enhancement of your last version? I see a lot of details, are they real?
Posted by: Floyd Nov 18 2007, 10:58 PM
Thank you for the responses to my map question. Floyd
Posted by: rlorenz Nov 19 2007, 01:42 AM
....
Yeah - Subsaturn point wobbles back and forth about 3 degrees in longitude over the course of an orbit.
This all assumes strictly synchronous rotation - turns out that may not quite hold (see my DPS
abstract) - may be a bit of a seasonal swing in longitude too - so things may get a little complicated.
Posted by: dvandorn Nov 19 2007, 06:23 AM
Here's a question that seems appropriate in this context:
What is thought to be the primary cause of nutation in planetary moons? Is it gravitational, and does nutation by gravitational perturbance require a body to be significantly non-homogenous? Or is it thought to be remnant motion imparted by large impacts? Or is it a range of influences, no one of which can be cited genercially as "primary"?
I ask because while you might expect to see impact-related nutation on a scarred body like the Moon, you don't seem to see large basins on Titan whose formation could have been expected to toss a body out of kilter...
-the other Doug
Posted by: edstrick Nov 20 2007, 09:56 AM
Planetary photojournal released a nice tif format 80 degree (approx.) phase titan pic yesterday.
I ran a bandpass filtering on it to being out every last bit of surface detail in the data.
The atmosphere seems to be pretty featureless in this band, though there's general east-west diffuse streakiness in the north <less visible in the south> at high lattitudes.
Posted by: alan Jan 10 2008, 01:13 AM
Will the CICLOPS map page be updated this month?
http://ciclops.org/maps.php
Posted by: Doc Jan 10 2008, 10:53 AM
-the other Doug
Perhaps there USED to be a basin but has been literally wiped of the face of Titan.
Imagine trying to identify the Chicluxub crater (the Dinosaur killer?) here on Earth from space using such imagery as those being produced by Cassini.
Not as easy as it seems, eh?
Posted by: DrShank Jan 11 2008, 03:16 AM
on a related topic, does anyone have or knowlocation of a Titan Radar Planning chart showing
swath locations? most curious where the 4-year tour mapping coverage will get us to...
paul
Posted by: Exploitcorporations Jan 11 2008, 12:59 PM
I'm not sure where I stumbled across this a while back, but here's an old map of the planned RADAR swaths (looks like early 2005):
Posted by: Exploitcorporations Jan 11 2008, 01:07 PM
Using VP's awesome new http://pirlwww.lpl.arizona.edu/~perry/RADAR/, we can revisit http://photojournal.jpl.nasa.gov/catalog/PIA09035. All those noodles are starting to make me hungry.
Posted by: ugordan Jan 11 2008, 01:32 PM
That looks like Joe Knapp's map of planned coverage. The thing is, any one of those swaths could have been flipped (look direction from left to right and vice versa) and I'm pretty sure some have actually been flipped to look at some interesting regions.
Posted by: Decepticon Jan 26 2008, 02:41 PM
I just wanted to clarify if all radar swath for the north polar region have been released?
Posted by: helvick Mar 27 2008, 07:13 PM
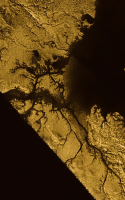
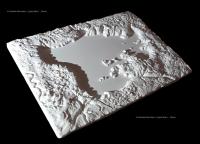
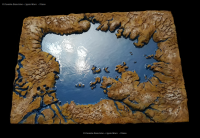
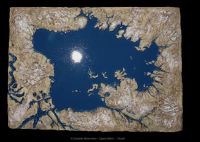
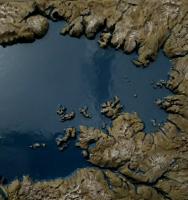
Didn't want to create a new topic for this but some bloke http://www.evs-islands.com/2008/02/titans-unnamed-methane-sea.html of Titan's largest northern sea and has a couple of questions about it that I'm sure there are folks here who know the answer.
I don't know about anyone else but I'm a sucker for nautical\coastline maps like these and even at a basic level like this having someone make one for a sea on an entirely different world is pretty cool.
Posted by: volcanopele Mar 27 2008, 08:12 PM
I posted an answer to his question on his blog. He'll need to approve it for it to show up.
Posted by: scalbers Jul 12 2008, 03:41 PM
Greetings,
Here is a version of Titan made using the second most recent official IR release, with Gordan's image from post #151 added on top.
This map, plus the radar overlay one from Jason's web site (see post 165) will be interesting to view with Science On A Sphere.
Steve
Posted by: David Jul 12 2008, 04:08 PM
Here is a version of Titan made using the second most recent official IR release, with Gordan's image from post #151 added on top.
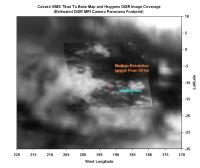
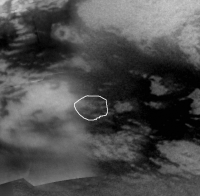
Is it possible to pinpoint the Huygens landing site on this map?
Posted by: titanicrivers Jul 16 2008, 06:35 PM
"Is it possible to pinpoint the Huygens landing site on this map?"
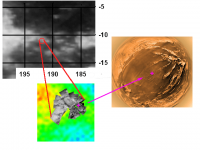
Look at this image of combined VIMS and DISR views of the landing site.
Go back to the map and in the center
Posted by: Juramike Jul 18 2008, 11:56 AM
In addition to the images posted above by titanicrivers:
Check out this http://www.unmannedspaceflight.com/index.php?s=&showtopic=4685&view=findpost&p=101732 (Huygens Landing Site data, post#13) for ISS and RADAR views of the Huygens Landing Site
And this http://www.unmannedspaceflight.com/index.php?s=&showtopic=4685&view=findpost&p=101638 (Huygens Landing Site data, post#8) shows a zoom of the T8 RADAR Swath at the Huygens Landing Site location.
Hopefully soon (cross fingers, touch wood, nudge gently) there will be better views released from some of the more recent RADAR passes.
-Mike
Posted by: Juramike Feb 27 2009, 12:12 PM
Whoo-hoo! New Global Titan map released today!
http://photojournal.jpl.nasa.gov/catalog/PIA11149
Posted by: scalbers Feb 28 2009, 04:35 PM
Nice to see the additional coverage, though this seemingly has more pronounced seams than some of the older versions.
Posted by: tedstryk Feb 28 2009, 06:04 PM
Pun intended?
Posted by: nprev Feb 28 2009, 06:10 PM
Okay, let's not cross any lines here... ![]()
Posted by: scalbers Feb 28 2009, 06:26 PM
We are on the threshold of an unseemly post ![]()
Posted by: scalbers Mar 3 2012, 08:23 PM
Greetings, here's the 2011 CICLOPS Titan map shown with feature names:
Latest version with full resolution: http://laps.noaa.gov/albers/sos/features/combined_titan_lon_zero_center.png
Looks like the Huygen's site is near the "t" in Antilia Faculae.
Steve
Posted by: scalbers Mar 3 2012, 08:42 PM
And here's volcanopele's 2011 radar map with feature names. More of the smaller lakes are labeled:
Latest version with full resolution: http://laps.noaa.gov/albers/sos/features/combined_titan_radar_lon_zero_center.png
Steve
Posted by: Phil Stooke Mar 3 2012, 11:30 PM
As for the seams... don't forget these are preliminary rather than final mission products. There's not much point putting all that effort into making a perfect map if it's going to be superceded very soon. You'll see much better stuff after Titan imaging is finished.
Phil
Posted by: tanjent Mar 4 2012, 06:56 AM
I have to marvel at how much remains unknown about Titan, even after eight years of flawless performance by Cassini/Huygens.
There is certainly a huge amount left to be sorted out by an airplane or balloon mission, not to mention floating and seismic platforms.
All treats in store for future generations, it would seem.
Posted by: machi Mar 15 2012, 07:07 PM
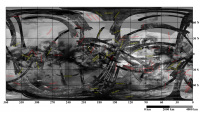
One of the Jason's map (thanks!) with labeled SAR swaths (all of them between T00A to T071 and even one from T77 flyby).
It's in PDF format, so it's easier to find location of every radar swath of Titan.
White labels - "normal" SAR swaths.
Yellow labels - Hi-SAR swaths.
Red labels - mostly Hi-SAR swaths not used in background map.
http://planets.wz.cz/saturn/satorig/tit_cas_dam_007.pdf
Posted by: titanicrivers Mar 19 2012, 12:54 AM
Thanks Machi for that very useful update of the Titan map! VP's maps are awesome but the overall map was not labeled and (at least in this blogsphere) are now more useful due to the white labels especially.
Below is your map (at reduced size and resolution) with a coordinate grid as many referenced photos and swaths are given by such coordinates.
Posted by: JRehling Mar 23 2012, 05:06 PM
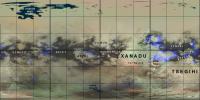
Here's my take on Titan, an effort I've wanted to pursue to get a map that is relatively seamless, relatively tied to scientific reality, and relatively complete. I shared this with a few people last fall.
First, a huge component of what I have began with the maps that Fridger Schempp has posted at the following link. Everything I have produced is built on his contribution, which may well be 90% or 99% of the total work that produced my map.
http://forum.celestialmatters.org/viewtopic.php?t=305
My work is based on, in essence, a black-and-white map, which is Fridger's with a few added areas of focus, particularly the northern lakes and seas as seen by RADAR (fused in with IR imagery of southern Kraken), plus some IR coverage here:
http://photojournal.jpl.nasa.gov/catalog/PIA14908
The most original portion of my work is in adding a color overlay. Color information for Titan comes from VIMS, and the coverage is highly variable depending upon incidence angles. This produces some ugly seams that I wanted to eliminate at the hazard of throwing out the scientific and accurate information (which is not well captured in those seams, anyway).
My approach in producing the color map was to combine two sources: First, global VIMS maps as seen here in the second map, using channels: B=1.27 μm, G=2.0 μm, R=4.8-5.2 μm.
http://europlanet.dlr.de/node/index.php?id=482
I also used VIMS details from the (very exciting) paper here:
http://barnesos.net/publications/papers/2011.11.Icarus.Barnes.Evaporite.pdf
The second color source (and the bridge used to connect those areas where VIMS coverage is poor) was the thematic mapping of equatorial areas in the particularly inspiring in Figure 19.19 Chapter 19 of "Titan From Cassini Huygens".
My overall approach was to extend the thematic mapping (which had a VIMS-inspired palette for the bright/blue/brown regions) to the higher latitudes, without providing much detail besides the categorical existence of the lakes and seas, and the VIMS-orange areas such as Tui, Hotei, and as seen in the evaporite paper. I blended the thematic map and the VIMS products with no principle other than aesthetics, trying to keep the VIMS details whenever possible without creating ugly (and implausible) seams.
It is exciting for me to contemplate the mapping of chemical composition to color; the five basic colors of my map are:
Blue: VIMS-blue areas, like the methane-wet sands where Huygens touched down. (Dark blue except in eastern Xanadu, where the blue signal covers bright terrain.)
Dark Brown: VIMS-brown areas, the sand dunes in equatorial regions.
Orange: HC3N deposits that are evaporites, left also in cryovolcanic regions.
Dark aqua: The methane/ethane lakes and seas.
"Bright": rendered yellowish in Stephan, et al, but varying in hue in VIMS products, notably more greenish in Xanadu where the 2.0 μm signal is stronger; coincidentally, radar volume scattering is stronger there too, which made me consider greenish overlays to distinguish how volume scattering looks to me in ice. The ambiguity of the composition of this bright terrain fed a major obsession in my reading the past few months; an intriguing story that has left us so far uncertain what is covering the largest portions of Titan.
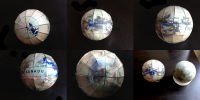
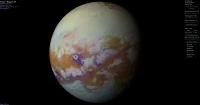
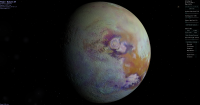
I've attached a labeled version of the map. This has been repackaged a lot of ways: Unlabeled, a petal map, and a globe. I can upload the unlabeled and petal maps later if people are interested. I also attached some pictures of the resulting globe, and a side-by-side of the Titan globe with the Europa globe I made with the USGS map.
There is some work that can be done, especially in waiting for more coverage of the northern areas, and more VIMS coverage to add resolution in the color, where I airbrushed it into a pleasing but not always accurate seamlessness. But I can say that I have a Titan globe beautifying my home.
Posted by: Floyd Mar 23 2012, 05:24 PM
Fantastic, thank you!
Posted by: ngunn Mar 23 2012, 06:36 PM
Yes please! These are the brilliant fruits of a most worthy project. I'm sure quite a few people will relish the prospect of making their own Titan globe.
Posted by: JohnVV Mar 27 2012, 04:21 AM
there is the Perl script from
http://www.vendian.org/mncharity/dir3/planet_globes/
for taking a map and turning it into a globe"
Posted by: JRehling Mar 27 2012, 03:39 PM
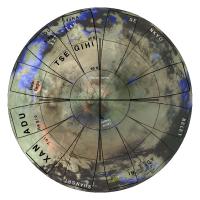
The file sizes are quite large. I saved them as low-loss jpgs, and I'll post each separately. Here is the south polar petal plot.
Posted by: JRehling Mar 27 2012, 03:40 PM
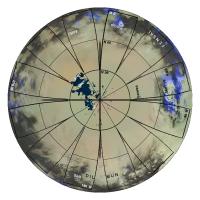
And here is the north polar petal plot. I left an azimuthal orthographic map as the background for the petals, so if you want a little "tab" to extend beyond the margins, you have something that looks about right. If you cut right on the lines, this won't matter.
I applied the labels and grid after reprojecting this, so you won't get such a nice result if you reproject the cylindrical map.
Posted by: JRehling Mar 27 2012, 03:43 PM
Finally, here is the cylindrical map without labels. I hope people find this useful for widespread use in Celestia, etc.
Posted by: scalbers Dec 9 2012, 07:17 PM
At the AGU conference this past week I saw a Titan presentation showing a couple of de-noised radar images. For me it really makes the features stand out and saves the "on-the-fly" visual image processing needed to see the features. I wonder if anyone has considered processing most or all of the radar data with this type of algorithm, and if this can be the basis for a global map?
Here is an older example of this type of processing:
http://www.planetary.org/multimedia/space-images/charts/titan_cassini_sar_denoising_example_aharonson.html
Posted by: machi Dec 9 2012, 07:58 PM
According to his personal page, http://web.gps.caltech.edu/~alucas/res.html intends to post online his denoised images of Titan soon.
I'm using different kind of non-local denoise filter - PureDenoise from Florian Luisier which isn't so good for SAR images as Deledalle's algorithm, but it's best
from filters which are available.
Here is little comparison (it's crop from T44 swath):
Posted by: titanicrivers Apr 3 2013, 09:51 PM
A small portion of the cool T59 SAR shows a possible rain dissected, southern, antiSaturn hemisphere plateau. A 'denoised' (thanks for the link to PureDenoise Machi http://bigwww.epfl.ch/algorithms/denoise/ )version of this topography is shown below. While an improvement on the jpeg images posted on VP's awesome site http://pirlwww.lpl.arizona.edu/~perry/RADAR/BIUQH67S152_D201_T059S01_V02.jpg, there is a vertical banding artifact that I am sure someone out there knows how to eliminate. I am hopeful another SAR will image near this Titan location as an ISS dark albedo area is nearby, perhaps an old, mid latitude S hemisphere basin.
Edit: I am grateful to JohnVV for his destriping of this image, improving it substantially. The coordinates and scale bar are approximate.
Posted by: JohnVV Apr 3 2013, 10:30 PM
a quick run through isis3's "dstripe"
just a first guess , and still needs a bit of work
http://imgbox.com/adfVcyDI
a crop of
http://pirlwww.lpl.arizona.edu/~perry/RADAR/BIUQH67S152_D201_T059S01_V02.jpg
without denoising first , "dstripe" tacks care of most of that
------
for that i tend to use gmic
that line removes most of the " salt&pepper "
Posted by: titanicrivers Apr 5 2013, 03:37 PM
Much thanks JohnVV for above. Have used your image to modify my T59 snippet map on the previous page. Must confess I am a Windows user and not familiar with isis. Is there a destripe type plugin for ImageJ?
Posted by: machi Jan 28 2016, 06:39 PM
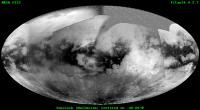
Preliminary global map of Titan. Version 0.2.0.
Informations are directly in the map and on Flickr page.
https://www.flickr.com/photos/109586958@N03/24046183303/
Posted by: JRehling Jan 28 2016, 07:37 PM
Beautiful work, Machi! It's a challenge to get the very low-res topographical data merged with the albedo map, but your result is thought-provoking. With my Titan map/globe, I skipped the topographical data to focus on the color, but the topography is definitely worthwhile as well. With better data, a map could provide all three, but low-res topography doesn't lend itself, I guess, to being demonstrated through shading.
Posted by: Phil Stooke Jan 28 2016, 07:51 PM
Yes! All your maps are really nice, and this superb combination of datasets is very useful, especially since there really is nothing else like it.
Phil
Posted by: machi Jan 28 2016, 08:34 PM
Thanks Phil!
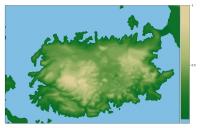
Yes, merging elevation data with SAR/ISS map was maybe the most difficult part. Elevation data have very low resolution (1 or 2 pixels per degree) so topography shading is effectively impossible. So this isn't topographic map, it's SAR/ISS map with overlaying low-res elevation data (BTW, the same data which Ralph Lorenz used in his first ever topographic map of Titan). I also wanted to include VIMS data as in your very nice map but there isn't yet VIMS map with quality which I need.
Posted by: Ian R Jan 28 2016, 09:31 PM
Great map Daniel! I'm only browsing on a mobile device, but even so, the quality and sheer level of detail are clearly evident.
Posted by: Decepticon Feb 28 2016, 09:54 PM
Do those maps contain SAR radar data after June 7, 2012?
I have seen no Full swaths released after that date.
Posted by: ngunn Feb 28 2016, 10:31 PM
I've noticed that as well. I check Jason Perry's SAR site from time to time but the flow of new data appears to have stopped.
Posted by: Ian R Feb 29 2016, 07:14 AM
This USGS mosaic contains all radar swathes up to and including the August 2014 T-104 data return:
http://astrogeology.usgs.gov/search/details/Titan/Cassini/Global-Mosaic/Titan_SAR_HiSAR_MosaicThru_T104_Jan2015_clon180_128ppd/cub
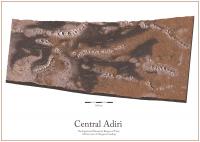
I used this mosaic and combined part of it with a cleaned and de-seamed and colorized ISS mosaic to produce this dynamic view of Adiri:
https://flic.kr/p/DXhSYehttps://flic.kr/p/DXhSYe by https://www.flickr.com/photos/10795027@N08/, on Flickr
Posted by: Ian R Feb 29 2016, 07:17 AM
A list of the recent radar returns:
T-83
--- Sequence S73, May 21, 2012
http://pds-imaging.jpl.nasa.gov/data/cassini/cassini_orbiter/CORADR_0239/EXTRAS/
_________________________________________
T-84
--- Sequence S73, Jun 06, 2012
http://pds-imaging.jpl.nasa.gov/data/cassini/cassini_orbiter/CORADR_0240/EXTRAS/
___________________________________________
T-86
--- Seq S75, Sep 26, 2012
_________________________________________
T-91
--- Seq S78, May 23, 2013
http://pds-imaging.jpl.nasa.gov/data/cassini/cassini_orbiter/CORADR_0248/EXTRAS/
_________________________________________
T-92
--- Seq S79, July 10, 2013
http://pds-imaging.jpl.nasa.gov/data/cassini/cassini_orbiter/CORADR_0250/
_________________________________________
T-95
--- Seq S80,Oct 13, 2013
http://pds-imaging.jpl.nasa.gov/data/cassini/cassini_orbiter/CORADR_0253/EXTRAS/
_________________________________________
T-98
--- Seq S82, Feb 02, 2014 (redelivery)
http://pds-imaging.jpl.nasa.gov/data/cassini/cassini_orbiter/CORADR_0257/EXTRAS/
_________________________________________
T-104
--- Seq S85,Aug 21, 2014
http://pds-imaging.jpl.nasa.gov/data/cassini/cassini_orbiter/CORADR_0261/EXTRAS/
Posted by: volcanopele Feb 29 2016, 07:59 PM
Yeah, I haven't been keeping it up, mostly because the RADAR team now includes JPG versions of the SAR swaths in the Extras section of their PDS releases, as Ian R links to.
Posted by: craigmcg Mar 31 2016, 02:00 PM
Here's a nice summary map that just came out: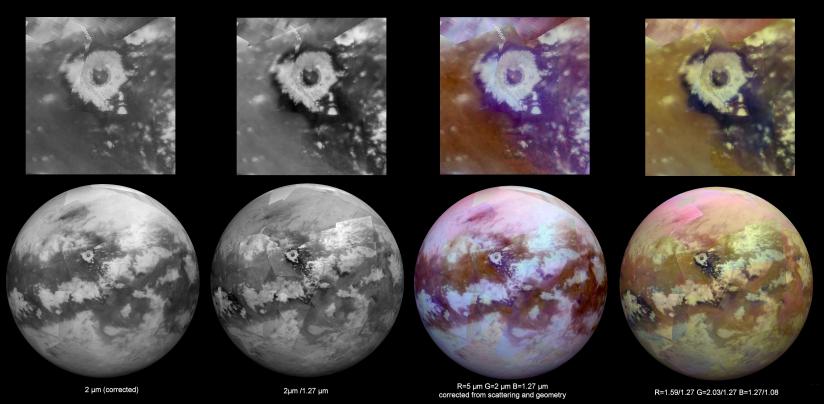
Link to page: http://photojournal.jpl.nasa.gov/catalog/PIA20022
Posted by: Juramike Apr 1 2016, 02:43 AM
Those are images, not maps. Maps are derived products from data such as this.
Just quibbling a bit....
Posted by: stevesliva Apr 1 2016, 05:02 AM
Just quibbling a bit....
But they're composited -- what steps that up to a map?
Posted by: Phil Stooke Apr 1 2016, 06:21 AM
"Just quibbling a bit...."
A groundless quibble, I'm afraid. This is VIMS data, collected over more than a decade - the high resolution VIMS cubes only cover small areas. So all that material has been assembled into a global mosaic (a mapping procedure if ever there was one) and is presented to us in an orthographic map projection - another mapping procedure. The small image of a crater might be 'not a map' but the global mosaic certainly is.
Phil
Posted by: Juramike Apr 2 2016, 12:31 AM
A basemap for mapping, maybe. But I wouldn't consider the VIMS dataset an interpreted or representative map product. Nor would I consider the SAR mosaic, even if normalized to a standard incidence angle, a true map product.
Just at what point does an image become a map product is a good question, and probably open to interpretation? Is an image a map already at acquisition? After calibration? Data correction? Radiometric correction (very very difficult on Titan)? Mosaic assembly? Projection? Contrast-enhancement and recolorization with a color scale? Scribbling colors and annotations on the data?
For me, mapping is the point where someone start scribbling interpretations, annotations, and representations on top of the dataset: "The rim of the crater is located here". "This is a mountain, the boundary is here." "This land is called Adiri" "Here there be tygers.", etc.
-Mike
Posted by: JohnVV Apr 2 2016, 12:59 AM
it depends on the person/artist
for me it is when i can render a image from a sphere or mesh , basically a seamless texture
for others it is the annotation of locations
Posted by: t_oner Dec 26 2016, 09:05 PM
Here is a non-local denoising filter: http://ximagic.com/d_index.html . Not as good looking as Antoine Lucas' work but better than none.
Posted by: Floyd Dec 28 2016, 01:44 PM
Your link gave seven different denoising filters, which one or ones did you use?
Posted by: scalbers Dec 28 2016, 03:33 PM
Very nice view of Ligeia Mare. In the long run this could really improve the global radar maps. On the link I recall just one of the filters was the "non-local" one.
Posted by: t_oner Dec 28 2016, 04:13 PM
It is a single plugin with 7 different algorithms. Non-Local Denoising gives the best results which is the same method used by Antoine Lucas. There is also a free Java plugin for ImageJ used by medical researchers which I did not try. http://imagej.net/Non_Local_Means_Denoise
Attached image is a crop from PIA09218, uncompressed files give a better result as expected (slightly sharpened). The success of the algorithm is measured by the difference with the original, which should be purely noise and not have any discernible features common with the original (may be except noise bands, artifacts etc.)
Posted by: scalbers Apr 1 2017, 02:40 PM
Here's a paper describing techniques for extracting more detail from ISS images.
https://arxiv.org/pdf/1103.3215.pdf
Posted by: Phil Stooke Apr 1 2017, 04:03 PM
I find this even more impressive:
http://www.hou.usra.edu/meetings/lpsc2017/eposter/2518.pdf
(link to LPSC poster)
Phil
Posted by: scalbers Apr 1 2017, 05:14 PM
Thank for noting this Phil, I earlier inadvertantly posted another semi-related link. Here is what I was also looking at, the same work that you are noting:
http://www.hou.usra.edu/meetings/lpsc2017/pdf/2518.pdf
It's neat to see how the ISS images now show more detail near the Huygens landing site.
Posted by: Ian R Jun 30 2018, 05:27 PM
I'm pleased to finally be able to reveal the fruits of a project that's been a long time (~4 years) in the making: an updated, amended, and restored version of the 2013 https://astrogeology.usgs.gov/search/map/Titan/Cassini/Global-Mosaic/Titan_ISS_Globe_65Sto45N_450M_AvgMos.
https://flic.kr/p/28xQsqWhttps://flic.kr/p/28xQsqW
https://flic.kr/p/28xR3P5https://flic.kr/p/28xR3P5
https://flic.kr/p/25ShRc9https://flic.kr/p/25ShRc9 by https://www.flickr.com/photos/10795027@N08/, on Flickr
Credit: NASA/JPL/Space Science Institute/Cassini Data Analysis Program/USGS Astrogeology Science Center/Ian Regan
This restoration was done primarily for the big screen film https://www.imdb.com/title/tt1879017/, by Stephen van Vuuren. For more details on the mosaic, and how I processed the polar regions completely from scratch, please visit the film's website: https://www.insaturnsrings.com/titan-seam-blending
Posted by: antipode Jul 1 2018, 01:04 AM
Wonderful!
Just out of interest. Is that a lake, past or present, at roughly the 6 o/clock position perhaps about 60 south in the southern hemisphere polar projection?
P
Posted by: Ian R Jul 1 2018, 01:15 AM
Thanks!
In answer to your question, that dark feature is Polaznik Macula — a formation that plays host to two suspected temperate lakes: Sionascaig Lacus and Urmia Lacus:
http://thedragonstales.blogspot.com/2015/06/sionascaig-lacus-and-urmia-lacus.html
Posted by: ngunn Jul 1 2018, 01:17 PM
Truly magnificent maps! A joy to let the gaze wander freely at last over this wondrous world.
Posted by: PDP8E Jul 1 2018, 07:32 PM
Ian,
Wow, those maps are fantastic! Thank you for showing us your long hard work. The explanation of how you did it, is inspiring. You are one cool cat!
Posted by: Phil Stooke Jul 3 2018, 01:46 AM
Agreed! These are beautiful.
Phil
Posted by: Daniele_bianchino_Italy Jul 6 2018, 08:48 PM
wow! ![]()
Posted by: sittingduck Jul 7 2018, 08:30 AM
Ian, these are simply wonderful. Thank you!
Posted by: Ian R Jul 7 2018, 10:48 PM
Thanks everyone for the positive responses. ![]() As I'm sure you can imagine, this data was an absolute bear to work with, so although room for improvement undoubtedly exists, I'm generally delighted with the results.
As I'm sure you can imagine, this data was an absolute bear to work with, so although room for improvement undoubtedly exists, I'm generally delighted with the results.
I intend to post versions incorporating the SAR radar data (perhaps colour-coded? I'm undecided on the exact presentation.)
But for now, here are those three image products again, this time merged with topographical information from a paper by https://www.hou.usra.edu/meetings/lpsc2017/pdf/2703.pdf:
https://flic.kr/p/27xduX2
https://flic.kr/p/27xduX2
https://flic.kr/p/28QJZiY
https://flic.kr/p/28QJZiY
https://flic.kr/p/Kg9Mdn
https://flic.kr/p/Kg9Mdn
Blue areas represent low-lying regions up to -1,800 metres below the average. Red areas indicates peaks of up to 650 metres.
Posted by: nprev Jul 8 2018, 12:54 AM
Let me add my voice to the chorus of ![]() ...incredible work, Ian.
...incredible work, Ian.
Interesting that there's a high region (...for Titan; pretty flat place, really) adjacent to the north polar sea complex. Gotta wonder if that provides orographic lift & enhances precipitation to feed them.
Posted by: hendric Jul 9 2018, 06:56 PM
Thanks for the amazing maps Ian. Titan, being the Hydrocarbon Moon, is rather beautifully rendered like a colorful oil sheen!
Posted by: Bjorn Jonsson Jul 11 2018, 12:20 AM
Awesome maps and clearly a lot of work that was required to complete them. Titan isn't exactly the easiest 'image processing target' to work on.
Posted by: Daniele_bianchino_Italy Jul 12 2018, 11:39 AM
Ian R Magnifico! You did what I always wanted. I was hoping for these maps !!
This is the most fascinating world after the Earth. No doubt.
The missions to observe Ligeia mare or Kraken sea closely are my dream, for my most important opinion of some primary mis-seals on Mars.
This is my Ligeia mare model 12x17 cm. Handmade. No 3D printer. I know, it's not perfect.
http://antidotumtarantulae.altervista.org/Bianchino_Daniele_Titan_moon_titano_model_Ligea_Mare_Ligeia.html
What color would you think of ethane-methane seas? I maybe I had to do this sea in black?
Posted by: Ian R Jul 15 2018, 07:54 AM
Perhaps a deep, black-ish-brown would be the right colour? Even so, it still looks great Daniele!
Posted by: Ian R Jul 15 2018, 07:56 AM
Another exercise in seam removal, but this time applied to stacked radar data from multiple Cassini flybys:
https://flic.kr/p/LXdTPyhttps://flic.kr/p/LXdTPy
Posted by: Ian R Jul 15 2018, 08:38 AM
And this one might be of interest to Daniele ![]()
https://flic.kr/p/26k4V2C
https://flic.kr/p/26k4V2C
Posted by: sittingduck Jul 15 2018, 02:49 PM
My goodness Ian those are phenomenal. Do you have plans to make more? I feel like I've never seen the lakes this clearly.
Posted by: volcanopele Jul 15 2018, 05:13 PM
That map of Ligeia is amazing. I like how visible the river that flows into NE Ligeia is (can see that in ISS data)
Posted by: JRehling Jul 15 2018, 05:54 PM
Ian, so much good work in every one of these products.
If I may, here is a brightened version of the Ligeia image, to emphasize details within the lake. It's clear that the channels continue well past the current shoreline, which would seem to indicate a lower surface level in the past.
Posted by: Daniele_bianchino_Italy Jul 16 2018, 05:54 PM
You are fantastic Ian R. If I had time I would do every possible lake of Titano .. probably I'll do Ontario Lacus or Kraken MAre.
Posted by: jasedm Jul 16 2018, 06:16 PM
At the risk of not actually adding anything to the discussion, I concur. These are fabulously clear views - congratulations to all for the hard work.
Posted by: hendric Jul 16 2018, 06:35 PM
Amazing work Ian, looks like we are flying over it! Ligeia looks to my like a Gryphon or large bird.
Posted by: v7x Jul 20 2018, 04:19 AM
Seeing Titan with Infrared Eyes
https://photojournal.jpl.nasa.gov/catalog/PIA21923
Is it possible we will get a map version of this?
Posted by: Phil Stooke Jul 20 2018, 04:09 PM
You have to have it as a map before it can be rendered as a spherical view. Eventually it will be released.
Phil
Posted by: Phil Stooke Mar 25 2019, 07:52 PM
Mind-boggling experience follws:
https://data.caltech.edu/records/1173
A merged VIMS-ISS map of Titan. It is similar to the map projected into globes above.
Phil
Posted by: JRehling Mar 25 2019, 08:36 PM
That is really nice! Minimizes the seams and artifacts about as well as one could ask for given uneven coverage in the original data. Among other things, I really appreciate the way that Xanadu stands apart from the bright (but not AS bright) terrain to its south and east.
Posted by: ngunn Mar 26 2019, 07:55 PM
A splendid map indeed. I hope somebody decides to manufacture globes based on that.
Posted by: ngunn Mar 27 2019, 08:13 AM
Very nice. Where do you get the relief information to generate the shading in those views?
Posted by: JohnVV Mar 27 2019, 02:17 PM
the height data from the SAR footprints closely match the black and white imaging data on a large scale
and seeing as there is no shadowing in the images i used that map( not the new colored map above) as a base to make a normal map
there is a tool for celestia that correctly maps the normals to a sphere ( called "nms" )
but more on that is for the image processing forum
Posted by: ngunn Mar 27 2019, 08:47 PM
That's as much explanation as I was hoping for, much appreciated. The results are beautiful and entirely plausible.
Posted by: vikingmars Mar 28 2019, 07:36 AM
Thanks a lot JohnVV.
Your renderings are very nice indeed and make Titan looks like a planet taken from our sci-fi TV series of the 60's or 70's (Star Trek and Space : 1999) ![]()
Posted by: sittingduck Feb 6 2020, 01:08 PM
I have made an impressionist map of a segment of the T8 radar swath including several of the mountains ridges of central Adiri. The topography is greatly exaggerated for illustrative purposes.
https://www.astro.rug.nl/~oberg/central_adiri.jpg
I used the following sources to help inform the illustration:
- Jason Perry's Titan RADAR SAR Swath's website
- Ian Regan's ISS global map
- Lopes et al. 2019 "A global geomorphologic map of Saturn’s moon Titan"
- Radebaugh et al. 2007 "Mountains on Titan Observed by Cassini Radar"
- Liu et al. 2015 "The tectonics of Titan: Global structural mapping from Cassini RADAR"
Please let me know if anything goes too far beyond artistic liberties and could stand to be corrected.
- Nick Oberg
Posted by: Phil Stooke Feb 6 2020, 05:35 PM
That's a beautiful piece of work. I hope we will see more!
Phil
Posted by: charborob Feb 6 2020, 05:41 PM
The style of this map reminds me of Middle-earth.
Posted by: stevesliva Feb 6 2020, 06:36 PM
Yes, but are there https://www.tor.com/2017/08/01/tolkiens-map-and-the-messed-up-mountains-of-middle-earth/
Nice!
Some of the context links:
https://pirlwww.lpl.arizona.edu/~perry/RADAR/biuqi05s250_d065_t008_v00.part2.jpg (relevant swath)
https://data.caltech.edu/tindfiles/serve/30784dd6-d568-4997-8207-0563faefd247/ (global with labels)
Posted by: Phil Stooke Feb 6 2020, 10:40 PM
That piece about the mountains of Middle Earth doesn't hold up when you look beyond the Americas. Check out Siberia, Iran. the vast region north of India, not to mention the Balkans. As a Tolkien fan from long ago and far away, I don't have a problem with his map...or Titan's mountains. Or especially this new map.
Phil
Posted by: nprev Feb 7 2020, 09:47 AM
What an outstanding work of visualization! Great outreach tool, too. Very, very impressive, Nick. ![]()
Posted by: Ian R Mar 19 2020, 06:49 PM
That's stunning, Nick!
Posted by: Antdoghalo Jun 8 2020, 09:16 PM
Hey, I don't know if any of you remember me but, I used to drop by once in a while asking for stuff like "reprojected maps of Io" etc.
That was back when I had a weaker computer and Google Earth didn't allow maps to cross the international dateline. Ever since then, I have got a better computer and after the lockdown began, I had time to to update my collection of maps and the Google Earth Solar System overlay. I noticed that there was no updated map combining the ISS map with the HiSAR map but I found some separate ones in USGS Astrogeology. What I did was I got the ISS and HiSAR maps and combined them into one map. Then I added color from the Huygens lander images to the whole globe. The image is 16K so it is suitable for both Google Earth and Celestia.
I didn't do any fancy stuff and the noise from the original USGS maps are still there but it was something I wanted to do since the only map combining HiSAR with ISS was from T71 (July 2010) and it's only 11K B/W.
The map is up to date as of T104 (January 2015)
Here s a link to the full size version. (16K)
https://www.flickr.com/photos/60012030@N02/49986587138/in/dateposted-public/
(2K thumbnail)
Posted by: ngunn Jun 10 2020, 06:59 AM
How could we forget? Many thanks for making and sharing that. New Titan map products are always welcome.
Posted by: scalbers Jun 10 2020, 10:05 PM
Very nice to see this Antdoghalo. I wonder how it might look if the radar component is overlain on the ISS-based map from Ian Regan?
http://www.unmannedspaceflight.com/index.php?s=&showtopic=3168&view=findpost&p=240167
https://www.flickr.com/photos/10795027@N08/43023455582/
Posted by: Antdoghalo Jun 11 2020, 01:24 PM
This was mainly an experimental thing I did (I didn't think my computer was able to even work on it. It took 20 minutes to complete each task of the process over a few hours but the computer pulled through like the little engine that could). I have since noticed there are some other planetary objects where lower resolution data from older spacecraft could be used to fill in unmapped areas like Phoebe, Charon, and Pluto (which you did a good job adding, Albers). One thing I hope eventually does happen is a map gets released showing radar coverage up to T126 in spring 2017, only then can we have the ultimate updated map of Titan until another probe visits.
I could take a shot at combining Ian's map with the USGS radar map later on this summer.
Posted by: Antdoghalo Jun 26 2020, 03:30 PM

https://www.flickr.com/photos/60012030@N02/49986587138/in/dateposted-public/
Well, I combined them and the shading is a disaster between the two maps. While it is nice to have increased resolution (and see a couple more of the North Polar lakes,) its so bad I wonder if simply inverting the brightness would actually make it look better. My computer was barely able to make this hulking monstrosity after a couple crashes with GIMP. Someone with a much stronger computer would have to dedicate a lot of time to eliminating the brightness inconsistencies.
I've tried to look for an updated RADAR map up to T126 prior to mission's end but I cannot find one. The later swaths not included in this one cover a lot of the unmapped areas.
Posted by: Phil Stooke Jun 26 2020, 08:06 PM
I don't think inverting the brightness is the solution. Making the radar layer partially transparent (50%, or varied a bit to see how 40 and 60 look) might be a better option.
Phil
Posted by: kymani76 Jun 26 2020, 10:44 PM
My take at the map in question....There is ISS base overlaid by radar data up to T-104 and false-colored by VIMS data...Can post bigger one in pdf if there is interest...
Posted by: kymani76 Jun 26 2020, 10:52 PM
Close up of the Selk crater area and a bluish render of the Kraken Sea.....
Posted by: Antdoghalo Jun 30 2020, 05:52 PM
Here is a near perfect version. (2K thumb of 16K image)
https://www.flickr.com/photos/60012030@N02/50062486346/in/dateposted-public/
While making a map of Mars, I discovered a tool in GIMP that was perfect for this. Now it looks like a normal ISS map at first glance but upon zooming in, one would find this map holds a LOT of surprises!!!
BTW, nice color maps Kymani
Posted by: scalbers Jul 1 2020, 09:29 PM
Indeed - great to see the surprises!
Posted by: sittingduck Aug 27 2020, 01:46 PM
Recently I have tried to put together an informed but decidedly artistic depiction of the topography of Mayda Insula.
I have used as a basis the relatively low resolution DEM derived from Cassini RADAR stereogrammetry from Kirk et al. 2008. This has been modified to trace apparent dissection of the terrain visible in the T25 and T28 RADAR swaths, as well as the beautifully processed version made available here by Ian. Finally this has been loosely verified by iteratively illuminating the resulting DEM and comparing it with the radar image to try to by-eye match highlights and shadows resulting from the topography. Finally I have convolved the DEM with a gaussian kernel to ensure it is still largely in agreement with the original Kirk et al. elevation model.
All in all it is far from perfect, but it was an interesting exercise and hopefully you will enjoy the result. I include a top-down view of the DEM, an animated gif comparing my illuminated DEM and the RADAR image, and an oblique perspective view of the island (or peninsula, seems hard to find anyone certain about this) with exaggerated elevation.
Posted by: ngunn Aug 28 2020, 01:25 PM
Very nice, thanks for posting.
I just found this interesting article on the topography of another special place - the Huygens landing site:
https://agupubs.onlinelibrary.wiley.com/doi/abs/10.1029/2020EA001127
Posted by: Antdoghalo Feb 8 2021, 12:19 AM
Made a 32K version of my previous Titan map. The sand dunes and individual valleys are easily visible
https://www.flickr.com/photos/60012030@N02/albums/72157717516744806


Now if only the USGS would release a HISAR map with the last 2 years of swaths that would be great.
Posted by: titanicrivers Mar 31 2021, 05:05 PM
Thanks for your great ISS-SAR composite Titan map Antdoghalo! It has been a while since I viewed the Titan blog and I am humbled by the advancement made in Titan mapping!
Posted by: kymani76 Jul 7 2023, 07:07 PM
As I realized an update from USGS won't be arriving anytime soon, I proceeded to create my own version of SAR map for flybys 108, 113, 120, 121 from BIDRs.
It was a steep learning curve working with this dataset at the beginning, with some details of the process still eluding me, but in the end all the pieces fell into their right places
and a little more of the Titan's surface got revealed. Here is a result, down-sampled to fit in here. VIMS map is at the bottom, overlayed by transparent USGS SAR map to T104 and finally
T108-121 coverage on top in B&W.
Powered by Invision Power Board (http://www.invisionboard.com)
© Invision Power Services (http://www.invisionpower.com)


