Printable Version of Topic
Click here to view this topic in its original format
Unmanned Spaceflight.com _ Cassini's ongoing mission and raw images _ Rev 61 Enceladus (March 12 2008)
Posted by: Holder of the Two Leashes Mar 8 2008, 10:15 PM
The mission description PDF is now online.
http://saturn.jpl.nasa.gov/multimedia/products/pdfs/20080312_enceladus_mission_description.pdf
Posted by: scalbers Mar 9 2008, 12:46 AM
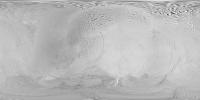
Yes, nice to see the imaging footprint details. The basemap has kind of a familiar look to it ![]()
Should be interesting to see some new areas being imaged at higher resolution than in previous encounters (both northern and southern).
Posted by: Adam Mar 9 2008, 09:49 AM
I'm a bit confused about the what the highest resolution of the images will be. This description claims that the ISS will take images up to meter-scale, but I can swear on that I saw another description somewhere that said that the images taken will at most be 200 meters/pixel. While I guess that's technically meter scale I'd like confirmation on that.
Posted by: jasedm Mar 9 2008, 02:19 PM
Adam, there's a more detailed mission description http://ciclops.org/view.php?id=4806 that details the resolution of the NAC whether it's 'prime' or 'ride-along' throughout the encounter.
Posted by: john_s Mar 11 2008, 01:58 AM
There's now a multi-person http://blogs.nasa.gov/cm/blogsiteviewer?blogname=Enceladus%20Flyby&month=3-2008 about the Enceladus encounter on the Cassini web site. Just three posts so far (including one from me ![]() ), but more will be posted soon.
), but more will be posted soon.
John.
Posted by: Holder of the Two Leashes Mar 11 2008, 04:19 AM
One of you guys on the Cassini team needs to please get ahold of the webmaster for the official Cassini site, and tell them that the date on the simulator (Where is Cassini now?) is out of whack.
Tried sending a discreet email this afternoon, but ...
Posted by: Sunspot Mar 11 2008, 08:52 AM
Although there is a Contact Us/Feedback link on pretty much every NASA page, I've never had any feedback from any message/email i've ever sent.
Posted by: ugordan Mar 11 2008, 09:10 AM
I kind of lost track of when the C/A distance was set to 50 km as opposed to the 38 km figure stated earlier. What were the reasons the altitude was raised?
Great idea on a blog, too. Looking forward to new entries!
Posted by: centsworth_II Mar 11 2008, 02:48 PM
Although this one: Enceladus Approach Maneuver canceled
scared the heck out of me until I realized it referred to a correction
maneuver on the way to the Enceladus encounter.
Posted by: john_s Mar 11 2008, 02:50 PM
Thanks for pointing out the problem with the "Where is Cassini Now?" page- I just sent in a note about it.
The close approach distance on Rev. 61 was raised due to a desire to be a little more cautious about the plume hazard, I believe. We'll review the plume data from this flyby in order to decide whether to maintain the planned 21 km approach distance on Rev. 88.
John.
Posted by: ugordan Mar 11 2008, 02:53 PM
Whoa! 21 km? Talk about threading the needle there...
You've really got to admire the accuracy with which the navigation team's flying a spacecraft some 1.5 billion km away.
Posted by: Greg Hullender Mar 11 2008, 03:29 PM
Technically speaking, we should admire it *after* the flyby. BEFORE the flyby, we can still admire their bravery though. :-)
--Greg
Posted by: ugordan Mar 11 2008, 03:42 PM
Well, in all honesty, they've proven this time and time again. The most recent cancellation of the final targeting maneuver just shows how good a hold of the trajectory they really have.
Posted by: djellison Mar 11 2008, 04:48 PM
Well, I know for a fact that Alice Wessen (head of Cassini outreach) has personally attended to that very task until very recently, and it's now in someone elses hands. If you've got a specific case in point, let me know and I'll pass it on.
Dave 'the navigator' Seal is working on the simulator to get it sorted. There's server shifts and recompiles involved.
Doug
Posted by: ilbasso Mar 11 2008, 06:28 PM
I always pray that they're remembering to aim 21 km above the SURFACE, not from the center!
Posted by: Holder of the Two Leashes Mar 11 2008, 09:18 PM
Simulator is fixed!
Also got back a nice reply from the Cassini Team.
I assumed that it was something easy to fix, and therefore they were simply unaware. Turns out they were really dealing with some issues on it, and several people had emailed them.
Just in time for the flyby, too.
http://saturn.jpl.nasa.gov/operations/present-position.cfm
Posted by: Holder of the Two Leashes Mar 11 2008, 10:41 PM
The first of many ...
http://saturn.jpl.nasa.gov/multimedia/images/raw/raw-images-details.cfm?feiImageID=145894
http://saturn.jpl.nasa.gov/multimedia/images/raw/raw-images-details.cfm?feiImageID=145996
Posted by: ugordan Mar 11 2008, 11:21 PM
I noticed that Cassini's cumulative trajectory plot is now significantly smoother. Looks like they decreased the time tick interval (at periapsis only?) by which they draw the trajectory using linear segments. It looked ugly at periapsis before because that's when the S/C covered the greatest distance per time unit. Also, I don't remember seeing anything else than Titan in the lower right view before. Neat.
Posted by: Holder of the Two Leashes Mar 13 2008, 02:37 AM
According to the official blog on the JPL Cassini Huygens web site, the spacecraft has begun it's data download to the Deep Space Network. The download will take about nine hours.
Posted by: nprev Mar 13 2008, 12:04 PM
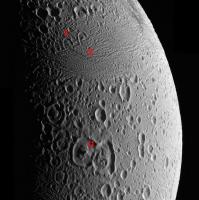
Some flyby raws are up. Check this shot in particular. Those 'central mounds' in the larger craters are most intruiging!
Posted by: remcook Mar 13 2008, 12:21 PM
beauty!
http://saturn.jpl.nasa.gov/multimedia/images/raw/raw-images-details.cfm?feiImageID=146107
Posted by: David Mar 13 2008, 12:36 PM
http://saturn.jpl.nasa.gov/multimedia/images/raw/raw-images-details.cfm?feiImageID=146107
Is all the snow just randomly "hot" pixels?
Posted by: ugordan Mar 13 2008, 12:38 PM
http://saturn.jpl.nasa.gov/multimedia/images/raw/raw-images-details.cfm?feiImageID=146107
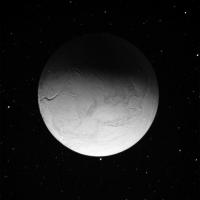
Am I correct in assuming the illumination from the "bottom" is actually saturnshine primarily from the planet's southern nightside which, in turn is softly illuminated by reflected ringshine? See http://www.flickr.com/photos/ugordan/738950883/sizes/o/ for an illustration, only in this case the rings would be nearly perfectly edge-on (not sure how much they contribute to lighting) and the sunlit crescent wouldn't be visible.
Also, the two additional illumination sources on the "top" side of the moon (seen in other, even http://saturn.jpl.nasa.gov/multimedia/images/raw/raw-images-details.cfm?feiImageID=146112 shots) would be two of the neighboring satellites?
David, the majority of those dots (actually short streaks) are stars.
Posted by: volcanopele Mar 13 2008, 01:57 PM
The illumination from "below" is Saturn-shine (possibly ring shine...). The illuminator to the right is Tethys with some light from Dione (both are pretty much in the same direction). The illuminator to the lower left is Rhea.
Posted by: um3k Mar 13 2008, 02:29 PM
Here's a mosaic (click for full size):
http://um3k.justinphillips.googlepages.com/2008_03_12_Enceladus_Flyby.jpg
Posted by: ugordan Mar 13 2008, 02:46 PM
This would have to be a sort of ring-saturn-shine if that's what you meant, doubly reflected and dim light off of the cloud tops. Enceladus is in such a low inclination orbit, 0.019 deg (compared to Mimas' 1.51 deg) that the main rings are effectively invisible. I wonder how much light the broader F ring would diffuse and if it would be comparable in brightness to the light flux from the night side?
Posted by: ustrax Mar 13 2008, 02:58 PM
http://spaceurope.blogspot.com/2008/03/cassini-enceladus-flyby-120308-update.html ![]()
Posted by: jasedm Mar 13 2008, 03:20 PM
Nice work um3k, I was waiting to see which of the resident image wizards would come up trumps first on this north pole mosaic ![]()
Posted by: djellison Mar 13 2008, 03:28 PM
End of : http://youtube.com/watch?v=7P2NMem2llQ
Doug
Posted by: elakdawalla Mar 13 2008, 03:44 PM
The JPL website must be getting hammered...I'm having a hard time getting in to the raw images. Wish I could grab them and set up a mirror somehow...
--Emily
Posted by: ugordan Mar 13 2008, 03:46 PM
The flyby blog appears to be down as well...
Posted by: brellis Mar 13 2008, 03:57 PM
--Emily
I've decided to keep away from the NASA site, and just wait until somebody smart from UMSF has had a look at them.
Posted by: Stu Mar 13 2008, 03:57 PM
I haven't been able to get a look at the raws since I came home from work, 3 hours ago... ![]()
Still, shouldn't complain, I guess; it's a sign that this fly-by has got a LOT of people out there intetrested in space exploration. We can't have it both ways!
Thanks to everyone who's posted images here. I'd have seen NOTHING otherwise! ![]()
Posted by: Stu Mar 13 2008, 04:10 PM
Some quick "Hmmmm...."s... looking at um3k's excellent image...
1. What happened to the rest of these craters?
2. Ooh look, a "chevron" like on Miranda...!
3. Weird... re-frozen cryo-volcanoes..?
Posted by: Bjorn Jonsson Mar 13 2008, 04:16 PM
I've seen only a single image so far. It's extremely slow with frequent errors. UMSF is extremely slow today as well (even slower than yesterday). I'm not sure I'll be able to post this message without errors ;-).
Posted by: stevesliva Mar 13 2008, 04:38 PM
I find the TryAgain firefox plugin helps when sites are getting bombed:
https://addons.mozilla.org/en-US/firefox/addon/2462
Of course, that means I'm exacerbating the issue more than my share. But I'm selfish.
Posted by: marsbug Mar 13 2008, 04:40 PM
The crater to the upper left of the two marked seems to have something similar. It'll be interesting to see how many craters have this effect, and if its in anyway related to size.The image that pops into my head is a large impact producing a temporary lake of liquid water underneath it, which powers cryovolcanism.
Posted by: ugordan Mar 13 2008, 04:45 PM
If I'm not mistaken, those two craters were apparent back in the Voyager imagery and led to various explanations like viscous relaxation of ice which (unlike other icy sats) seemed to be warmer and thus less rigid. Very few, if any of the craters on Enceladus have your typical crater-bowl-look seen on other worlds.
Posted by: Juramike Mar 13 2008, 04:46 PM
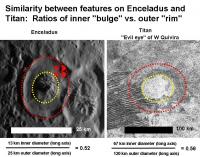
Or it punches through to a liquid layer and the open throat is the source for upwelling.
Just like the Evil eye of W Quivira or Coats Facula on Titan?
I can't wait to measure the ratio of inner diameter vs. rim diameter. It looks pretty similar.
-Mike
Posted by: mgrodzki Mar 13 2008, 05:53 PM
wow… everything is real tied up. i guess nobody here has anything else from other sources?
Posted by: mgrodzki Mar 13 2008, 05:55 PM
anyone find out if these dots are all “hot pixels” or otherwise?
Posted by: elakdawalla Mar 13 2008, 05:57 PM
Gordan is right. Those distinctive Enceladan craters with up-domed floors, where the domes are heavily fractured, are very easy to explain through the process of "viscous relaxation," where the crater looked normal (bowl shaped or whatever) when it formed, but over time, and with help from heat conducting from the interior, gravity causes the ice in the crater to flow (in the solid state -- no volcanism or anything required here) to equalize the gravitational potential. Short-wavelength features take longer to relax because the strength of the ice comes in to play, so you get the most deformation acting on the longest wavelength, which is the up-down-up of the crater rim-floor-rim. As the floor domes upward, there are extensional stresses along the top of the dome, so it fractures. This is basically the same kind of stress regime that is being proposed to explain the "spider" feature in the center of Caloris as seen by MESSENGER on Mercury.
I looked around for some papers on viscous relaxation on Enceladus and this is what I came up with that's in the public domain.
http://www.lpi.usra.edu/meetings/icysat2007/pdf/6051.pdf
http://www.lpi.usra.edu/meetings/lpsc2007/pdf/2237.pdf
Mgrodzki, as ugordan pointed out http://www.unmannedspaceflight.com/index.php?s=&showtopic=5010&view=findpost&p=110761, those are stars. It's a long exposure becuase of the eclipse.
--Emily
Posted by: mgrodzki Mar 13 2008, 06:02 PM
ah… i just saw emily’s post. its super-exposed from rings shine, saturn shine… etc. so those could very well be stars picked up by the sensitive exposure.
Posted by: Juramike Mar 13 2008, 06:14 PM
I took um3k's image (Stu's annotation added) and zoomed in on "3":
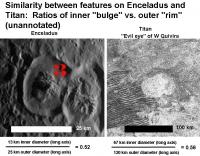
Side by side comparison with the T25 RADAR image of the "Evil eye" W Quivira feature on Titan (annotated and unannotated versions). The ratio of inner bulge and outer rim diameter are real close, even though "Evil eye" feature on Titan is ca. 5x bigger.
The central domes look larger and a little bit rougher ("bulgier?") than normal. Topography would help illuminate this (that's a stretch for a "shape from shading" pun). Maybe these are central dome craters where the rebound just didn't know when to stop?
-Mike
[EDIT: Just saw Emily's post. Fracturing would make the central domes look rougher. Might also explain the Evil eye of Titan if it is indeed a fractured-up central dome crater.]
Posted by: elakdawalla Mar 13 2008, 07:44 PM
Since these places have names, we might as well be using them. Stu's "3" is Aladdin. The adjacent, more angular-outlined one is Ali Baba. Here's the Voyager view:
--Emily
Posted by: Stu Mar 13 2008, 08:19 PM
Still can't get on the raw images site... has anyone ever known a lock-out like this before? I can't remember having this much trouble getting at the Iapetus close fly-by images... ![]()
MAybe we just have to wait for every space enthusiast in the US with a computer to go to bed! ![]()
Posted by: elakdawalla Mar 13 2008, 08:25 PM
It's unusual. I've exchanged emails with folks at JPL and they are working on the problem. They say that although it seems as though it's traffic-related, they've tested with much higher demand and not had problems, so it's a bit of a stumper.
FWIW, I do get pages to appear as long as I wait long enough.
--Emily
Posted by: Astro0 Mar 13 2008, 11:57 PM
A short animated version of the Enceladus approach from the raw images.
Enjoy
Astro0
Posted by: volcanopele Mar 14 2008, 01:10 AM
Post-encounter press release
http://saturn.jpl.nasa.gov/news/press-release-details.cfm?newsID=824
Three-image mosaic
http://ciclops.org/view.php?id=4865
Posted by: mgrodzki Mar 14 2008, 03:01 AM
I thought some of the rough images would make a cool animation… especially (oddly enough) because of the motion blurry frames.
check it out: http://wanderingspace.net/?p=727
Posted by: mgrodzki Mar 14 2008, 03:03 AM
actually… i should just upload it here. will animated gifs work here?
Posted by: Astro0 Mar 14 2008, 03:40 AM
mgrodzki, I think you need to run that backwards, I'm pretty sure this is the south polar departure view.
Cool website BTW. ![]()
Astro0
Posted by: mgrodzki Mar 14 2008, 04:10 AM
Cool website BTW.
Astro0
argh! 50-50 wrong everytime!
Posted by: mgrodzki Mar 14 2008, 04:21 AM
Cool website BTW.
weird. i revised, but in edit mode only one image embed is there yet 2 show up? anyway... the top one if corrected now.
Posted by: Spin0 Mar 14 2008, 07:25 AM
Hi all,
New member here - fist post :)
I made some colour composites of Cassini's raw images. You can see a hint of blue inside some the northern craters. It becomes more obvious when the image is oversaturated in a imageviewing/manipulation program.
Enceladus' north pole seen from ~91000 km.
http://img228.imageshack.us/my.php?image=col1cs0.png
Filters IR3, GRN, UV3 mapped to R, G and B.
Distance about 91000 km.
Raw-images: N00103753 - 55
The north pole closer - from about 65000 km.
http://img87.imageshack.us/my.php?image=col2og0.png
Filters IR3, GRN, UV3, CL mapped to R, G, B and luminosity.
Distance about 65000 km.
Raw-images: N00103763 - 66
South pole area and some tiger stripes seen from about 130000 km.
http://img225.imageshack.us/my.php?image=col4ql6.png
Filters IR3, GRN, UV3, CL -> RGB+lum.
Distance about 130000 km
Raw-images: N00103775 - 78
I also compiled a flyby-video using the raw images, it's in Youtube: http://www.youtube.com/watch?v=l5PqLPU2VA4
Yay, first post!
Spin0
Posted by: jasedm Mar 14 2008, 09:11 AM
Thanks for those spin0, and welcome.
It's useful to see the colour composites as they show the fresher ice more clearly in various features.
I liked your Iapetus flyby composite on youtube too - shows very well the frenetic activity of the cameras during that relatively slow flyby.
Posted by: dilo Mar 14 2008, 03:29 PM
Welcome, spin0!
Great color images (I tried to make something similar with UV+Clean+IR of South Pole view, but your results are better!).
I suspect that blue/green features are actually SHADOWs of the plume, based on their position respect to tiger stripes fractures.
Any opinion on this?
PS: mgrodzki, your animations are stunning, bravo!
Posted by: ugordan Mar 14 2008, 03:51 PM
Any opinion on this?
I have to disagree. It's the coarse ice within the fractures that has a different spectra (notably it's dark in the IR3 deep infrared filter, not particularly so in the IR1 filter) making them blue-green. The plumes are far too dilute to produce any shadowing, in fact they pretty much only scatter light, not block it. Notice there are blue-green fractures to the left as well, far from the pole where the outgassing happens.
BTW, nice work on color registration, Spin0! I think it's funny how the raw contrast stretch algorithm makes it appear Enceladus was illuminated with the usual "white" light from the Sun when in fact the light coming through was pretty yellow/brownish, depending on how much of the illumination is directly due to reflected ringshine. In particular, both the rings and Saturn are dark in the UV3 filter indicating the exposure required was long. And yet, no obvious blur can be seen in the narrow angle. Amazing.
Posted by: JRehling Mar 14 2008, 06:00 PM
I like the departure/arrival movies! Reminds me of a Fritz Lang movie. German Expressionism meets space exploration.
Posted by: Sunspot Mar 14 2008, 06:09 PM
Hmm I knew the CDA glitch would be focus of any post flyby news coverage. ![]()
http://space.newscientist.com/article/dn13467-cassini-probe-failed-to-taste-moons-geysers-in-flyby.html
Posted by: centsworth_II Mar 14 2008, 06:37 PM
"Cassini probe failed to 'taste' moon's geysers in flyby"
Sometimes I am disappointed in New Scientist's sensationalist headlines.
I guess they deserve to be http://www.unmannedspaceflight.com/index.php?s=&showtopic=3728&view=findpost&p=110745
Posted by: vexgizmo Mar 14 2008, 07:40 PM
And Slashdot has a similar wrong-headed take on this, based on the New Scientist article.
http://science.slashdot.org/science/08/03/14/1535236.shtml
Can someone with a Slashdot account go set them straight?
Posted by: volcanopele Mar 14 2008, 07:48 PM
One of the CICLOPS folks did in the last comment. I'll probably respond to him.
Posted by: mgrodzki Mar 14 2008, 09:17 PM
totally. i did one with ted stryk’s mariner images to mars a while back too. same weird nickelodeon old tyme effect on space travel. i did “add” a few things to make it smooth. noted on my blog what those items were. essentially 3 frames added to a 10 frame animation.
Posted by: scalbers Mar 15 2008, 05:04 PM
These are fun images to work on with my map, particularly the north polar ones. First though I see I'll want to retool some of the limb fitting routines to work better with triaxial ellipsoids in this type of polar view.
Posted by: tallbear Mar 15 2008, 06:04 PM
CIRS should have the real PRIZE data from this flyby ....
mapping of the S Polar region while Enceladus was in eclipse ( no sunlight
to compete with the heat from the vents... )
Should be really interesting ..... but it's going to take them awhile
to get the reconstructed pointing info ....
T
Posted by: Bill Harris Mar 15 2008, 07:04 PM
This flyby produced a real gem of science by "imaging" the vents with the CIRS when the room lights were off (eclipse). And the south polar region being illuminated by faint "saturn light" gives a secondary verification of the topography of the vents imaged.
I'd call the flyby planning brilliant.
--Bill
Posted by: Spin0 Mar 15 2008, 08:18 PM
Thank you all for the kind words of the images and the video I posted - and yes, it does bring Fritz Lang and Murnau to my mind too! :)
During the flyby Cassini took about ten color images of Enceladus (10? 11?). I composited nine of them using the raw images. Some of the following images I already posted earlier, these are new a little bit better versions done with some more care, I even bothered to erase most of the cosmic rays.
In all images filters IR3, GRN, UV3, CL -> RGB+luminance
Approach.
http://img232.imageshack.us/my.php?image=ser1qf5.png Dist.612000km, raw images:N00103726-29 http://img232.imageshack.us/my.php?image=ser2vw8.png Dist.316000km, raw images:N00103730-33
http://img223.imageshack.us/my.php?image=ser3ao0.png Dist.307000km, raw images:N00103734-37 http://img223.imageshack.us/my.php?image=ser4rl4.png Dist.225000km, raw images:N00103738-41
North pole.
http://img223.imageshack.us/my.php?image=ser5yi8.png Dist.91000km, raw images:N00103752-55 http://img223.imageshack.us/my.php?image=ser6lj3.png Upper and lower parts B&W. Dist.65000km, raw images:N00103763-66
Outbound. In these images reflected lights give a different tint on each side of the moon.
BTW: there's a bright blue-green spot near south pole. What is it? A mountain?
http://img223.imageshack.us/my.php?image=ser7lb1.png Dist.131000km, raw images:N00103775-78 http://img223.imageshack.us/my.php?image=ser8hc5.png Dist.144000km, raw images:N00103779-82
http://img223.imageshack.us/my.php?image=ser9lr6.png Dist.213000km, raw images:N00103793-96
Posted by: jasedm Mar 17 2008, 07:33 PM
--Bill
I agree wholeheartedly - talk about maximising opportunities!
Many plaudits to those involved in the flyby design.
Posted by: tedstryk Mar 19 2008, 07:13 PM
Here is the complete Voyager view (Emily's post contained one frame of a mosaic).
Ted
Posted by: belleraphon1 Mar 21 2008, 01:44 AM
All... NASA To Release New Details from Close Flyby of Saturn Moon
http://www.spaceref.com/news/viewpr.html?pid=25007
Wednesday the 26th press conference at 2:00pm EDT. On NASA TV http://www.nasa.gov/ntv
Craig
Posted by: Floyd Mar 21 2008, 03:05 PM
Did anyone catch the http://www.jpl.nasa.gov/events/lectures/mar08.cfmwebcast last night? Did Dr. Hendrix give hints of what will be in the press conference?
-Floyd
Posted by: scalbers Mar 25 2008, 06:09 PM
Here's a first cut with some Rev 61 images now in the map (both northern and southern hemisphere).
The full resolution version is here:
http://laps.noaa.gov/albers/sos/sos.html#ENCELADUS
Enjoy,
Steve
Posted by: jasedm Mar 25 2008, 08:39 PM
Thank you Steve - still the Web's best source for mapping information of this kind.
Posted by: Juramike Mar 26 2008, 06:49 PM
News release of the Enceladus flyby. The plume is slightly warmer than expected and has organics!
Whoo-hoo!
Anyone have the list of the organics detected and the relative amounts?
http://saturn.jpl.nasa.gov/news/press-release-details.cfm?newsID=827
-Mike
[EDIT: This would be the most expensive sparkling water ever tasted - and worth every penny!]
Posted by: Stu Mar 26 2008, 06:53 PM
Anyone else here for the media briefing? Bring popcorn? ![]()
Posted by: ugordan Mar 26 2008, 06:55 PM
I hate to break it to you, Stu, but it's already over ![]()
Posted by: Stu Mar 26 2008, 06:56 PM
Ah, got my times mixed up. Never mind. I'll look forward to reading up the results.
Posted by: Juramike Mar 26 2008, 06:57 PM
The Tiger Stripes were found to be hot along most of their entire length. ("Hot" meaning ca. 100 K above the surface temperature)
NASA image release: http://photojournal.jpl.nasa.gov/catalog/PIA10361
And Chris McKay weighs in on the possibility of life on Enceladus: http://saturn.jpl.nasa.gov/news/features/feature20080326.cfm
(Spoiler alert: might coulda happened)
-Mike
Posted by: stewjack Mar 26 2008, 07:10 PM
Anyone have the list of types of organics and their relative amounts?
-Mike
I saw about five minutes of what must have been a very short news conference. No audience questions. The only thing I remember was that all particles were very small which will allow the next Cassini pass through the plume to be at a lower altitude.
Jack
Posted by: ynyralmaen Mar 26 2008, 07:19 PM
Yeah - one hour less time difference between the US and Europe for a few weeks, until we're on summer time too.
Anyone know if the conference will be posted online? I missed most of it - didn't realize there was a separate media channel until it was too late ;can't see any repeats listed.
Posted by: elakdawalla Mar 26 2008, 07:40 PM
![]() I hate that whole media channel thing. Stupid NASA. I missed most of the press conference myself, but fortunately I was able to catch up with John Spencer and Hunter Waite by phone, so I've got good stuff for an article later today -- stay tuned. Carolina Martinez told me that she was working on getting the press conference (maybe audio only, I am not sure) posted on the Enceladus flyby blog later today for the benefit of everyone who missed it. So check there and post here when it shows up!
I hate that whole media channel thing. Stupid NASA. I missed most of the press conference myself, but fortunately I was able to catch up with John Spencer and Hunter Waite by phone, so I've got good stuff for an article later today -- stay tuned. Carolina Martinez told me that she was working on getting the press conference (maybe audio only, I am not sure) posted on the Enceladus flyby blog later today for the benefit of everyone who missed it. So check there and post here when it shows up!
I think the biggest news is that, compositionally, Enceladus looks like a comet, which is totally, completely baffling.
--Emily
Posted by: Juramike Mar 26 2008, 07:51 PM
CICLOPS article on Enceladus' plume: http://ciclops.org
Composition of plumes compared to comets: http://photojournal.jpl.nasa.gov/catalog/PIA10357
And the INMS spectrum showing simple and "complex" organics (their definition of "complex" is very different than mine - we're not talking teterodotoxin here): http://photojournal.jpl.nasa.gov/catalog/PIA10356
(Dalton = amu; benzene is about m.w. 78)
From CICLOPS cpcomments:
"Also, it is now unambiguous that the jets emerging from the south polar
fractures contain organic materials heavier than simple methane --
acetylene, hydrogen cyanide, formaldehyde, propane, etc."
-Mike
Posted by: rlorenz Mar 26 2008, 08:02 PM
"Also, it is now unambiguous that the jets emerging from the south polar
fractures contain organic materials heavier than simple methane --
acetylene, hydrogen cyanide, formaldehyde, propane, etc."
-Mike
As sparkling water goes, I am not sure I'd like the taste of this....
Ciclops' unsurprising gushing (!) notwithstanding, there are a few people
(e.g. Veronique Vuitton at the Titan Chemistry workshop here in Miami
http://www.chem.hawaii.edu/Bil301/Titan2007.html )
noting that some attention should be paid to possible chemistry on the
surfaces of the INMS instrument itself (e.g. during Titan flybys, benzene or
Phenyl (C6H5), cant remember which, peaks AFTER closest approach). In
other words could these 'Enceladus' organics be reaction products of
Enceladus water with Titan gunk on the inside of the instrument?
I personally doubt it, but wanted to note that 'unambiguous' is a
pretty heavy duty word for what may be a rather complex situation.
I guess I won't complain too much if a Titan Flagship does a little bit
of Enceladus science on the way, though. Looks not entirely uninteresting....
Posted by: JRehling Mar 26 2008, 08:09 PM
Enceladus water with Titan gunk on the inside of the instrument?
Panspermia in action. "Attack of the Saturn Beasties" sure to follow.
"Hey, you got your smog in my geyser."
Posted by: Juramike Mar 26 2008, 08:16 PM
Or: "Who Plugged the Probe?"
Posted by: ectoterrestrial Mar 26 2008, 08:42 PM
Missed the NTV briefing.
Looking at the following graph with mystery vertical axes:
http://photojournal.jpl.nasa.gov/jpeg/PIA10356.jpg
I'm wondering if there's some nitrogen hiding in there. The lack of a large NO2 peak could be diagnostic of it's overall absence, but theres plenty of curve under which N2 and NO could be hiding, as well as some in the "simple" and "complex" organics.
Also, NH3 and fragments thereof at 17 AMU.
Does anyone know why 1) little nitrogen is inferred from the data or 2) when a published paper with these results will be available?
Posted by: DFortes Mar 26 2008, 08:43 PM
Can I please caution peeps about the 'comet' comment
Which comet? Compositionally, comets appear to be extremely heterogeneous.
Secondly, observational planetary science should always avoid any labels that carry some kind of genetic connotation (since they're invariably wrong). So, if it barks like a comet, it's a comet?
Oh, metaphor god, strike me down.
For example, you can call a bunch of squiggles a dendritic pattern, but not a channel network (since it implies formation by fluid flow, whereas dendritic is purely descriptive) - unless you're pretty sure it's a channel network.
There are other ways to make heavier organics.
I'm loving these new data - the CIRS stuff is beautiful. I'd like to know how the shear heating bods feel about these results....
Posted by: jasedm Mar 26 2008, 08:55 PM
Very interesting that the sulci hot spots are very noticeably parallel - why might this be???
Posted by: Juramike Mar 26 2008, 09:20 PM
"Simple" organics = 1C + heteroatom [N or O] or 2C + associated hydrogens
"Complex" organics = 2C + heteroatom [N or O] or 3C + associated hydrogens
Propane m.w. 44
Ethanol ("moonshine" ![]() ) CH3CH2OH m.w. 46
) CH3CH2OH m.w. 46
Note that methanethiol (CH3SH) is a whopping 48 amu and was not detected by INMS
(but acetonitrile CH3CN (m.w. 41) , could be a "complex" organics consituent)
-Mike
Posted by: jasedm Mar 26 2008, 09:24 PM
I'm ashamed in the presence of you chemists.
Posted by: Juramike Mar 26 2008, 09:28 PM
space.com article on Enceladus is out: http://www.space.com/scienceastronomy/080326-cassini-flyby-update.html
-Mike
Posted by: volcanopele Mar 26 2008, 10:59 PM
For those who missed the press briefing:
http://www.jpl.nasa.gov/news/cassini20080326.cfm
Posted by: Juramike Mar 26 2008, 11:55 PM
Emily's article regarding today's briefing on Enceladus: http://planetary.org/news/2008/0326_Cassini_Finds_Enceladus_Tastes_Like_a.html
Nicely written, Emily!
-Mike
Posted by: nprev Mar 27 2008, 01:14 AM
You got that right, Mike. Superb work, Emily, written in such a way that even a humble artificial intelligence such as myself can understand it all! ![]()
The cometary compositional similarity is interesting. Almost begs the question of whether something unexpected (heating) happened to them rather then something funny about Enceladus. I can't see any possibility of Enceladus being a captured body.
Posted by: Holder of the Two Leashes Mar 27 2008, 04:08 AM
I would dearly love to see some 10m resolution (or better!) NAC photos of the hottest areas of those tiger stripes, along with the WAC context shots. I know they plan some high resolution views in the next flyby, but I haven't yet read just how high the resolution will be. Hope their plans for the next flyby work. The 15 year night cometh soon.
Posted by: CosmicRocker Mar 27 2008, 07:05 AM
Can one of you astrobiololgy or icy body chemical types comment? I read the headlines noting the discovery of "complex organics," but the published spectrograph displays the heaviest broad peak centering around 40 Daltons. I wouldn't normally describe molecules of this weight range as "complex."
Are molecules heavier than the C2/CN/CO range typically considered complex by space scientists?
I noted that Emily's blog entry stated that "At higher masses, not shown on the graph above, "we saw more complex compounds, like propyne, propane, maybe even acetonitrile, and then we saw things even more complex. But they were so weak in signal that we didn't venture an identification." Propane and propyne should have appeared on that graph, since its X-axis goes up to 50 Daltons. Was that data simply erased from the publically released spectrograph?
Posted by: JRehling Mar 27 2008, 07:24 AM
Yeah, is what we're seeing between comets and Enceladus anything but ices + one-time heating to drive a little chemistry? It doesn't look to me any more remarkable than the fact that SiO2 exists in the rocks of Earth, Moon, and Mars or that N2 exists in the atmospheres of Venus, Earth, and Mars. You put the same elements together, and you usually get the same compounds.
Posted by: DFortes Mar 27 2008, 12:04 PM
Exactly - thankyou.
My view is that the 'comet' label - whether it was meant to or not - connotes some suggestion that the organics are primordial. However, the heat flux and plume activity strongly suggest active chemical synthesis (a la Matson), which (to my feeble mind) is more astrobiologically interesting.
Posted by: nprev Mar 27 2008, 01:04 PM
My thoughts exactly. I strongly suspect that the emission areas are very localized, extremely narrow, and MUCH warmer than their immediate surroundings, which are presumably experiencing secondary heating... the actual vents have temps certainly exceeding 273 deg K.
Posted by: ugordan Mar 27 2008, 01:23 PM
Ummm... I'm sorry, I don't understand that. How much is that in Fahrenheits? That's obviously the only allowed scale, given yesterday's news conference...
On a more serious note, a question for John Spencer: Is the new highest temperature the average over the sensor footprint, or was it extrapolated to the actual width of the tiger stripes (so the average temperature is actually lower than stated in the press release)?
Posted by: ElkGroveDan Mar 27 2008, 02:50 PM
One of the fun things about Google is that you can convert anything to anything else. Type in 273K in F. and it will come back 31.7. If you are using the Google browser tool bar you don't even have to hit enter. The drop-down suggestion will give you the answer without leaving the page you are on.
Its amazing how many odd units they take into account. Try 40 furlongs in nautical miles. 10 Hands in decimeters. 50,000 milliseconds in fortnights. Warning: you could waste a lot of time on this.
Posted by: Juramike Mar 27 2008, 03:00 PM
Its amazing how many odd units they take into account. Try 40 furlongs in nautical miles. 10 Hands in decimeters. 50,000 milliseconds in fortnights. Warning: you could waste a lot of time on this.
My favorite is that Google Earth can measure distances in http://en.wikipedia.org/wiki/Smoot.
The irony that Oliver Smoot was head of American National Standards Institute (ANSI) and the president of of the International Organization for Standardization (ISO) is beautiful.
[/off-topic witicism]
Posted by: ugordan Mar 27 2008, 03:02 PM
I was being sarcastic up there, but I'm glad - this Google tip is awesome! That's much faster than googling for "fahrenheit to celsius converter" or such.
Thanks, EGD!
Posted by: djellison Mar 27 2008, 03:16 PM
100 (meters per hour) = 515 090.655 smoots per year
55 mph = 242 hands per second
(500 million miles) per (6 months) = 167 316.677 feet per second
240 000 (square feet) = 7 698.81934 sq smoots
This is important stuff!!
Posted by: ElkGroveDan Mar 27 2008, 03:30 PM
With April 1st coming up, perhaps one of you academic types might dust off an old paper and re-submit it somewhere with the units all converted to things like hands, smoots, furlongs and fortnights.
Posted by: edstrick Mar 27 2008, 03:52 PM
"... Is the new highest temperature the average over the sensor footprint,... "
A surface that's an efficient emitter (near blackbody, like ice) that is all one temperature, puts out a blackbody spectrum. When you convert infrared brightnesses to estimated temperature, the estimates are the same at all wavelengths.
When you have an unresolved checkerboard mosaic surface with two temperatures, one cold and one warm, you get an average of two blackbody spectra and the result is NOT a blackbody spectrum of the average temperature. The warm surface emits more at shorter wavelengths and the cold surface emits more at longer wavelengths. You can model a checkerboard pattern to get the temperatures of the two components AND the proportions of the components. But there's slop in the modeling. Youi usually have more than two temperatures and varying fractions at the surface with temperature and there's just not enough data in the spectrum to tell you what's really going on.
At Enceladus, you probably have regional "cold" temperatures, possibly a generally "slightly warmed" surface between tiger stripes, "warm" surfaces matching the blue areas (in color pics) of the stripes, "hot" areas that are very close to the vents and "very hot" areas within the vents themselves.
If you do 2 component modeling with the better resolution of the new data, you can get the inter-stripe temperatures and in those regions model the mix of cold and slightly warmed surface, then over at the tiger stripes, model "slightly warmed" beside the stripes and "warm+hot" temperatures and coverage fractions on the stripes. If "hot" is different enough from "warm" and is abundant enought in the hottest appearing areas, you may be able to get a better overall fit to the data with 3 components and be able to report a "hot" temperature and estimated surface fraction.
Right now, they're probably NOT reporting that. In 2 or multi-component circumstances, just looking at the raw data, short wavelengths give warmer readings than long wavelengths. They're probably simply reporting the pixel-average temperature in the hottest pixel measured at the shortest wavelength where they have useful signal-to-noise. We can assume if that's correct, the 180 K reading is a lower limit to the real temperature of the hottest areas in the field of view.
Posted by: elakdawalla Mar 27 2008, 04:04 PM
Are molecules heavier than the C2/CN/CO range typically considered complex by space scientists?
I noted that Emily's blog entry stated that "At higher masses, not shown on the graph above, "we saw more complex compounds, like propyne, propane, maybe even acetonitrile, and then we saw things even more complex. But they were so weak in signal that we didn't venture an identification." Propane and propyne should have appeared on that graph, since its X-axis goes up to 50 Daltons. Was that data simply erased from the publically released spectrograph?
I get the idea that any time you have more than one carbon in a molecule, space scientists call it "a complex organic molecule."
That language about higher masses was a bit of sloppiness on my part. The quote is correct but obviously some of the compounds he mentioned would have shown up on the graph; I should have split the quote a bit differently to make that clearer (just didn't have time yesterday). I don't believe the graph was altered in any way; I assume you don't see propane and propyne specifically called out on it because the abundances would be so small as to be unnoticeable, and because the actual amounts are probably rather uncertain.
--Emily
Posted by: ugordan Mar 27 2008, 04:09 PM
... which is exactly the kind of thing I wanted to know.
On a related note, John Spencer's http://blogs.nasa.gov/cm/blog/Enceladus%20Flyby/posts/post_1206557428631.html says the stripes were detectable even in the 7 micron wavelength range. That's pretty close to the 5 micron max VIMS can observe. I realize that's stretching it a bit too far, but would it be even remotely possible for VIMS to see the stripe thermal glow (as it can in case of Jupiter and Saturn, for example)?
I wonder if the VIMS S/N ratio is too low for this combination of instrument sensitivity and the wavelength a tad too short (likewise, temperature too low), or would it be feasible? I don't suppose VIMS was active during the outbound leg of the flyby, during the eclipse?
Posted by: john_s Mar 27 2008, 06:33 PM
Nope, we fit the spectrum over all available wavelengths, with a single component filling a small fraction (typically about 1%) of each pixel. The rest of each pixel is too cold to radiate significantly in our short-wavelength detector. Pixel-averaged temperatures are much colder.
John.
Posted by: edstrick Mar 28 2008, 07:59 AM
"Nope, we fit the spectrum over all available wavelengths, with a single component filling a small fraction (typically about 1%) of each pixel. The rest of each pixel is too cold to radiate significantly in our short-wavelength detector. Pixel-averaged temperatures are much colder."
Modelling gets done faster these days. It sounds like this is close to a 2 component system.. cold background, radiating mostly at long wavelengths, and a tiny fraction of the surface at high temps. Is there any sign of an intermediate component.... say "hot but not really hot and actively emitting plume" general tigerstripe component, or would the estimated 1% pixel fraction include the entire "valley" part of the stripe within the pixel?
VIMS might be able to see the glow if there's a hottest component at or above that 180 K temp AND if it has high enough signal-to-noise AND if there's no sunlight. The sun's not very bright 5 microns, but on the shortwave flank of a blackbody spectrum, brightness drops FAST as your wavelength decreases and any solar interference would likely swamp any signal.
Posted by: rlorenz Mar 28 2008, 03:49 PM
And I think the press encourage that - they don't want to know the details or distinctions
anyway. After all, chemistry, like math, is hard......
There is also the issue of not actually knowing what the stuff is - as you get to higher masses
there are more and more molecules that have that mass (to within the mass resolution of
INMS, anyway) so it becomes ambiguous. If you have enough signal (e.g. with Benzene
at Titan) you can start using the cracking pattern to make identifications, but with the low
signal at Enceladus I expect that is pretty challenging.
Posted by: Stu Mar 28 2008, 05:08 PM
Probably a dumb go-stand-in-a-corner question, but it's been nagging at me so I'll go ahead and ask it anyway...
Enceladus must have got in the way of quite a few Saturn-bound comets over the millennia, just by being in the wrong place at the wrong time, right? Is it possible that some of this "cometary chemistry" might be contamination of a kind? Traces of cometary material that found its way into the Tiger Stripes only to be spat back out again..?
That would have been a heck of a shot, wouldn't it? A comet crumps down near the south pole, splashing slush in all directions.. some slips and slithers down into the fractures... some of the slush contains cometary critters who can't believe their luck after finding themselves in a great place to live, all wet and warm and cosy...
Discuss. ![]()
Posted by: nprev Mar 28 2008, 05:46 PM
Interesting thought, Stu. You know that over the past 4.5By more then a few comets had to hit Enceladus, regardless of how small a target it is and given its proximity to Saturn (thinking of gravitational focusing here).
"Small" in fact might actually be the key point for Enceladus: could a significant amount of its original mass have been displaced into the E-ring and beyond by comet impacts over time? Framed in this way, it might be surprising if its non-core composition wasn't approximately cometary by now, though given that thought that might set some pretty severe limiting constraints on the moon's intrinsic chemical processes...
Damn. Now I gotta go drive 56,740 smoots in horrible traffic to perform Reserve duty instead of digging this thread. (I have taken an oath to express all personal terrestrial positional displacements from now on in smoots. Velocity will be expressed in furlongs per fortnight, which is not an unreasonable unit for LA traffic...)
Posted by: ElkGroveDan Mar 28 2008, 07:06 PM
This time of day in Los Angeles you'll probably be driving no faster than 200 furlongs per hour, meaning it's going to take 0.0119047619 fortnights to get there. So you better get going.
Posted by: JRehling Mar 28 2008, 09:53 PM
It may well be that Enceladus has a significant amount of cometstuff in it, but I think the basic explanation is that ices and volatiles make up a fair amount of the solid stuff at sufficient solar distances. Enceladus should be highly differentiated, at least where the plumes are, so this all seems more automatic to me than a surprise. I mean, it's not like there was going to be copper, silver, and gold sitting on top of slush and water.
I think there's a pervasive, tempting, and misleading tendency to think of accretion as having happened like a phase, having ended on some specific day and date, and then everything after that was A Collision (capital letters). There really should have been stuff in solar orbits slicing through the Saturn system constantly, with some mass exchanging in both directions. This would have happened from the very beginning, and only became less common gradually. So was Enceladus "hit by a comet"? Sure, quite a bit, I'm sure. How could it not?
I would only expect comets and Enceladus's lighter stuff to be different if comets formed out at some point where something was frozen, but that would melt at Enceladus's distance. I don't think there's a whole lot of matter that fits that category -- Enceladus is cold. Comets don't have a lot of frozen molecular hydrogen. What else would they conceivably have that Enceladus wouldn't?
The one thing we learn is that chemistry happened in comets and in Enceladus. Since the same reactions happen with the same compounds and the same elements, it's a rather minor surprise, I'd say. About all we learned is that stuff from a rocky core isn't coming out along with the wet stuff.
Posted by: Phil Stooke Mar 29 2008, 07:11 PM
"With April 1st coming up, perhaps one of you academic types might dust off an old paper and re-submit it somewhere with the units all converted to things like hands, smoots, furlongs and fortnights. "
I might be able to spare two shakes of a lamb's tail for that.
Phil
Posted by: aconnell Apr 3 2008, 11:31 PM
Hello everyone. This is my first post so I hope I'm not starting with a dumb question - are there more images to be released from this flyby? Congratulations to all involved with this site. Just awe inspiring. Al.
Posted by: john_s Apr 4 2008, 01:21 AM
Welcome to UMSF! To answer your question, all images from the flyby have been released on the Cassini Raw image site: go to http://saturn.jpl.nasa.gov/multimedia/images/raw/index.cfm and search for Enceladus. There weren't many close-up images because Enceladus was in Saturn's shadow after the flyby. Nice mosaics and color versions of most of the best images have been either released on the official Cassini site (just the approach crescent mosaic) or right here. There will be lots more images on the next flyby, on August 11th this year.
John.
Posted by: aconnell Apr 4 2008, 02:01 AM
Many thanks for the warm welcome and info John. My insomnia is currently being fuelled by thoughts of what the August flyby will reveal and the Pluto Kodak moment !!!!!!!Al.
Posted by: brellis Apr 4 2008, 04:11 AM
JReihling - thank you for your Post #116. You describe succinctly and in easily understandable terms a very complex process.
Regarding your mention of a common urge to explain a planetary condition through the prism of "A Collision": it would seem that the rings of Saturn itself, and - if they're really there - http://news.nationalgeographic.com/news/2008/03/080306-moon-rings.html, are in fact the result of one or more big collisions that left a swirl of debris. As you point out, it's unlikely that the comet-like content of Enceladus is the direct result of one or a few big collisions. Could it be an indirect result? Perhaps.
A question for the experts: do moons or planets at LaGrange points tend to tidy up a dusty ring, or are they more likely to keep a ring of tiny bits in place?
To rephrase, do the shepherd moons of Saturn have a specific L-point relationship that lets the rings survive, whereas the large moons of Jupiter have/had an L-point relationship that caused them to clear out the dusty rings?
Powered by Invision Power Board (http://www.invisionboard.com)
© Invision Power Services (http://www.invisionpower.com)

