Printable Version of Topic
Click here to view this topic in its original format
Unmanned Spaceflight.com _ Tech, General and Imagery _ Some Statistics for Spirit & Oppy
Posted by: climber Jan 4 2007, 12:36 AM
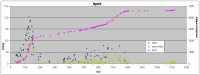
Some statistics as on Dec 31st 2006
Total Pictures : 170.026
Total Sols : 2110 (11.7 times more than scheduled)
Pics/Sol/Rover : 81
Total distance : 16.684 meters (13.9 times more than scheduled)
meter/Sol/Rover : 7.9
Cost/sol (Assuming 800 millions USD) : 379.147 USD
Post/UMSFers/Sol/Rover : 
Posted by: dvandorn Jan 4 2007, 04:39 AM
Interesting... the MERs are about 200 sols from individually equaling the time the Viking 2 lander remained operational, and the total number of sols for both rovers is about 200 sols short of the time the Viking 1 lander was operational.
In about 700 sols or so, if the rovers last that long, they will have equaled the total operational time of both Viking landers.
Pretty durned impressive for solar-powered wheeled vehicles... 
-the other Doug
Posted by: djellison Jan 4 2007, 08:40 AM
After all the extensions - it's more like $900m I think.
Doug
Posted by: climber Mar 11 2007, 07:36 PM

Doug
OK Doug! So, assuming $900m, on March 15th, the price per sol will be exactly $400.000 as total sol will get to 2250.
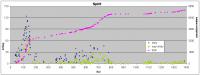
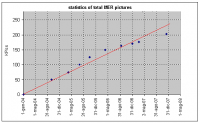
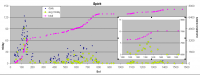
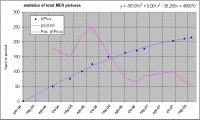
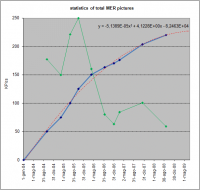
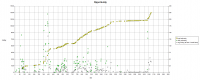
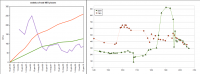
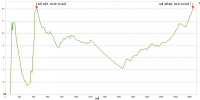
Here are other stats about how long it took to take 25k pictures from the begining of the mission. I miss the date of the first 25k's and assumed it was linear. If somebody know the date, I'll appreciate.
Also number of pictures per sol were we can see summer-winter variations.
It's an excel file :
 Stat_rovers_march_07.xls ( 17K )
: 1623
Stat_rovers_march_07.xls ( 17K )
: 1623Posted by: dilo Mar 11 2007, 11:28 PM
Thanks for the update on image statistics, Climber (about Excel file, pls could you better explain the meaning of the plots? what do we see on horizontal axis?).
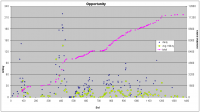
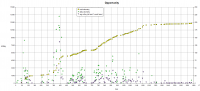
Now is time to update also my odometry statistics (same scale):
|

|
Posted by: climber Jun 15 2007, 12:18 PM
Getting close to yet more milestones!
If my excel file is working as it should work, I calculated that, tomorrow, june 16th we'll have accumulated 2500 Earth days on Mars while 2500 Sols will be on July 20th which could be more or less when Spirit will have shot 100.000 pictures.
On june 18th, the difference of minutes between Earth and Mars since Spirit landing will be 50.000 (nearly 35 days).
More?
OK : since end of May, the total cumulated distance is over 18 kms, i.e. 30 times what has been scheduled.
Posted by: djellison Jun 15 2007, 12:23 PM
Not that far from their second Martian Birthday either.
Doug
Posted by: climber Jun 15 2007, 12:33 PM
Yep, not that far!
September 29th for Spirit and October 9th for Oppy
Regarding the difference between sols and days :we have a 10 Million $ positive difference if we calculate the cost (per sol or day) in Earth days... which seams fair to me since, if we use "external references" it could be VERY expensive to land on Venus and very cheap on Jupiter!
Posted by: stevesliva Jun 15 2007, 03:18 PM
If only we could get humans to Mars for only $400,000 per day! What a bargain, especially in light of a weeklong trip to LEO costing the tourists $20,000,000.
Posted by: dilo Dec 12 2007, 09:59 AM
Spirit just reached Sol1400, which is the limit for my last odometry plot, so enjoy this last update with old scale...
|
|
I guess Spirit figure will not change very much in the last months
 . Hope about Oppy restart, which is full of energy!
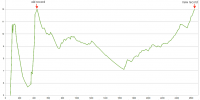
Another update for the number of pictures sent back from both rovers, the average was exactly 100 pics/day in the last 9 months (higher than previous year):
|
Posted by: Tom Tamlyn Dec 12 2007, 01:02 PM
"[T]he number that most haunted me and Pete ... was the one you got if you took the cost of the mission and divided it by the number of sols we expected to operate on the surface. It came to about $4 million a sol. ... Whatever we built, and whatever we managed to do with it, the result was going to have to be worth at least that much."
Steve Squyres, Roving Mars, p. 103.
TTT
Posted by: ElkGroveDan Dec 12 2007, 03:30 PM
In truth the operating costs have climbed as well. As I recall the $900 million was as of launch time including normal mission support. To get a true figure we need to add up the costs of all the mission extensions and also the DSN time, if that is not part of those extended mission costs.
Posted by: djellison Dec 12 2007, 03:55 PM
$850m was that figure - I just added the $50m as an estimate of the extensions to make $900m
Doug
Posted by: ElkGroveDan Dec 12 2007, 04:07 PM
Well however we slice it, they've been a great bargain.
Posted by: PhilCo126 Jan 4 2008, 09:06 PM
Talking about MER statistics, anyone know where to find a high resolution version of this MER 1000 sols logo?
Posted by: climber Jan 30 2008, 08:53 AM
Some statistics as on jan 31st 2008
Total Pictures : 207.000
Total Sols : 2880 (16 times more than scheduled)
Pics/Sol/Rover : 72
Total distance : 19200 m (~12 Miles) (16 times more than scheduled)
meter/Sol/Rover : 6.6
Cost/sol (Assuming 900 millions USD) : 315.000 USD
Oppy's now over 100.000 pictures
Just think of this : 72 pictures/Sol/Rover represent 2 old roll films per sol/rover
I can't imagine the size of the container (not talking about processing) the rovers would have to have carryied if Digital camera would'nt exit yet ! 
Posted by: dilo Jun 5 2008, 07:12 AM
Another update for our poor old friends on Mars...
|

|
|
I added an inset odometry plot in order to show the tiny progress in last year!
About pictures, due to energy problems the contribution from Spirit is very small (only 18 pics/sol in last 2 months!).
Posted by: climber Jun 5 2008, 07:27 AM
Thanks Dilo. I like the abrv months in Italian
Let see what happen this month with Euro 2008 (BTW my father was born in Piacenza anyway)
Posted by: dilo Jun 5 2008, 09:13 PM
Merci, climber... are you referring to UEFA Championship??? If so, I'm not very expert of soccer, sorry!
Posted by: dilo Sep 21 2008, 03:32 PM
No major odometry changes, for the moments... so I report only updated pics plot:
|
Incidentally, the cumulative pic quote resemble very much to a parabola, stalling one year from now... let's hope that Spirit awakening and, especially, new Oppy journey to EC will change this trend!

Posted by: climber Oct 3 2008, 11:02 AM
Here is the updated .xls file I use to follow Rovers progress.
I've got some reliable infos regarding restricted sols so, I added a column for Oppy to show where they'll be. Please don't take this for granted since it depends on when the downlinks happens and it'll have to be ajusted as we go. Anyway, it should work at least for the coming month or so.
Rovers_follow_up.xls ( 556.5K )
: 1625
Enjoy
Posted by: dilo Oct 3 2008, 03:27 PM
Thanks Climber, interesting file.
I would like to integrate these data with my datasheet.
In the meantime, this is my updated odometry for Opportunity  ... I hope to see a strong increase of such statistics in next week!
|
Posted by: climber Oct 13 2008, 10:53 AM
Oppy get full lead now:
+ Oppy overtook Spirit for total distance on March 19 th 2006 : 6836m vs 6807m
+ Oppy overtook Spirit for total number of pictures on October 8 th 2008 : 110864 vs 110840
Edited: for a 900M$ basis, cost per second will drop down 3$ on december 2nd.
I guess we're actually over 900M$. Doug, any better estimate for, say, 31 december 2008?
Posted by: alan Oct 13 2008, 01:09 PM
Conjunction is coming up on December 6. How long will the communications be disrupted around this date.
Posted by: climber Oct 13 2008, 01:45 PM
Last one last 2 weeks total but I'll say it depends on the actual geometry, i.e. how close to the sun Mars will be seen from the Earth. Anyway, I don't expect more than 2 weeks really.
Posted by: PhilCo126 Oct 29 2008, 06:51 PM
Longest single-sol drive distances:
Opportunity:
Sol 410 = 220 meters (722 feet)
Sol 362 = 157 meters (512 feet)
Sol 1663 = 153 meters (500 feet)
Spirit:
Sol 125 = 124 meters (409 feet)
Posted by: djellison Oct 29 2008, 07:31 PM
There are several drives between your first and second place distances there.
Posted by: dilo Oct 29 2008, 08:45 PM
In chronological order (only above 100m):
Sol daily odometry
70 100
82 141
362 157
383 177
384 104
385 109
408 190
410 220
412 183
413 175
414 183
423 109
433 151
1663 153
1666 129
Happy to see again such big distances!
Posted by: centsworth_II Oct 29 2008, 09:01 PM
Happy to see again such big distances!
Aren't there five 100m plus drives since sol 1666?
Posted by: PhilCo126 Nov 2 2008, 05:15 PM
Opportunity:
Sol 410 = 220 meters
Sol 1690 = 216 meters
Posted by: dilo Nov 25 2008, 10:07 PM
Time to update Oppy Odometry:
|
This trend is very encouraging, with weekly average steadly above 25 meters.
Posted by: djellison Nov 25 2008, 10:22 PM
What would their Martian third birthday's be?
Posted by: climber Nov 25 2008, 10:45 PM
On dec 2nd, assuming total mission costs at 900M*, cost per second will be exactly = 3$
Just about that time, total pictures will be very close to 225.000 (source JPL MER web site), giving a cost per picture of 4000$ (again at 900M*)
Note that, removing sundial pics out of the count will increase considerably the cost per "regular" pictures
*: that was your estimation Doug, one year ago, so it's probably "a bit" more. So, if not on dec 2nd, those stats will be moved a few days, roughly... up to their birthday.
Posted by: djellison Nov 25 2008, 10:52 PM
My $900m is, I think, slightly high. Scott mentioned something like $890 or there abouts in his awesome Mars 3.0 talk at Gnomedex
Posted by: jamescanvin Nov 26 2008, 09:08 AM
Plugging Spirit's landing day into the http://www.exploratorium.edu/ronh/age/index.html gives 24/08/2009 as her third birthday on Mars.
Posted by: briv1016 Dec 11 2008, 06:40 AM
Does anyone have an exact date for when the MER combined mission duration becomes greater then the Viking combined mission duration? My rough calculations put it at Dec 29; but maybe some with more precise numbers can get a more exact date.
Posted by: RoverDriver Dec 11 2008, 08:12 PM
From wikipedia I have:
Vk1 lasted 2245 Sols
Vk2 lasted 1281 Sols
That is a total of 3526 Sols. On Sun Dec 28, 2008 MER-A will be at Sol 1773 and MER-B will be on Sol 1753.
Paolo
Posted by: briv1016 Dec 30 2008, 08:59 PM
Vk1 lasted 2245 Sols
Vk2 lasted 1281 Sols
That is a total of 3526 Sols. On Sun Dec 28, 2008 MER-A will be at Sol 1773 and MER-B will be on Sol 1753.
Paolo
A bit of a belated announcement but Spirit and Opportunity have not surpassed Viking 1 and 2 in combined mission duration.
Posted by: climber Jan 27 2009, 10:47 PM
Reading Scott Maxwell "deary", I realise that he was assuming a cost of 4M$ a day. He didn't know it was 250.000$ a day actualy.
I hope to update this amount in the future and be as wrong as Scott was
Posted by: climber Feb 11 2009, 05:13 PM
Vk2 lasted 1281 Sols
That is a total of 3526 Sols. On Sun Dec 28, 2008 MER-A will be at Sol 1773 and MER-B will be on Sol 1753.
Paolo
Please correct me if I'm wrong:
Sojourner lasted 92 Sols (?)
Phoenix lasted 151 Sols (?)
Adding this to the Vikings = 3769 Sols
Spirit + Oppy will, hopefully, surpass ALL other landers added sols on May 3rd of this year... and individually by late August 2014

Posted by: RoverDriver Feb 11 2009, 08:16 PM
Sojourner lasted 92 Sols (?)
Phoenix lasted 151 Sols (?)
Adding this to the Vikings = 3769 Sols
Spirit + Oppy will, hopefully, surpass ALL other landers added sols on May 3rd of this year... and individually by late August 2014
Hopefully my math is correct. Assuming both rovers will survive until May MER will surpass the combined sols of all landers/rovers (except MER) on May 2, 2009. Assuming only MERB survives next winter, MERB sol 2245 is May 18 2010.
Paolo
Posted by: lyford Feb 11 2009, 08:45 PM
Surpassing all missions including MER would really be an accomplishment!
Posted by: climber Mar 12 2009, 01:56 AM
Checking the rovers mileage, I can tell that Oppy is ~250m short of having roved twice as much as Spirit.
Another 3-4 drive.
Posted by: Deimos Mar 12 2009, 03:09 AM
Vk1 lasted 2245 Sols
Vk2 lasted 1281 Sols
Sojourner lasted 92 Sols (?)
Phoenix lasted 151 Sols (?)
Wikipedia knows all. But ...
VL1 was successfully commanded (to do the wrong thing) on sol 2252. It landed on sol 0, so that's 2253 sols of operations. The place that messed up the sols also messed up the Earth date (11/19, 1982, not 11/13). VL2 lasted 1316.1 days, or 1280.9 sols, so I'd buy 1281 (even though it was probably 1 more, with the 0.9 divided between partial first and last sols). [JPL Pub 82-107]
Pathfinder was under ground command for 83 sols (1-83), and experienced the undervoltage trying to wake up for sol 84. Some level of communication followed, but ground command was not reasserted and the science mission had ended.
Umm, Sojourner lasted 83 sols, too, and was lost when its communications subsystem (ie, MPF) failed. Speculation about what happened on/after sol 92 is just speculation.
Phoenix successfully finished sols 0 through 151 inclusive: 152 sols. (Again, signals without command authority followed.)
So, 3769 combined sols without Sojourner, 3852 with. So with 2 MERs, I get 2009 June 14 around 1900 UTC for a DTE or nominal beep from Opportunity or about 5 hours later for a UHF pass (to exceed all other landers/rovers). Actually, I get May 3 without Sojourner, with other errors canceling.
Posted by: climber Apr 2 2009, 07:58 PM
From TPS monthly report:"We have some commands that have minimum and maximum time ranges in them and the maximum range was January 1, 2010, she informed. Obviously, we're coming up on that, so R9.3 extends the maximum range, to noon on January 1, 2020. If we are still going after that,we'll need to do another software patch." The new, R9.3 software has been working just fine on both rovers, she added."
This will be Sol 5679 for Spirit
Posted by: ElkGroveDan Apr 2 2009, 09:54 PM
Not when Ted Stryk has been around.
Posted by: dilo Apr 3 2009, 05:35 PM
This will be Sol 5679 for Spirit Or about 50 Km odometry for Opportunity (extrapolating first 5 years average)!
Posted by: dilo Jun 2 2009, 08:43 AM
Time for a general update!
|
|
EDIT: someone highlighted wrong axis in the first plot, now I corrected title and added second axis for daily odometry.
Posted by: Burmese Jun 4 2009, 02:59 PM
Oh, go ahead and connect the dots on that second one...want to better visualize that power spike by Spirit!
Posted by: climber Jun 19 2009, 10:56 AM
June 24th 2009 doesn't seams to be a special day for Spirit. It is indeed.
It'll be Sol 1946...which will also be (Earth) Day 2000 since landing.
Posted by: dilo Sep 8 2009, 08:30 PM
Update on pictures and Whrs:
|
thanks to recent light "burst", Spirit approached Oppy after surpass almost 1 year ago!)
Posted by: climber Sep 8 2009, 08:52 PM
Thanks Dilo,
I love your date setting in Italian....
Posted by: imipak Sep 9 2009, 06:57 PM
It almost looks like some cosmic joker's sending us a message via Spirit's power curve 
Posted by: ilbasso Sep 9 2009, 08:20 PM
I'm still waiting for someone on UMSF to put together a graph in anaglyph form. I'm surprised we don't see more of that sort of thing.
Posted by: climber Sep 14 2009, 12:00 PM
Other milestones,
Last Oppy drive put the total odometer for both MER above 25 kilometers. (24969 + (~) 70m
Also,
On 09/09/09 (or so ), total number of pictures reached 250.000.
This is ~62 pictures per sol and per Rover or 3600$ per picture... if all costs have ever to be considered for taking pictures only.
Last 25.000 pictures have been shot in 251 sols.
Posted by: briv1016 Sep 14 2009, 07:15 PM
), total number of pictures reached 250.000.Does that include the double counting of M1,2,3 etc versions of the same picture?
Posted by: PDP8E Sep 14 2009, 07:27 PM
of the 250,000 images:
...109,689 were of the sun dial
...132,275 were of the sun
Posted by: fredk Sep 14 2009, 07:53 PM
That's a surprize. That only leaves about 10 000 images not of the sun or sundial! And a lot of those must be navcam odometry frames - I wonder how many?
Posted by: djellison Sep 14 2009, 08:06 PM
I think PDP8E was being sarcastic.
Posted by: PDP8E Sep 15 2009, 02:07 AM
hey doug,
guilty... 
Posted by: fredk Sep 15 2009, 04:25 AM
Thanks for clarifying that, PDP! It would be interesting though to know how many frames have been sundial/sun/odometry. I could imagine writing a script that jumps through the jpl jpeg pages and counts them up. (Not downloading each image, of course.) Odometry would be easy - just add up the navcam subframes downsampled frames (match "EDN" in filename). Sun/sundial could be done by matching on the img width and height attributes...
Posted by: climber Sep 15 2009, 09:42 AM
We all know that odometry means weels turn and not real kilometers and that the sun dials can't be stealed by the Martians without been seen since they are shot so many times . Well, I didn't ear that the MER sun pictures are used by Soho's team either.
Anyway I like the milestone 25 kilometres, 250.000 pictures, 4000 sols, 6 martian years coming along nearly altogether at the same time.
Posted by: fredk Sep 15 2009, 03:32 PM
The more I think about it the more useful it would be to do a thorough count of images. One other use would be to find all the images that appear on exploratorium but not on the jpl gallery pages. Has anyone else noticed that there are images missing from the jpl pages? For example, these images are not on the jpl pages:
http://qt.exploratorium.edu/mars/opportunity/navcam/2009-08-09/1N302275829EFFA5ARP1979R0M1.JPG
http://qt.exploratorium.edu/mars/opportunity/pancam/2009-08-11/1P303245951EFFA5B8P2544L7M1.JPG
http://qt.exploratorium.edu/mars/spirit/forward_hazcam/2009-08-09/2F303035468EFFB1E5P1110L0M1.JPG
http://qt.exploratorium.edu/mars/spirit/pancam/2009-08-09/2P303034007ESFB1E5P2550L7M1.JPG
(these are from sols 1961 and 1972 (Oppy) and 1990 (Spirit)).
These were all released on August 9th and 11th on exploratorium, but never made it to the jpl gallery, obviously because of some glitch (August 10th images are missing too). But it would be good to have a list of all such missing gallery images, even though the images are public at exploratorium. The jpl gallery is a great, easy way to look for old images from some particular sol.
Posted by: Deimos Sep 15 2009, 04:48 PM
I figured I'd check the stats myself. This is based on images downlinked, excluding multiple versions, and doesn't rely on the image browsing sites, but I cannot vouch for absolute completeness. I also am ignoring thumbnails and looking only at the EFF, ESF, and EDN types. I see a total of 120,604 Spirit images, 124,728 Opportunity images, for 245k images. That adds up to 261 Gbits (2.5% of which is from thumbnails and engineering/calibration data) as downlinked. Image number by camera (A/B) is: Pancam 78,929/80,972; MI 5,824/5,996; engineering--the rest. Among Pancam, 8,806/13,298 are of the Sun or sky; 16,482/15,739 are of the cal targets (aka sundial). Those two categories add up to <4% of total Pancam bits downlinked. The rovers have taken over 300,000 images (147,166/160,573); the difference between these numbers and the first set comes from images taken but deleted on board (e.g., some empty dust devil movies) or taken only in thumbnail form (or maybe some missed in my count?). By type, Pancam images are mostly EFF or ESF (like Sun and sundial), MI are almost all EFF, and engineering images are mostly EFF or EDN (like autonav).
* The numbers are as of mid-day (UTC) 15 Sept. 2009 (probably sols 2026/2006 PM downlink).
[edit: fixed Mbits to Gbits. What's 3 orders of magnitude among friends...]
Posted by: PDP8E Sep 15 2009, 04:54 PM
Hey Deimos,
I was finishing up my lunch and doodling how to approach an Exploratorium count with a perl and shell script when your posting came across the wires! Thanks for the independent numbers. You rock!
Posted by: fredk Sep 15 2009, 06:29 PM
Agreed, very cool to have those numbers, thanks Deimos. Roughly a third of all pancam frames are sun/sky/sundial. (Should the total volume be perhaps Gbits rather than Mbits?)
Posted by: briv1016 Nov 10 2009, 08:11 AM
With this latest week of drives, the combined driving distance of Spirit and Opportunity is now 26.62 km which beats the Apollo 16 rover driving distance of 26.55 km.
Just for reference:
Vehical / Distance
Lunokhod 2 / 37.00 km
Apollo 17 rover / 35.89 km
Apollo 15 rover / 27.76 km
Apollo 16 rover / 26.55 km
Opportunity (2056) / 18.89 km
Lunokhod 1 / 10.50 km
Spirit (2076) / 7.73 km
Sojourner / ?
Posted by: climber Nov 10 2009, 10:53 AM
Interesting figures indeed.
We've now (last status nov 5th) roved 6209m since Victoria which added nearly 50% more odometry since there (started at 12678m).
Posted by: PhilCo126 Nov 10 2009, 12:19 PM
I believe that Sojourner (the little rover that could...) drove a total distance of about 110 meters... longest drive during one sol was about 7 meters? How far am I off  ?
?
Posted by: Hungry4info Nov 10 2009, 01:06 PM
The total distance will never be known. After Pathfinder died, contact between Sojourner and Pathfinder ceased. Sojourner was programmed such that if this ever happened (like if Sojourner wandered behind a rock or something), to circle Pathfinder, trying to establish contact. This would continue until either Sojourner re-established contact, or died.
Pathfinder died, so contact was probably never re-established. Sojourner spent the rest of its days, unattended to by anyone or anything, circling its lifeless companion, trying desperately to contact it. All in vain.
Posted by: djellison Nov 10 2009, 01:37 PM
Actually - we can be fairly confident about how far Sojourner got after pathfinder died, as there's a fairly convincing identification via HiRISE of Sojourners location. We had an entire thread here about it- a pool of where we thought Sojourner would be
Posted by: Hungry4info Nov 10 2009, 02:43 PM
Sojourner has been found? I thought its location remained unknown =o. Apparently I didn't keep up with it.
And how did you resolve the issue of not knowing how many times Sojourner circled Pathfinder?
Posted by: djellison Nov 10 2009, 02:45 PM
It's fairly clear from the location that it drove from its last know position, in a straight line partially back towards the lander, and stopped.
In a perfect world - it would have circled the lander. But the pathfinder landing site was far from a perfect world.
post 70+ in this thread - http://www.unmannedspaceflight.com/index.php?showtopic=3587&hl=sojourner%20hirise&st=60
Posted by: climber Nov 24 2009, 03:43 PM
On november 20th total Sols was 4160.
If one devides 900M$ by 4160x84600 (Number of second per Earth day), he'll find that costs of 1 rover second hit 2.5$.
Nominal mission was above 52$
Posted by: Deimos Nov 24 2009, 04:44 PM
Keep in mind that the whole 'Bambi circling its dead mother' imagery was always more poetic than predictive. The code said to return to the lander; the result of certain keep-outs was that circling would occur on perfect terrain. But where Sojourner was on sol 83, Ender was on the most likely first direction. That is significant because Ender & Wedge almost ended Sojourner's travels much earlier, with a rover driver threatening to turn off all safety checks and command enough wheel turns to grind the rock to dust if that's what it took to move again. That terrain, the best entrance to the Rock Garden, was nearly non-navigable. An unattended rover with fault protections (tilt, etc) on had zero chance of passage. (My guess in '97 was right against Ender--wouldn't have won the pool, but close.)
Note that Sojourner got stuck somewhere around 6x nominal mission. The response to both Opportunity and Spirit being stuck has been much more cautious, despite being even further "past warranty". I think the real explanation is a somewhat different culture (despite a similar cast & crew); equally, though, it is clear that the MERs each had more future potential from continued roving, compared to Sojourner with the Rock Garden abandoned.
Also, I have 7 m (sol) and 104 m (mission--before the last couple m) for Sojourner.
Posted by: nprev Nov 25 2009, 02:17 AM
That's an interesting perspective, Deimos. Would you say this culture change is a result of increased experience (and confidence) with Mars rover operations in general, or increased maturation of the players , or perhaps a liitle of both?
All teasing aside, though, Sojourner was a secondary vehicle with admittedly far less capability then the MERs so its premature loss would not have been the end of the Pathfinder mission, just a degradation. This would probably foster a tendency to take greater risks with it if the potential rewards seemed at all achievable.
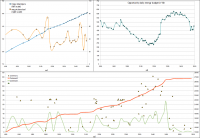
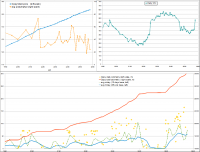
Posted by: dilo Jan 4 2010, 05:47 PM
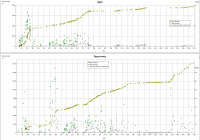
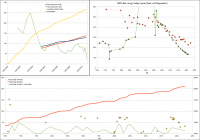
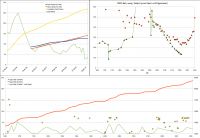
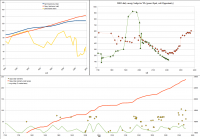
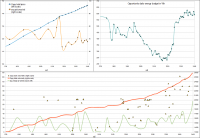
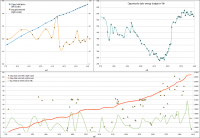
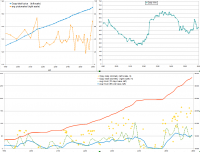
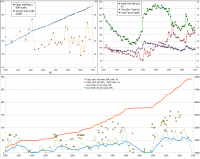
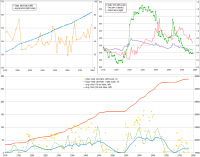
Update on pictures and Whrs, in occasion of 6th anniversary:
|
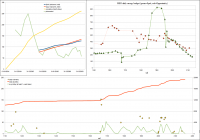
As usual, on the left plot green curve shows cumulative pictures (Spirit only) and red is total (both rovers). Blue dotted is average pics/day from both.
Right plot shows energy in whr/sol, decay slope for Spirit is really worring...
Posted by: climber Jan 29 2010, 12:12 PM
Spirit is less than one mission duration away from breaking Viking 2 duration of 2245 sols
Fingers crossed.
Posted by: Tesheiner Jan 29 2010, 12:43 PM
Fingers crossed?!?
Nah! 90 days will be a piece of cake!
Posted by: climber Jan 29 2010, 02:08 PM
100% agree. What I was thinking was that if she sleeps at that time and dies before spring come, we'll never know if she made it.
But I'm on the optimistic side too; no doubt she'll make it and rove again.
Posted by: eoincampbell Jan 30 2010, 06:44 AM
I trust the Sun will look after Spirit
Thanks for those intriguing stats Climber...
Posted by: climber Feb 11 2010, 09:32 AM
3 milestones rounded up at the end of January 2010!
Oppy reaches 12 miles
27 km total for the Rovers
Which is 45 times more than scheduled
Also, there are more than 62 days differences between Sols and Days since landing. Except Scott Maxwell , they all must be happy they did synchronise a while ago
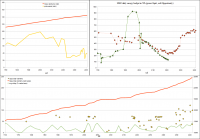
Posted by: dilo Feb 23 2010, 06:55 AM
New update.
|
I'm starting to worry about Spirit power...
Posted by: Stu Feb 23 2010, 07:27 AM
Scott Maxwell Tweeted:
"Below ~140W-hr/sol, we're power-negative & start dipping into batteries. Too many sols at that level & we hibernate. "
Hang in there, gal...
Posted by: nprev Feb 23 2010, 07:46 AM
Hoo boy. Deus ex Machina!!!
Posted by: Stu Feb 23 2010, 07:51 AM
"Don't bet against Spirit"... <---- good advice, she's a tough one.
Posted by: dilo Mar 24 2010, 07:24 AM
Here we go (139Whr on sol 2203):
|
Posted by: Astro0 Mar 24 2010, 08:47 AM
@marsroverdriver mentioned that as IIRC, Spirit is down to 133whr as of March 22 (~ sol2210)
Hang in there girl!
Posted by: Reed Mar 24 2010, 11:00 PM
This was mentioned in the spirit thread, but probably worth mentioning here. 140Whr is http://twitter.com/marsroverdriver/status/10737408465:
Posted by: jamescanvin Mar 25 2010, 08:16 PM
VL1 was successfully commanded (to do the wrong thing) on sol 2252. It landed on sol 0, so that's 2253 sols of operations. The place that messed up the sols also messed up the Earth date (11/19, 1982, not 11/13).
Mark,
Sorry for replying to such an old post, but as Spirit and Opportunity are now closing in on the VL-1 record I have been trying to understand exactly what the record is.
While VL-1 was, as you say, given the faulty commands on sol 2252, as far as I can tell there was no response to that command and of course no subsequent response at all. At the time communications sessions were only being done approximately weekly, so as far as I can tell the last time that anything was actually heard from VL-1 was the previous DSN session back on sol 2245 (the date that most sources give for EOM)
I guess the question is: Is the end-of-mission, the day we broke it, or the day we last heard from it?
James
Posted by: vikingmars Mar 26 2010, 02:44 PM
I was just back in France but contacted the following day after we received no downlink from VL1... It's really sol 2245. We all agreed on this Sol date at JPL as the most relevant for the end of mission date : i.e. the last transmission received from VL1 (with latest images and meteorological data from Sol 2238)
http://www.unmannedspaceflight.com/index.php?s=&showtopic=6442&view=findpost&p=156850
Posted by: climber Mar 26 2010, 09:21 PM
If I understand Eduardo's Oppy's route map, on Sol 2188, Oppy reached the most western point of her whole journey... since she'll rove east from now on.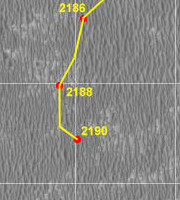
Posted by: fredk Mar 26 2010, 09:48 PM
Until, that is, she's done with Endeavour and Iazu, and then heads back west to Bopolu and then farther into Miyamoto...

Posted by: climber Mar 26 2010, 09:57 PM
As a coincidence, half a mission ago, on ~sol 1100 she was on her most Eastern point so far, and yes, she's supposed to challenge this very soon.
What about showing your BLACK MAN at Miyamoto for scale, fredk?
Posted by: climber Apr 19 2010, 01:24 PM
I checked out the JPL Rover website on the pictures section: for the first time since landing, Oppy shows more Sols than Spirit: 2209 vs 2208
Posted by: dilo May 8 2010, 03:02 PM
Update:
|
Posted by: climber May 10 2010, 11:05 AM
Sorry I missed this one 2 weeks ago.
On sol 2218, April 21st 2010, Oppy from Victoria surpassed Total Spirit mileage.
On previous drive Total distance was 20385m (source Mer website) and since Oppy left Victoria at 12678m, the traverse was 7707m.
Total for Spirit is 7730m and Oppy sol 2218 was over 60m (source Eduardo's map).
This gives a pretty nice prespective of what has already been accomplished during the traverse.
Posted by: NW71 May 10 2010, 10:36 PM
I guess this really does give an insight into how you break down a daunting task into small, manageable chunks. 19km in an ageing rover appears impossible - but by taking it day by day the impossible can now be seen in the camera lens, growing larger with every driving sol. By my rough calculations (and please correct me if I'm wrong, Fredk, Eduardo, Stu etc) although she has covered more ground than Spirit since leaving Victoria, Oppy has still only (only!) covered about 7,300 metres, as at sol 2226, of the 19km route to Endeavour crater (that is about 38.4% of the journey - I wish they would still show that bar on the maps!)
This just gives one pause for thought on the magnitude of this trek doesn't it? Every day that Oppy drives, whether it be 10 mtrs or 100 just keeps eating away at the task.
I'd be interested to know how others visualise this distance. Personally, I do it in two ways. Firstly, I think where I could be if I drove from my house as far as Oppy has travelled? - In my case this would take me into the neighbouring county! Secondly, re the trip to Endeavour, I see the 11,700 mtrs as just over 29 laps of a full size running track still to go.
As ever - Go Oppy!
Neil
Posted by: Poolio May 11 2010, 04:24 AM
I think that these numbers aren't quite right. The 12678m figure quoted by climber probably comes from this http://marsrovers.nasa.gov/mission/status_opportunityAll_2008.html#sol1681, but that number corresponds to the odometry at the end of sol 1687. That's several long drives into the journey, which began on sol 1683. The same update notes that Opportunity was already 314 meters along at that point, bringing the total odometry to 8021m as of sol 2218.
Personally I still like to think of the journey as having http://marsrovers.nasa.gov/mission/status_opportunityAll_2008.html#sol1655. My "records" (I use that term loosely) indicate that that would add another 565 meters. Estimating the last three drives at 75 meters combined, said "records" look like this as of today (sol 2238), stage by stage:
STAGE DISTANCE START END TOTAL ODOMETRY
Start Duck Bay 11,797.84 meters
Stage 0 565.11 m Duck Bay Cape Agulhas 12,362.95 meters
Stage 1 1254.38 m Cape Agulhas Santorini 13,617.33 meters
Stage 2 1434.11 m Santorini Resolution 15,051.44 meters
Stage 3 857.49 m Resolution Kasos 15,908.93 meters
Stage 4 803.53 m Kasos Absecon 16,712.46 meters
Stage 5 516.17 m Absecon Block Island 17,229.16 meters
Stage 6 1698.40 m Block Island Marquette 18,927.56 meters
Stage 7 505.28 m Marquette Concepción 19,432.84 meters
Stage 8 1238.53 m Concepción 20,671.37 meters
TOTAL 8873.53 m
Posted by: NW71 May 11 2010, 10:13 AM
Thanks Poolio - I'm more than happy to be corrected!
If we take Duck Bay as the starting point as you suggest, are we still looking at a total journey of 19km or do we have an update on that figure as well?
Neil
Posted by: Poolio May 11 2010, 01:23 PM
I really don't know. I believe that the "official" NASA stance is that the trip to Endeavor started at Cape Agulhas, and the last we've seen from the maps is that the trip from there was estimated at 19km. I'm not suggesting that anyone should adopt my practice of counting from Duck Bay, but if you do, just add another 1/2 km.
Perhaps one of the reasons they stopped putting the bar on the maps is that the total distance is a moving target. Every uncrossable dune and "interesting rock" adds to the total, and it's futile to try and calculate the percentage based on a variable number. So I just like to keep an eye on the horizon and watch the scenery go by.
Posted by: fredk May 11 2010, 02:04 PM
I don't think they've stopped. The bars are included in the maps from Ohio State University - here's the latest one:
http://marsrovers.jpl.nasa.gov/mission/tm-opportunity/opportunity-sol2199.html
What's changed is that we're now also getting very regular map updates (basically every drive) from Tim Parker. The OSU updates were never nearly as frequent as Parker's.
Posted by: climber May 11 2010, 02:50 PM
What I did myself: I used what I thought was the day we left Victoria = on Oct 18th 2008, Sol 1683, at 12678m (and I can't remember now how I "choose" this date) ... and followed this way. I mean, we could discuss departure date but there is no point doing so.
My post was to put Oppy's traverse as a distance perpective to compared to Spirit's.
Posted by: Poolio May 11 2010, 05:24 PM
Of course. Arguing departure date doesn't get us any closer to Endeavour. The point of your post was well taken, but sometimes I can't help being pedantic. This is a "statistics" thread, after all!
fredk: Thanks for the clarification on the maps. I knew that Tim Parker was driving the recent frequency of map updates, but never understood that the other maps were generated outside of JPL (despite the legend), or that we could still expect to see them from time to time.
Posted by: climber May 11 2010, 08:44 PM
Agree too!... so, I guess this is THE source...
: http://marsrovers.jpl.nasa.gov/mission/status_opportunityAll_2008.html#sol1681
Posted by: briv1016 May 20 2010, 01:43 AM
Now that Opportunity has surpassed Viking 1 in mission duration (longest surface mission) I tried to find some orbital spacecraft for new milestones.
Mission, Orbital Insertion-Mission Ended, Duration, Date Spirit Should Surpass
Galileo, 12/07/1995-09/21/2003, 2846 days, 10/19/2011
MGS, 09/11/1997-11/05/2006, 3343 days, 02/27/2013
PV*, 12/04/1978-10/08/1992, 5058 days, 11/08/2017
*Pioneer Venus
Mars Odyssey and both Voyagers entered operation before MER and hopefully won't be ending for a long, long time.
(All figures are hopefully within a day or two. Feel free to correct me.)
Edit: BTW, Odyssey should be surpassing MGS in "at Mars duration" on December 18th.
Edit Edit: Corrected for VP end of mission date. (Thank you Paolo.)
Posted by: Paolo May 20 2010, 05:22 AM
PV was lost on 8 October 1992 and was still transmitting when it "aerobraked"
Posted by: dilo Jun 9 2010, 05:27 PM
Time for an update...
|
Posted by: Sunspot Jun 9 2010, 06:12 PM
The upturn in energy for Opportunity is the result of minor panel cleaning events rather than coming out of the winter solstice.
Posted by: MoreInput Jun 18 2010, 09:26 PM
hi Dilo!
Is it possible to post the raw data of your diagrams?
Just to play with it and make some stupid statistics on my own.
thanks,
Moreinput
Posted by: dilo Jun 19 2010, 06:24 AM
Sure, this is my updated file in .xls format (original is .ods, but I think is limited in compatibility)- I removed plots-
Posted by: dilo Jul 3 2010, 05:43 PM
My monthly update:
|
Great energy increase in the 2nd half of June!
Posted by: PDP8E Jul 16 2010, 01:41 AM
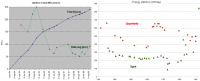
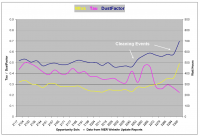
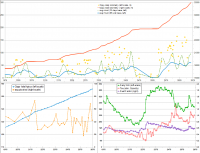
Here is a graph showing the weekly values of Opportunity's Watt Hours, Tau, and Dust Factor (as stated in the weekly Opportunity Updates on the main Mars Rover website) from January 2010 to July 15, 2010.
|
Low tau's are good -- high dust factors are good.
A tau of 4.7 is a 99% blocked atmosphere - we are in a very clear sky period ( t=0.2)
I am assuming a dust factor of 1.0 is how Oppy left the clean-room.
Notice when Tau goes up (sol 2253) and the Dust Factor goes down, the power goes down. And when tau is very low (sol 2300) and the dust has been cleaned off (0.7) the power zooms (for what is available in winter!). The winter solstice was Sol 2260 ( i think?)
For a review of Tau, I refer you to Emily's awesome recap of the (click) http://www.planetary.org/news/2007/0720_The_2007_Martian_Dust_Storm_Crisis_for.html
I haven't found a good description of the dust factor yet(!)
Cheers
Posted by: dilo Jul 16 2010, 09:49 AM
Cool plot, thanks PDP8E!
Posted by: fredk Jul 16 2010, 02:04 PM
I've been hoping someone would do that! Thanks PDP. That shows nicely how we've climbed out of the 50% dust factor level we'd been mired in for so long.
One little request: would you consider showing the individual data points the next time you do a plot?
There's not much to it - it's just the percentage of light that gets through the dust coating the panels. It drops as dust settles onto the arrays (usually slowly), and rises as wind gusts clean the arrays off (can be very suddenly).
Posted by: PDP8E Jul 16 2010, 07:53 PM
Thanks Dilo and FredK
I was wondering if Tau was zero and the dust factor was 100% what are the Whrs differences between Winter solstice and Summer solstice. A nice sine function between those points should give you the maximum possible Whrs on any given Martian day (depending on latitude)
Posted by: fredk Jul 16 2010, 08:54 PM
That's an interesting question. Presumably it wouldn't be precisely a sinusoid, even if the solar arrays were level. In addition to the varying incidence angle, the total hours that the Sun is up vary with time of year. And the incidence angles in morning and late afternoon are low even when the Sun climbs high at local summer. I'm sure someone has done an accurate calculation...
Posted by: jamescanvin Jul 17 2010, 03:14 PM
Some of Helvick's early posts in the old Whrs thread have a max power curve - http://www.unmannedspaceflight.com/index.php?s=&showtopic=2195&view=findpost&p=44840
Remember the days when we thought 400Whrs was needed to do anything, and rover death was at 290?
Posted by: brellis Jul 17 2010, 08:56 PM
For baseball nuts who love stats: Considering the 70m restraint vs. now driving three sols in a row, I wonder what distance record Oppy might set for some period of time like 3 or 5 or 10 or 100 sols.
Posted by: dilo Jul 29 2010, 08:18 AM
I need to slightly anticipate my monthly update because I could have some connection trouble in the next month due to home transfer...
|
Posted by: fredk Jul 29 2010, 02:02 PM
I love that jump in Oppy's power! There's nothing like seeing it in graphical form. Thanks Dilo.
Posted by: climber Aug 12 2010, 08:57 AM
We'll have confirmation in next week update but we already can say that total odometry Spirit + Oppy reached 30km last night. and still
Posted by: MoreInput Aug 29 2010, 06:36 PM
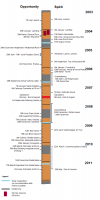
Hello again!
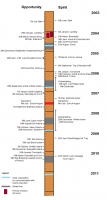
Usually we are looking for the cool new maps of Tesheiner to follow the journey of the rovers.
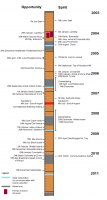
But the journey is also a journey through the time. Attached you find the journey through the times since 2003. I made also made a version for the german Wikipedia. Maybe someone find it interesting when we reached which scientific target. If you see some errors in it, please inform me about it.
Best regards,
MoreInput
|
Posted by: nprev Aug 29 2010, 06:45 PM
Neat! One suggestion & a question:
1. "Last message from Spirit" might be better phrased as "Communications hiatus". I'm sure that we haven't heard the last from her yet.
2. Are the winter periods true calendar-derived Martian winters, or just the periods of reduced MER activity due to the season? They seem kind of short to me on the graphic.
Anyhow, very cool- thanks!
Posted by: MoreInput Aug 29 2010, 07:45 PM
Hi Nprev!
1. I changed the "Last message from Spirit". We just hope the best.
2. I just took the winter solstice and marked a 3 (earth) month interval. More in the way that that was a time of reduced activity. But the activity is also much influenced through the dust on the solar panels. So I just changed that in the new time line. Interesting: Spirit and Opportunity just landed at the end of summer on mars. I didn't realized that yet.
2. Are the winter periods true calendar-derived Martian winters, or just the periods of reduced MER activity due to the season? They seem kind of short to me on the graphic.
I also changed the date of depature from Victoria to the 17th October (Sol 1683)
|
Posted by: elakdawalla Aug 29 2010, 08:39 PM
This is a really cool way of looking at the mission timeline, MoreInput.
Posted by: AndyG Aug 30 2010, 09:58 AM
It might have been late summer, but it still left plenty of time for the 90-sol missions to run.
I have a great love of different ways of seeing data, and have to thank you for this method.
Andy
Posted by: climber Aug 30 2010, 07:06 PM
I like it very much too. Thanks
It's seams incredible to "see" how short the primary mission was.
Posted by: Gsnorgathon Aug 30 2010, 08:10 PM
I'd suggest "Launch" instead of "Start." It's obvious in context, but when I first looked at the timeline I had a brief moment of confusion.
Posted by: Stu Aug 30 2010, 08:44 PM
LOVE that, great for a quick-look reminder of major mission milestones.
Posted by: climber Aug 31 2010, 10:01 AM
Assuming Oppy started the traverse from Victoria to Endeavour at an odometry of 12678m (which I believe is right), she is now short of only 30m for having roved 10 kms since she left.
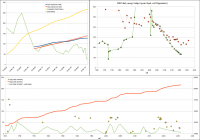
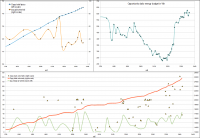
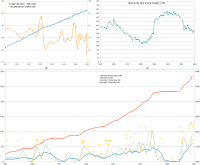
Posted by: dilo Sep 6 2010, 12:13 PM
Time to update:
|
Posted by: AndyG Sep 6 2010, 01:13 PM
Thanks Dilo.
Anyone else spend a few seconds on the upper-right graph, psychically urging Spirit's power levels to chase Opportunity's glorious upwards track?
Andy
Posted by: brellis Sep 6 2010, 01:35 PM
Yeah, it's like a game of cat and tau's!
Posted by: lyford Sep 6 2010, 04:35 PM
Posted by: centsworth_II Sep 6 2010, 06:51 PM
CAT as in Clean Array via Twister?
Posted by: NW71 Sep 12 2010, 10:28 PM
I thought that a stats post for those of you who love to see the rovers rove might go down well!
It struck me recently when Oppy passed the 23km mark on sol 2355 that she is rapidly heading up towards an average of 10m/sol. This got me thinking when was the last time (if ever) that this was the case.
By my reckoning (and please correct me if I'm wrong) the last time Oppy averaged 10m/sol was all the way back on sol 642 (Nov 13th, 2005) when she finished with 6,424 metres on the clock while she was looking at Antistasi.
Spirit last achieved this feat on sol 416 (Mar 5th, 2005) with 4,161 metres. At this point I believe she was on the top of the Columbia hills (Larry's Lookout) studying a site named Watchtower.
When you consider that even the NASA level 1 target (600m in 90 sols) did not require this workload, when you consider that Oppy is so far "out of warranty" she is now nearly five years older than when she could last claim this average, when you consider all the 1001 other amazing scientific tests she has carried out on top of this driving marathon... well, it makes you think doesn't it?!
Neil 
Posted by: climber Sep 21 2010, 07:55 PM
To add to your statements Neil, here are some more informations:
Higher Spirit mean per sol was on Sol 157 June, 12th 2004 roving 21.5m/Sol
Spirit best week ended on Sol 126 May, 7th 2004 roving 86.3m/Sol
Higher Oppy mean per sol was on Sol 438 April, 16th 2005 roving 11.9m/Sol
Oppy best week ended on Sol 415 March, 24th 2005 roving 118m/Sol
On September 14th Oppy mean per sol is 9.8m/Sol (going up) for the whole mission while it's 3.2m/Sol for Spirit (yes, going down)
Now, here is the complete .xls file I use if you want to play around with ...and even fill the gaps I'm too lazy to fill about the begining of the mission.
Statistics_Spirit___Opportunity.xls ( 798.5K )
: 470
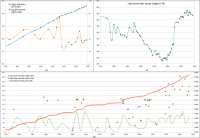
Posted by: dilo Oct 6 2010, 07:05 AM
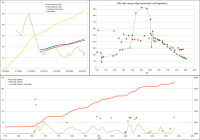
Update.
Encouraging trend of daily odometry and energy budget...
|
Posted by: NW71 Oct 7 2010, 02:35 PM
Statistics_Spirit___Opportunity.xls ( 798.5K )
: 470Climber - firstly, thank you for the chance to download the file with all the data on. Very kind of you.
Secondly, purely looking by eye at Teshiner's excellent route map we must be very, very close to the magical 10m/sol after sol 2381?
Neil
Posted by: SFJCody Oct 19 2010, 01:30 AM
Sol 2400 is coming up. Looks to me like the distance travelled from 2300 to 2400 will be greater than for any other 100 sol period, even sol 400 to 500!
Posted by: NW71 Oct 20 2010, 03:12 PM
Admin - I hope this is ok on this thread. If not please move as you see fit.
As far as the above point goes I think that is right (Climber, Dilo please feel free to correct me)!
At a rough estimate, sol 400 to 500 saw 2,000m travelled.
Sol 2300 to 2395 appears to have covered 2,500m approximately.
Neil
Posted by: centsworth_II Oct 20 2010, 04:14 PM
sol 437 odometry: 5225m
sol 339 odometry: 2076m (rounded)
total from sol 339 to sol 437: 3149m
Posted by: Phil Stooke Oct 20 2010, 04:27 PM
3149 m - about the same distance that was driven on 18 February 1973 by Lunokhod 2! Of course a totally different situation, but it really points out the contrast between driving on the Moon and Mars.
Phil
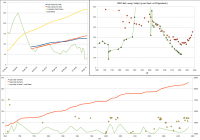
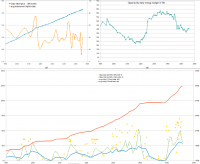
Posted by: dilo Nov 4 2010, 09:09 PM
update... impressive odometry increase in last days!
|
Posted by: climber Nov 5 2010, 04:09 PM
New milestones shortly.
Tomorrow, Spirit will be on Mars since 2500 (Earth) days. So, on Nov 17th both Rovers will reach the 5000 days mark sitting on Mars. I know days means nothing for the Rovers, but it sure means something for us. Also on December 3rd, the difference between days and sols since Spirit landing will reach 100.000 minutes.
The 5000 Sols mark will be reached the day after Oppy will celebrate her 7th years since landing, January 26th 2011.
Another one: as of Nov 2nd 2010, Oppy mean meters per sol is 10.3 (as shown on Dilo's graph above) and increasing very "fast" since she reached 10m by early October.
Posted by: brellis Nov 5 2010, 10:23 PM
Tesheiner's Sol 2410 updated map shows a nice left turn. It's fun to be able to see a direction change during a drive sol -- Oppy's covering a lot of ground!
Posted by: dilo Nov 6 2010, 06:44 AM
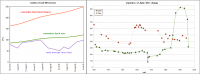
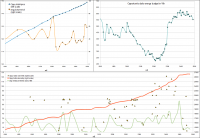
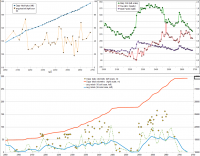
After Climber's observations on odometry speed increase, I decided to amplify the scale of such parameter, in order to better see it. Moreover, I decided to change plots formats in order to make them more readable, using the 2-weeks average system also for pics/day calculations; lines smoothing is also introduced. In all 3 plots, finally, you'll see only Oppotunity data and now the common timeframe is slightly above 1 martian year, in order to appreciate "seasonal" changes:
|
Posted by: NW71 Nov 6 2010, 10:00 PM
One milestone that I think may have been missed occured on Oct 27th when Oppy drove (sol 2403).
This drive saw the combined odometry for Spirit and Oppy go over 20 miles.
I'll just say that again. 20 MILES!
Amazing. Awesome. Inspiring.
Neil
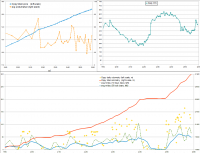
Posted by: dilo Dec 5 2010, 07:57 AM
Monthly update.
|
Posted by: dilo Dec 16 2010, 09:01 AM
Exceptional mid-month update in order to celebrate arrival to Santa Maria... Absolutely impressive level of average odometry in last 6 months (30.7 m/sol) and, especially, in last 2 weeks (67 m/sol)... easy to forecast a little drop in next days dedicated to crater exploration!
|
Posted by: akuo Dec 16 2010, 01:55 PM
Thanks Dilo. How is the daily and weekly odometry compared to the strech from the heat shield to Viking/Voyager craters (around sols 360-460). It would be nice to see if Oppy is actually covering better ground than during those "early" sols.
Posted by: dilo Dec 16 2010, 03:09 PM
Good question, akuo!
In the "guiness days" between Heat Shield and Viking-Voyager exploration (about two months) average Odometry was almost 50 m/Sol, with an exceptional week with 136 m/sol (Sol 407-414); this was also the week in which Oppy reached absolute daily record of 220 meters.
However, Oppy never performed so well in a so long continued period like last one. Look at the total Odometry plot below:
|
Posted by: climber Dec 16 2010, 03:20 PM
Hi akuo and Dilo,
I don't have the exact period but close.
I've got from 360 to 438 = 3024m (then only 330m up to Sol 531) so, this give a mean of 38,77 m per sol
Last 103 sols (2346 to 2449) = 3654m, so it is 35,5 m per sol
Mean per sol since landing day is now 10.8m
Edited 1: with today's data of sol 2449 (very slight change).
Also, a kinda "rush" recentely to get to Santa Maria (mean m/sol)
Edited 2:
Nov 2-10 = 19,0
Nov 10-16 = 19,5
Nov 16-22 = 36,8
Nov 22-30 = 33,9
Nov 30-Dec 8 = 70,8
Dec 8-14 = 62,0
Edited 3: Oppy drove the last 6kms (which is what remains to get to Endeavor) in 239 sols...
Posted by: MoreInput Dec 16 2010, 08:20 PM
Thanks a lot for the whole picture of the journey, dilo!
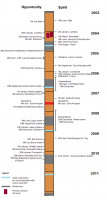
As we reached another milestone (literally), I updated the milestone timeline.
|
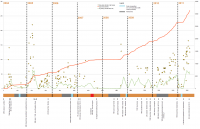
Posted by: MoreInput Dec 16 2010, 10:36 PM
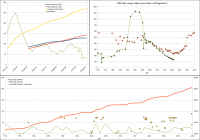
And here's the combined view: driving and milestones!
At the upper part you see the odometry of opportunity. In the lower part you see a modified timeline with the interesting milestones. It is also marked when the solar conjunctions happend (cyan), and the big sand storm in 2007. Marked in grey is the mars winter.
Interesting would also be the energy production per sol.
Points of interest:
* While inspecting Endurance Opportunity drove not really much.
* The daily average odometry peak until they drove into purgatory dune in 2005. Then the driving was much more carefully...
* Entering and leaving Victoria crater took about one year. But it didn't put really much on the odometry.
* At Erebus there was a problem with the shoulder joint, so Oppy was on hold (End of 2005)
* The solar conjunctions are also times for a stop
* Winter time isn't really much a problem for opportunity
* You can also the the stops for Marquette Island (End 2009) and Conception (Begin 2010)
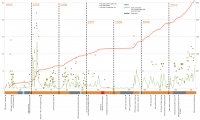
|
Posted by: brellis Dec 16 2010, 10:39 PM
wow! I guess AUTONAV works!
Posted by: dilo Jan 5 2011, 12:05 PM
MoreInput, your "combined view" is great in terms of informations and comprehensibility; if you want, I could periodically send you updated full Odometry and you could integrate milestones...
In the meantime, this is the Oppy update, showing an almost flat odometry in last two weeks (as forecasted):
|
Posted by: algorimancer Jan 5 2011, 02:24 PM
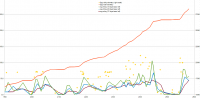
Just to have a bit of fun with bad statistical methodology, here's a 1000 Sol projection based upon and extending from the Sol 1660 to Sol 2440 segment of the graph. The better fit is a cubic polynomial ... very promising, if misleading
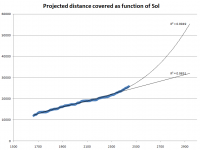
|
Posted by: djellison Jan 5 2011, 02:53 PM
You put the word 'very' infront of the wrong word there.
Posted by: dilo Feb 1 2011, 08:07 AM
Update, poor odometry but good picture rate at Santa Maria, even during conjunction...
|
Posted by: dilo Mar 4 2011, 08:02 PM
Monthly Update; the reduced energy availability will affect odometry in the imminent journey resume...
|
Posted by: ilbasso Mar 4 2011, 09:09 PM
Is the reduced energy because Mars went behind the dark side of the Sun?
(yes folks, I'm kidding...)
Posted by: Phil Stooke Mar 4 2011, 09:27 PM
Good one!
Phil
Posted by: Sunspot Mar 4 2011, 11:58 PM
nearly a years since last contact.
Posted by: dilo Mar 25 2011, 06:52 PM
Update...
|
Posted by: brellis May 4 2011, 11:51 PM
At 10m/sol, Oppy would only need about 2 million sols to travel the entire circumference, eh?
Edit: about 5,000 earth years. What're the odds? Gotta check the Vegas line on that!
Posted by: climber May 5 2011, 08:46 AM
You can take 10% out of this
Global mean as of April 27th 2011 is 11,002 m/ sol (and 2mm a sol x 2 million is to be taken in account
)Her best was back on Sol 438 where the mean was then 11,929m/ Sol.
By the way she already drove 3 more kms since Victoria than she drove from Eagle to Victoria (15706m vs 12678m)
Posted by: brellis May 5 2011, 01:10 PM
Darn metric system! thanks for the correction
Posted by: dilo May 5 2011, 05:55 PM
Late Update...

|
Posted by: Tesheiner May 5 2011, 06:34 PM
I like this latest update, specially the average m/sol figure.
I have one suggestion / request. This figure, as you say, is an average of two weeks. Due to the "restricted sols" there are periods when they drive once a day and others when that is done once every other day. So, assuming a single and only goal of "driving, driving, driving", this average figure would go up and down depending on the period it is measuring: restricted sols or not. My suggestion is to have a figure based on a e.g. monthly period; I think (but didn't do the math) it would be much more stable.
Posted by: fredk May 5 2011, 07:32 PM
I'd add one comment about the smooth (spline?) curves interpolating the points. In some cases, the interpolations overshoot and you get what look like too extreme minima or maxima (pics/sol shows this best). I'd generally vote for straight line segments connecting points or no lines at all, just to avoid any biases like that.
Apart from that, I love these monthly updates - thanks for all the work, Dilo!
Posted by: dilo May 6 2011, 01:11 AM
I have one suggestion / request. This figure, as you say, is an average of two weeks. Due to the "restricted sols" there are periods when they drive once a day and others when that is done once every other day. So, assuming a single and only goal of "driving, driving, driving", this average figure would go up and down depending on the period it is measuring: restricted sols or not. My suggestion is to have a figure based on a e.g. monthly period; I think (but didn't do the math) it would be much more stable.
Thanks Edoardo for suggestion, when I started this activity the two-weeks baseline seemed the best trade-off but I noticed the up-down trend too; now I am seriously considering the possibility to add a monthly baseline...
Posted by: SteveM May 6 2011, 02:05 AM
I have one suggestion / request. This figure, as you say, is an average of two weeks. Due to the "restricted sols" there are periods when they drive once a day and others when that is done once every other day. So, assuming a single and only goal of "driving, driving, driving", this average figure would go up and down depending on the period it is measuring: restricted sols or not. My suggestion is to have a figure based on a e.g. monthly period; I think (but didn't do the math) it would be much more stable.
To refine Edoardo's rough estimate, the exact period you want is 36.378 sols, which equals 37.378 days. To suppress the effect of restricted sols, a 36 day average should do nicely.
Posted by: dilo May 7 2011, 11:38 AM
As element for evaluation, herebelow the updated odometry with 3 different baselines (10, 20 and 37 days):
|
Indeed, the last baseline curve seems by far more regular and this could be due to "restricted sols effect" suppression, as suggested by Eduardo and Steve.
This is the Oppy total odometry with 36 sols average distance:

|
I will implement the new baseline, instead of the 15 days one, for speed curve calculation in the next updates.
Thanks for support!
Posted by: dilo May 14 2011, 08:40 PM
I think impressive odometry in last 2 weeks deserves a special update:
|
Posted by: Tesheiner May 14 2011, 10:40 PM
So, if I'm reading correctly this and the previous graph, these last weeks have the highest average m/sol of the whole mission, right?
Posted by: pospa May 15 2011, 04:36 AM
Maybe just coincidence, but looking at milestones in Tesheiner's maps Oppy keeps quite stable traverse speed of 1 km / 20 sols.
sol 2552 - 27 km
sol 2572 - 28 km
sol 2592 - 29 km
Posted by: dilo May 15 2011, 07:14 AM
Edoardo, if you look at 2nd plot of t my http://www.unmannedspaceflight.com/index.php?showtopic=3705&view=findpost&p=172937, a similar avg speed was reached only in the "glorious week" from Sol407 to 414, when Oppy covered almost 1 km, establishing the absolute record of 220 m in a Sol with 64 m/sol peak average on a 36 Sol/day base.
Is great to see again similar average speed after 6 years and additional 21km covered!
Posted by: climber May 15 2011, 07:05 PM
Yep! Over 52m/Sol since leaving Santa Maria (49 Sols).
Less than 4 kms to go, right?
Posted by: climber May 26 2011, 08:52 PM
Spirit number of pictures per sol was 58...while Oppy is now at 58,7...very consistant or coincidence since the places are so differents?
Posted by: djellison May 26 2011, 09:39 PM
What's coincidental about two near identical rovers with identical cameras and identical communications systems taking the same number of images, on average?
Posted by: climber May 27 2011, 10:51 AM
Yes Doug, this is my thinking too but Oppy did essentialy traverses, longer drives, exploring a very different place as compare to Spirit, kind of different mission even if the vehicules are the same. We'd also have to substract sundial and sun pictures to better compare. It'll be interesting to compare with Curiosity
Posted by: MahFL May 27 2011, 01:13 PM
I thik the subtitle of this topic needs amending, as Spirit is now officially dead.
Posted by: djellison May 27 2011, 01:33 PM
It wasn't when the thread started. Shall we go back through every single thread title and sub title to reflect the now defunct nature of Spirit?
No.
Posted by: dilo May 30 2011, 03:47 PM
Update:
|
Posted by: Gsnorgathon May 30 2011, 07:56 PM
Dilo, I think the legend for the bottom graph should read "Oppy daily odometry (left scale); Oppy total odometry (right scale)".
Posted by: dilo May 30 2011, 08:12 PM
Thanks for highlight, Gsnorgathon, I just corrected the image.
Posted by: dilo Jun 17 2011, 02:26 PM
Half month update, with great Whr increase due to recent cleaning event and steadly high odometry speed!
|
Posted by: eoincampbell Jun 17 2011, 03:52 PM
Hooray for the welcome winds, ( had my fingers crossed ) 
Posted by: remcook Jun 21 2011, 12:33 PM
It's not the wind, it's because of the speed Oppy is driving at the moment!
Posted by: elakdawalla Jun 21 2011, 03:17 PM
Posted by: brellis Jun 21 2011, 04:48 PM
http://www.youtube.com/watch?v=20Feq_Nt3nM
Posted by: brellis Jun 23 2011, 12:36 AM
At some point, Oppy will have descended 100m from its landing place in the trek towards Endeavour crater.
From Emily's chart 
it looks like that will happen soon!
Posted by: brellis Jun 23 2011, 12:53 AM
According to this http://www.nasaimages.org/luna/servlet/detail/nasaNAS~4~4~18906~123414:-Columbia-Hills--Color-Elevation-Ma, Spirit ascended about (edit) 60 meters from its landing place in its climb up Columbia Hills.
Posted by: tanjent Jun 23 2011, 02:33 PM
Re: Brellis' diagram in 194 - I can't see the descent into endurance crater. Is that simply because it was pre-MRO and therefore it missed getting mapped? My sense of perspective must have adapted as the rovers showed what they could do, because I never would have thought that the descent into Victoria was vertically greater than Spirit's climb of Huisband Hill either. I must be misinterpreting the graph. Somebody set me straight!
Posted by: fredk Jun 23 2011, 03:30 PM
That chart is based on MOLA shot data in the neighbourhood of Oppy's journey. Those data samples fall where they fall - they usually don't fall very close to Oppy's route. That data is pretty sparse on that scale, so presumably no samples hit Endurance. Some samples did hit the interior of the much bigger Victoria. But Oppy only drove into Victoria a small part of the way to the bottom, not nearly as deep as the data point.
Posted by: brellis Jun 23 2011, 07:10 PM
Oppy descended about 12m below the rim of the 70m deep Victoria Crater, IIRC.
One of her two major mechanical problems (wheel voltage or arm stiffness, I forget which) precipitated a U-turn.
From wiki, it was the wheel:
Interesting stat from this http://www.sciencedaily.com/releases/2009/05/090521161526.htm:
It wasn't as vertically dramatic as "heading for the Hills", but still...kinda like a roller coaster ride, eh?
Posted by: NW71 Jun 23 2011, 10:14 PM
And so it has continued, despite the fact that we spent a good deal of time shortly after Climber made the above post at Santa Maria crater.
In fact, after today (sol 2635), Oppy has an average of 11.9 metres per sol (31,343 metres). I'll check when this was last the case and get back to you all.
Neil
Posted by: brellis Jun 24 2011, 01:07 AM
Opportunity has been driven backwards since leaving Victoria Crater. Eye ball glance at Google Mars says she's driven about twice as far backwards as she did primarily forward prior to her arrival at Victoria. That's gotta be approaching 20km. Has anyone driven anything that far backwards, anywhere?
Good thing she has eyes on the back of her head!
Posted by: NW71 Jun 24 2011, 10:10 PM
Finally had a chance to look again at the sheets that Climber so kindly made available some 9 months ago.
On Sol 437/8 Oppy had covered 5,225 metres to give an average of 11.96 mtrs/sol.
On Sol 2635 Oppy had covered approximately 31,343 metres to give an average of 11.89 mtrs/sol.
Oppy needs to gain about 170 metres on top of 11.96 mtrs/sol to break her own record which has stood since April 2005.
Neil
Posted by: MoreInput Jun 29 2011, 10:30 PM
As nearly a half year is over, I post a new update of the mission timeline.
The sad milestone is that Spirits mission is now over. Hey, it lauchend over 8 years ago (10th June) ... what a time.
For Oppy there are just two points: Leaving Santa Maria after the solar conjunction, and reaching 30 km.
Some facts:
For the first 10 km Opportunity need 1108 (earth) days
For the second 10 km Opportunity needed 1143 days.
And for the third 10 km Opportunity needed just 435 day.
If dilo has time to update the total odometry sheet I will integrate the milestones again.
|
Posted by: dilo Jun 30 2011, 10:19 AM
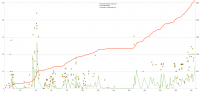
New update (slightly in advance due to imminent holidays... ):
|
Posted by: dilo Jun 30 2011, 10:46 AM
Ii is not possible to attach an .ods file, I will try through email...

Posted by: MoreInput Jul 1 2011, 11:50 PM
As dilo so kind to send me the statistics sheet and the odometer plot, I repaint the integrated drive statistics / mission timeline again.
Nothing really new just more km on the odometer.
|
Posted by: eoincampbell Jul 2 2011, 03:56 AM
A neat combo', thank you both.
Posted by: dilo Jul 2 2011, 06:26 AM
You're welcome, beautiful work!
Posted by: NW71 Jul 2 2011, 06:32 PM
Evening all,
According to Teshiner (post no. 722 on the 'Post Conjuction thread') Oppy's 5 hour driving marathon is now scheduled for sol 2645.
To break her 6 year old average distance per sol I estimate she will need to cover 156.46 metres during that drive.
Just a reminder (as if one was needed) that this is a machine now in her 30th 90 day phase and her 32nd 1km warranty!
Neil
Posted by: NW71 Jul 4 2011, 10:02 PM
And it appears she has! If the reports on the post conjunction thread are correct Oppy travelled 121m + 41m on sol 2645 = 162 m
This means she beats her previous average by just 2mm per sol!
Neil
Posted by: NW71 Jul 8 2011, 01:27 PM
For those of us of a statistical bent today's drive may be yet another significant one for Opportunity as it might have reached 31,788m on sol 2649. If so, this would see her break the 12m per sol barrier. If not today it would appear to be only a matter of time until she does, but it could be her final barrier.
With Cape York and all the other wonders of Endeavour Crater now approximately only 1.5kms away it would appear unlikely that this record will be greatly extended again before we become engrossed in the scientific investigation of Spirit Point and beyond.
Neil
Posted by: brellis Jul 8 2011, 06:36 PM
If Oppy rolls down into Endeavour, she could pick up some speed!
Posted by: dilo Jul 9 2011, 10:42 AM
Neil, I never considered this intriguing aspect of "grand-average" speed...
Based on my dataset (official JPL weekly reports) the 12m/sol record was already broken in the "glory" week, immediately before "soft dune stall":
|
Posted by: NW71 Jul 11 2011, 08:26 AM
Dilo,
Thank you so much for correcting me! I'm assuming sol 2652 has seen us finally break this record?
Neil
Posted by: dilo Jul 11 2011, 10:04 AM
You're probably right, Neil... I'm waiting for official figures (they are not being updating them since June 28!).
Posted by: dilo Jul 12 2011, 05:24 AM
Last updated report gives 11.954 m/sol average (Sol 2647, 31,630.68 m), very close to a new record... in the following week (ending today) we need additional 230 meters only in order to break the old record!
edit: ...and based on last Theseiner's map, Oppy already made a 150m progress from sol 2649 to 2652...
Posted by: Tesheiner Jul 12 2011, 06:42 AM
According to my record, the odometer is currently at 31920m; 31630 from the last official report plus 140m on sol 2649 and 149m on sol 2652.
Posted by: climber Jul 12 2011, 07:22 AM
Even if we rely "only" on the Official odometry, on sol 2647 (july 5th 2011) we were at 11.950 m/sol which breaks the old record of 11.924 on sol 438 (april 16th 2005). Anyway Eduardo's figure shows that we are over 12m/sol now. Using this last figure, we are now 350 m short of reaching 40 kms total for Spirit + Opportunity. (or 2545m short of a full Marathon)
Posted by: dilo Jul 12 2011, 05:38 PM
Climber, my figures are slightly different about previous record (11.96 m/sol on sol 437 and 12.00 on Sol 442) but, at this point, no doubt it was broken in the last days (12.04 on Sol 2652 based on Theseniner data above). So this is my updated plot:
|
Posted by: climber Jul 12 2011, 08:23 PM
Apollo 17 rover / 35.89 km max distance 7.2
Apollo 15 rover / 27.76 km max distance 5.0
Apollo 16 rover / 26.55 km max distance 4.6
Opportunity (2056) / 18.89 km
Lunokhod 1 / 10.50 km
Spirit (2076) / 7.73 km
Sojourner / ?
I come back to this old post to make an update and rise a question/challenge.
New figure shows Oppy now n° 3:
Lunokhod 2 / 37.00 km
Apollo 17 rover / 35.89 km (max distance to LEM 7.2)
Opportunity (2652) / 31.92 km (max distance to lander 17.8)
Apollo 15 rover / 27.76 km (max distance to LEM 5.0)
Apollo 16 rover / 26.55 km (max distance to LEM 4.6)
Lunokhod 1 / 10.50 km
Spirit / 7.73 km
Sojourner / ?
The question/challenge is to find out the maximum distance to the landing base reached for each of the above since this is also a way to compare rovers achievements. Already included what I've found here: http://nssdc.gsfc.nasa.gov/planetary/lunar/apollo_lrv.html
PS for Dilo re previous post: I've got weekly figures only so, on a sol by sol basis, you're probably right, thanks
Posted by: Phil Stooke Jul 12 2011, 08:52 PM
For Sojourner you can put in approximately 85 m.
Phil
Posted by: climber Jul 12 2011, 09:16 PM
Phil
Thanks Phil,
I'm having hard time finding figures for the Lunakhod (max distance to the landing base). I was looking for the LRO's pictures you once posted here for then trying to measure myself (unless you've got the real numbers) but was not good enough using the search tool.
I'll guess Oppy is still n°2 in this regard since I believe Lunakhod II roved more or less "strait" in one direction.
Posted by: Phil Stooke Jul 13 2011, 02:27 PM
Looking quickly at the route map, it appears Lunokhod 2 reached a point approximately 15 km from its landing site. It drove south, east and north again, with other diversions from its route as well. I'll post a map in a lunar thread.
Phil Stooke
Posted by: climber Jul 13 2011, 07:35 PM
With Phil's help and last Oppy drive, here is the whole figure regarding the 8 planetary rovers.
Actual total roving distance
1. Lunokhod 2 / 37.00 km
2. Apollo 17 rover / 35.89 km
3. Opportunity (2654) / 32.00 km
4. Apollo 15 rover / 27.76 km
5. Apollo 16 rover / 26.55 km
6. Lunokhod 1 / 10.50 km
7. Spirit / 7.73 km
8. Sojourner / 0.085 km
Actual maximum distance from landing base
1. Opportunity (2654) / 18.05 km
2. Lunokhod 2 / 14.39 km
3. Apollo 17 rover / 7.2 km
4. Apollo 15 rover / 5.0 km
5. Apollo 16 rover / 4.6 km
6. Spirit / 3.62 km
7. Lunokhod 1 / 2.26 km
8. Sojourner / 0.01 km
Posted by: MoreInput Jul 13 2011, 07:38 PM
I hope we drive further than the Apollo 17 rover ...
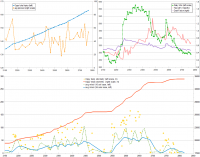
Posted by: dilo Jul 17 2011, 08:12 AM
Update (it was a little tricky to find all information on the renewed MER site):
|
Note1: Due to high speed of Oppy, I had to reduce total odometry scale on the right of lower plot, in order to show all the progress in last martian year...
Note2: the new grand-average speed record is now official: 12.06 m/sol on sol 2655!
Posted by: climber Jul 17 2011, 12:49 PM
Note2: the new grand-average speed record is now official: 12.06 m/sol on sol 2655!
Nice looking actually
Where did you find it as been "Official"?
Posted by: dilo Jul 17 2011, 01:52 PM
Nothing explicit, simply my figures based on last JPL report...
Posted by: climber Jul 17 2011, 09:09 PM
Ok, good enough, I though I was missing something. So, to me, it's as Official as Eduardo's route
Posted by: climber Jul 25 2011, 08:25 PM
As of July 19th, Spirit + Oppy total > 40 km... AND 25 miles (40.283 and 25.027)
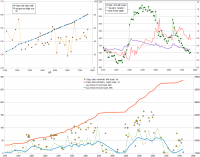
Posted by: dilo Jul 30 2011, 05:38 AM
End-of-month update:
|
Besides some aesthetic changes (most evident is the Odometry plot on top, because I think is the most important!), I added also atmospheric Opacity and DustFactor trends on the energy plot (scale is on the right for both); I think many of you will appreciate!
Posted by: fredk Jul 30 2011, 02:50 PM
Posted by: brellis Jul 30 2011, 05:06 PM
The new Dust Factor is a really cool feature! thanks, dilo
Posted by: climber Aug 29 2011, 02:32 PM
Tosol's 2700 for Oppy
She completes her 30th nominal mission.
Posted by: Syrinx Aug 29 2011, 05:40 PM
NASA may need to extend the mission for a 31st.
Posted by: Tesheiner Aug 29 2011, 08:44 PM
Started a minute ago. 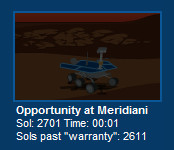
Posted by: MoreInput Aug 29 2011, 09:13 PM
Yeah!
I think they should change the background now ...
Posted by: dilo Aug 29 2011, 10:45 PM
Update:
|
Posted by: dilo Sep 29 2011, 07:12 AM
Update:
|
Increasing Tau and worsening dust factor, joined to seasonal variations, are bringing total energy below 320 Whr/sol...
EDIT: I updated plot in order to show Spt,28 data and zero-speed odometry in last 3 weeks.
Posted by: brellis Oct 25 2011, 04:48 PM
According to http://www.marsdaily.com/reports/Opportunity_Past_21_Miles_of_Driving!_Will_Spend_Winter_at_Cape_York_999.html, Oppy has passed the 21-mile mark and is close to 34,000 meters.
Posted by: Tesheiner Oct 25 2011, 05:49 PM
Actually, she crossed the 34km mark during the last drive on sol 2754.
Posted by: dilo Nov 3 2011, 11:21 PM
Update to Sol 2763 (Nov. 1, 2011):
|
Posted by: climber Nov 21 2011, 09:05 PM
On nov 12th, Oppy's odometry went from 34200m to 34250m putting her record since Jan 1 st over the 7740m mark which is what her Spirit sister drove in her entire Life.
Also, the total odometry of MER rovers was 42058m on Nov 16th short of 137m from having roved a FULL Marathon!
Posted by: climber Nov 29 2011, 10:28 AM
5000 Sols! Think about it: FIVE-THOUSAND-SOLS.
Oppy's today on sol 2790 and Spirit last call was on sol 2210.
This is quite a milestone.
Ready for the challenge, Curiosity?
Posted by: dilo Dec 1 2011, 07:24 AM
Update!
|
Posted by: dilo Dec 30 2011, 08:18 AM
Update to Dec,27 (Sol 2817):
|
only 61cm covered in last 20 Sols (average speed of 3.1 cm/Sol or 1.3 mm/hour or 0.36 um/sec!)
Happy New Year, Oppy!
Posted by: PDP8E Jan 2 2012, 06:48 PM
This topic seemed to be the best place to slide this in...
I think there is a 'year change' bug on the Mars Rover website. The SOL clock is about 353 days off...
Opportunity is currently at SOL 2821-ish
The SOL clock says 2468
http://marsrover.nasa.gov/home/index.html
Posted by: Floyd Jan 2 2012, 10:13 PM
Has happened every year (possibly since prime mission) where they have to go in manually and put in an appropriate constant. Usually takes about two weeks. No one working on that site has wanted to rewrite the code that would go out several years in advance--since how probable is that that the rover(s) will really last another year
Posted by: Deimos Jan 3 2012, 03:50 PM
Get rovers to Mars ... check. Operate them many years past their design life ... check. Write clock software without a Jan 1 bug .. not so much?
The time of sol seems to have been off every time I've been there recently, too. The clock at http://www.lpl.arizona.edu/~lemmon/mars-tau-b.html is accurate. I expect it to not have a leap year bug or anything, but we'll see. (I'll link an MSL clock to the site eventually--sol -210, 20:01:00 as I write, if I've got it right.)
Posted by: fredk Jan 3 2012, 04:25 PM
And http://www.greuti.ch/oppy/html/filenames_ltst.htm differs from Deimos's since the first gives local true solar time and the other hybrid local solar time - is that right, Tman? The sun would be due south at noon LTST, is that right?
Posted by: Deimos Jan 3 2012, 05:07 PM
The Sun crosses the meridian at noon LTST (whether to north or south depends on site and season). The LTB time at the bottom of Tman's page is also accurate for for HLST.
Posted by: dilo Feb 7 2012, 12:15 PM
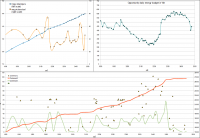
Update on Pictures and Energy figures (odometry unchanged):
|
Posted by: fredk Feb 7 2012, 02:54 PM
Thanks, Dilo. If you look at the Whr curve, you can see what looks like a jump of roughly 15-20% in power at around sol 2800, which is when we pulled into the north-facing winter haven.
Posted by: dilo Feb 7 2012, 03:17 PM
Good catch, Fred. Below a zoomed portion of the plot highlighting the jump and guessing power trend without it:
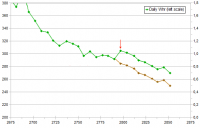
|
Posted by: MoreInput Feb 14 2012, 09:41 PM
As Oppy drives over eight years now on Mars, I post the updated timeline of the MER mission now.
As milestones I took Homestake and Greely Haven.
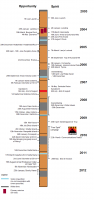
|
Posted by: elakdawalla Feb 14 2012, 10:57 PM
Awesome as usual! A wonderfully succinct summary of two long adventures. A couple of very minor typos: you're missing an 'n' in Endurance, an 'e' in Greeley, and a 'c' in Concepcion.
Posted by: ngunn Feb 14 2012, 11:18 PM
I really like that too. I didn't read the small print but I notice that this winter looks shorter than previous ones. Is there a reason for that?
Posted by: dilo Feb 15 2012, 07:32 AM
Great work, MoreInput!
I integrated your Oppy timeline with my full odometry (implementing Emily's corrections):
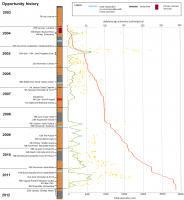
|
Posted by: brellis Feb 16 2012, 12:48 AM
wow! That's the most concise telling of her story yet!
Posted by: MoreInput Feb 16 2012, 08:55 PM
Thank dilo, for putting these two diagrams together. So they are now much more informative than they are alone.
I just corrected some errors (typos, length of winter) in the timeline diagram, and marked just the next solar conjunction far away on 18th April 2013.
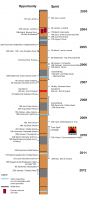
|
Posted by: dilo Mar 2 2012, 05:36 PM
Update showing recent energy increase due to slight Tau/Dust improvements:
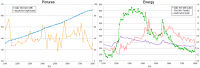
|
Posted by: climber Mar 19 2012, 01:01 PM
Tomorrow, Spirit will be sitting on the surface of Mars since her landing 3000 Earth days ago. Oppy's coming along.
Posted by: dilo Mar 30 2012, 01:08 PM
New update shows a dramatic drop of picture rate (only 2/sol) in the last half-month! I do not have an explaination...
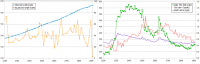
|
Posted by: Deimos Mar 30 2012, 02:14 PM
FYI, the data tracking site shows an average of >20 pictures taken and >20 pictures downlinked per sol over the last 15 sols, so the problem may be elsewhere. (The exact number depends on how you define picture--I looked at total EDNs + ESFs + EFFs downlinked; and at ETHs to determine how many images were successfully acquired.)
Posted by: dilo Mar 31 2012, 09:25 PM
Deimos, I confirm your figures looking at the picture counts from different cameras; however total counter in the upper portion of the http://marsrovers.jpl.nasa.gov/gallery/all/opportunity.html gave me 166290 pictures on March,17 and 166320 pictures on March,30 and this imply only 2pic/day average! as additional info, this counter wasn't updated for several days before yesterday and, at this point, it seems there are problem with it!
Posted by: djellison Apr 1 2012, 04:59 PM
That's not a great place to pull the total number of images taken. That's the number of images taken,downlinked, piped thru the raw processing pipeline and uploaded to the JPL image page.
Posted by: dilo May 4 2012, 07:28 AM
Energy only update:
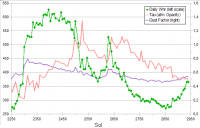
|
Consider that Oppy stopped driving when energy dropped below 300 Whr, almost 5 months ago...
Posted by: dilo Jun 1 2012, 10:59 AM
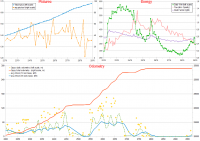
|
Great to see Odometry moving again!
Posted by: MoreInput Jul 1 2012, 06:39 PM
Again, a half year is over for this incredible mission. We are 8 and a half year older since landing, and getting day for day new pictures and new views of the Mars surface. Still unbelievable. It feels just so normal to get news from Mars day by day, even if it is extraordinary we don't think about it.
Just a small update from the mission timeline. I corrected the time at Greeley Haven and added the radio science Doppler campaign.
So, Happy 3000 sols, Oppy!
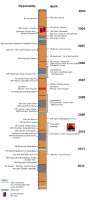
|
Posted by: climber Jul 2 2012, 04:03 PM
On June 12th 2012, Oppy's sol 2981, the MER rovers completed the first Marathon ever roved on Mars. On that day, before Oppy's drive, total distance was 42190,36m a mere 4,64m short of the 42195m of a Marathon. She then roved another 17m to cross the boundary. For having run such a distance myself, I can tell you it's quite another achievement for our beloved friends.
Posted by: dilo Jul 2 2012, 09:36 PM
Congrats to Oppy team for new milestones! And this is the update:
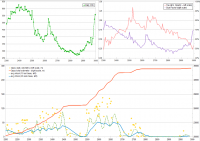
|
Posted by: brellis Jul 3 2012, 07:24 PM
Watching the Curiosity "Dune Buggy" vid got me wondering -- there are lots of examples of wheels spinning in the deep stuff without any actual forward progress. What's the record for a downhill slide by a MER? Could it have happened descending into Victoria Crater?
Posted by: RoverDriver Jul 3 2012, 10:23 PM
We did not skid that much in Duck Bay. There was one instance, sol 1305 I think, where we were driving cross slope around 20-25 degrees and we slid sideways unexpectedly. One instance where I remember we did skid was in the approach to the western rim of Santa Maria. We were doing a "K" drive (partly backwards, then do a K turn, AKA three point turn?, and then drive forward to the rim, can't recall the Sol # possibly in the 2500's. I was the RP and we did get unexpected skid in the backwards portion of the drive. It is also difficult to determine how much of the skid is due to actual skidding and what part comes from the fact that the wheel diameter is about 25 cm when driving on soft soil while it is 26.5cm when driving on bedrock (this drive was mostly on bedrock), the difference in diameter stems from whether you include the grousers or not.
AFAIK we never driven on terrain that is so steep to cause skidding. Skidding would be worse than 100% slip. When you skid you have completely lost control of the vehicle path. The closest Oppy got to become a rock hugger was Wopmay in Endurance Crater, but even then we were driving cross-slope and managed to drive away.
Paolo
Posted by: fredk Jul 3 2012, 10:58 PM
Fascinating as always, Paolo, thanks. For the record, Santa Caterina was an area on the N rim of Victoria. Was it the approach to Santa Maria where she skidded/slipped?
Posted by: RoverDriver Jul 4 2012, 01:38 AM
You are correct. I will edit my post. Thank you for pointing this out.
Paolo
Posted by: dilo Aug 17 2012, 07:43 AM
Late update (vacations + MSL distracted me...):
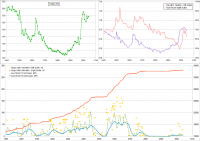
|
Posted by: brellis Sep 1 2012, 05:46 AM
Opportunity has surpassed 35km of travel - http://www.universetoday.com/97146/opportunity-rover-tops-35-kilometers-of-driving/
Posted by: dilo Sep 21 2012, 01:09 PM
Update:
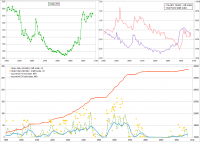
|
Posted by: climber Oct 4 2012, 10:57 AM
Only numbers but well, another achievement: we just passed the 3000 sols after guarenty mark
Posted by: dilo Oct 12 2012, 05:09 PM
Monthly update:
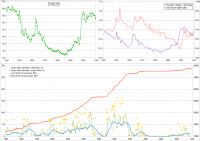
|
Compared to previous martian summer, daily energy budget decreased by 10%; considering that Tau and dust factor were almost the same, this suggests further cells/battery degradation.
Not sure if this could jeopardize next winter survival but I guess she will need a very good orientation station point in order to stay above 250W/sol...
Posted by: fredk Oct 13 2012, 12:19 AM
The problem could be calibration. We've seen that before. The tau and dust factor values they give need some model of the dust on the pancam lens. They periodically update that model. I'd be surprized if the batteries degraded that quickly, but who knows...
Posted by: dilo Nov 15 2012, 09:17 PM
Monthly update:
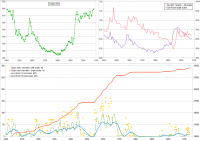
|
Posted by: dilo Dec 26 2012, 08:38 AM
Late Monthly update (purpose is to align it at the change of month, as per MSL):
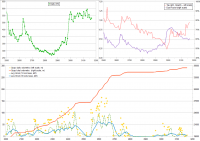
|
Posted by: MoreInput Jan 15 2013, 10:42 PM
Half yearly update of the Mars Rover Exploration Rover timeline.
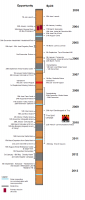
|
Posted by: dilo Jan 19 2013, 04:30 PM
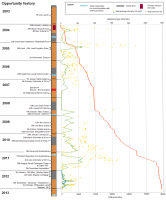
|
Complete Odometry update based on MoreInput timeline.
Posted by: Ant103 Jan 19 2013, 05:31 PM
Excellent work
Posted by: dilo Jan 27 2013, 09:16 PM
update!
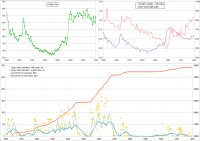
|
Posted by: dilo Jan 28 2013, 06:19 PM
About future energy availability, I made the following plot comparing last daily watt-hours (red points) with corresponding trend in previous martian year, obtained by shifting the date 670 Sol back:
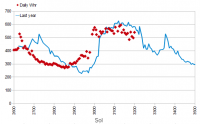
|
There is a strange time shift between the two trends (50-100 sols) and last data seems almost 100 Whr below corresponding energy of previous year trend; anyway, if trend is confirmed, Oppy needs to reach a new winter site within November...
Posted by: djellison Jan 28 2013, 07:14 PM
If you look at http://www.lpl.arizona.edu/~lemmon/mars-tau-b.html you'll see that we get basically the same peaks and troughs each year - but there's often a lag early or late depending on how the weather is doing. Regional dust storms I think can bring spikes forward or push them back.
Posted by: dilo Mar 11 2013, 02:45 PM
Updated charts:
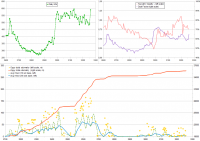
|
(last update on Sol 3260)
ADDED: note the effect of solar panel cleaning events on Sol 3255,56,57!
Posted by: dilo May 31 2013, 09:51 AM
Updated charts, energy trend decreasing again:
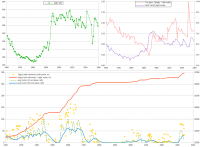
|
(last update on Sol 3344)
Note1: Total odometry in the last two Opportunity Status Reports is given with tens-of-meters precision, contrary to previous ones; if somebody knows more precise figures, this would help in calculating accurate average speed...
Note2: It seems now Status Report is bi-weekly! http://marsrovers.jpl.nasa.gov/mission/status_opportunity.html#recent
Posted by: dilo Jul 1 2013, 06:27 AM
New month, new plots:
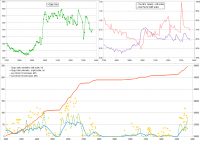
|
Edit: updated to Sol3369 (Jul,18)
Posted by: pospa Jul 20 2013, 12:47 PM
Just for fun and curiosity I'd like to find out what was the Oppy's record in weekly traverse distance - what was the maximum distance trvelled within any 7 following sols.
Do we have somewhere here a list of all sols traveled distances from sol 1 up to tosol?
Can some MER statistics master share such (excel) file with us?
Thanks
Posted by: Explorer1 Jul 20 2013, 05:20 PM
It was sometime after leaving Endurance, I recall (sol 400 or so).
See the chart in this post, with the huge spike around that time: http://www.unmannedspaceflight.com/index.php?s=&showtopic=3705&view=findpost&p=85751
Posted by: dilo Jul 20 2013, 06:12 PM
Pospa, this is the Top Ten list (Explorer1 demonstrate a good memory!):
410 220
408 190
412 183
414 183
383 177
413 175
2616 165
2645 162
363 157
1663 153
I have the complete Excel/OpenOffice file, if you are interested I could send you...
Posted by: pospa Jul 20 2013, 07:54 PM
Thank you both, guys. It is realy amazing, she did once more then 960 meters within 7 sols!
And yes dilo, I'm interested for sure.
Posted by: dilo Jul 21 2013, 09:38 AM
Actually, she covered 1.4 km in 10 days! this happened just after a new navigation software was uploaded, around sol375, then Purgatory stall occurred on Sol446. After this tough experience, she never exceeded 100m for a while!
Posted by: dilo Jul 26 2013, 02:47 PM
Update (Sol3376):
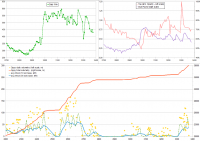
|
Posted by: MoreInput Aug 4 2013, 06:04 AM
A little late, but here is the time line of Oppys incredible journey until July 2013.
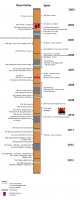
|
Posted by: dilo Aug 4 2013, 07:12 AM
Thanks for timeline, MoreInput!
I integrated it with my updated Opportunity odometry plot (I added also some old daily records previously omitted):
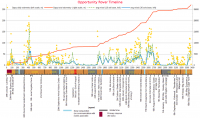
|
Posted by: Explorer1 Aug 4 2013, 07:27 AM
Only one (noteworthy) dust storm in all this time; eventually there will be a global event again right? Hope Oppy fares as well as last time...
Powered by Invision Power Board (http://www.invisionboard.com)
© Invision Power Services (http://www.invisionpower.com)