Printable Version of Topic
Click here to view this topic in its original format
Unmanned Spaceflight.com _ Mars _ Martian Cartography
Posted by: karolp May 15 2006, 04:16 PM
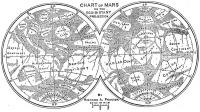
I have recently freaked out a little bit about Martian maps of all sorts. And finally I was astonished with those highly detailed beauties that I list below. Nonetheless. some of them have huge inconsistencies (crater names) easily noticed when we compare the surroundings of Gusev crater. Enjoy:
http://www.ralphaeschliman.com/
http://planetologia.elte.hu/1cikkeke.phtml?cim=1marsmapinte.html
http://pubs.usgs.gov/imap/i2782/
Posted by: PhilCo126 May 21 2006, 03:26 PM
http://marsoweb.nas.nasa.gov/dataViz/
Posted by: Phil Stooke May 21 2006, 04:21 PM
karolp, I have looked at these maps, and I don't see any real discrepancy with the names - I only checked around the Gusev area, since you mentioned it.
The apparent difference is caused by the fact that these maps only use a selectuion of all available names. Each map has a slightly different selection. For instance, the multilingual map from Hungary does not include the name 'de Vaucouleurs'. You need larger scale maps to include all the names which have been assigned to Mars. The USGS set at 1:5,000,000 is a good start, but of course there is the problem of updating.
Phil
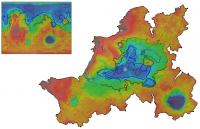
Posted by: DonPMitchell May 22 2006, 05:35 PM
I like the second USGS map.
[attachment=5804:attachment]
Nice hill shading, nice subtle colors, not the usual fully-saturated acid-trip color schemes you see in a lot of NASA images. My one criticism is that the hypsometric color pallette should go from dark to light monotonically with altitude. It's a little confusing that you go from light brown to dark brown and back to light brown again as you head up the Tharsis rise. Things to keep in mind when making your own maps.
Here are two wonderful sites about map making, full of good ideas and wise advice:
The National Park Service: http://www.shadedrelief.com/
History and techniques: http://www.reliefshading.com/index.html. Explore this site, check out the section on Cartographers and examples of their work. What a fascinating art.
For example, look at this amazing projection of a map of Europe designed by Heinrich Berann:
[attachment=5805:attachment]
(By the way, to yank pictures out of the annoying pdf files, you can use PDFExtractTiff by verypdf.com)
Posted by: chuckclark Nov 23 2007, 06:58 PM
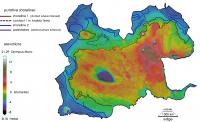
Here are two constant-scale natural boundary maps of Mars showing color topography.
CSNB maps are made by a geometrical method of my own devising. These of Mars were suggested by Rene de Hon at the 2003 ISPRS meeting in Houston.
The "Mars as a dale" CSNB map has as its edge the primary ridges of the southern highlands. It's the view from the top down, so to speak, from the edge of the map inward.
The Mars as a hill" CSNB map has as its edge the primary valley-lines of the northern lowlands. It's the view from the bottom up, relative to the edge of the map inward.
The dividing line of the crustal dichotomy thus occurs as a ring around the middle of each map.
The maps or as twins, mirrored points of view.
The accompanying cylindrical insets show the boundaries of the respective CSNB maps.
Cheers
|
|
Posted by: PhilCo126 Nov 23 2007, 07:34 PM
About three years ago, I've written an article on mapping the planet Mars and its Moons (with cylindrical projections of Phobos and Deimos provided by Philip Stooke  ), more specifically about producing 3D models of the planet (4 foot diameter globes) and the Moons (made by Ralph Turner). E-mail me if You wont those articles in .pdf format...
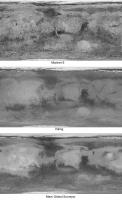
Posted by: Phil Stooke Jan 9 2009, 08:59 PM
here's an interesting comparison if anyone's interested. It's a comparison of global cylindrical (that is, simple cylindrical, or equirectangular) projection maps of Mars from Mariner 9, Viking and MGS. The Mariner 9 one is the 1975 USGS map, reprojected into Simple Cylindrical. Viking is the global mosaic made by USGS. MGS is a composite of TES albedo mapping and the MOC wide angle geodesy mosaic, both with artifacts removed. Some problems remain in all of them, but you do get to see significant changes in the pattern of albedo markings. We tend to forget about them now, being so focussed on boulders and layering. It would be possible to make maps like these for every opposition since about 1840 - that would make an amazing animation!
Phil
|
Posted by: dvandorn Jan 10 2009, 05:22 AM
Great comparison presentation, Phil. Very easy to compare the albedo features mapped by each team.
I do want to point out that the Mariner 9 map was prepared with far greater contrast than the other two maps, which attempt to present realistic-to-the-eye contrast levels. So it's easier to compare features between the Viking and MGS maps. Variations between the Mariner 9 map and the other two maps seem just as likely to be artifacts of the preparation as they are actual changes over time.
Also, I think it bears mentioning that Viking and MGS overflew the terrain at different times of day nadir LST. IIRC, MGS flew over terrain which, at nadir, was at roughly 2pm LST, and I believe Viking had a couple of different windows (with the two different orbiters) but saw nadir at generally lower sun angles (I want to say between 3 and 4 pm LST, but I just can't remember with confidence... *sigh*... ).
We all know albedo features can vary somewhat by sun angle, so at least some of the variations between the Viking and MGS maps may be due to different sun angles.
However, all of that said, there are obviously places where large gross changes (and also small, subtle changes) have occurred in the times between the three eras. And that is very definitely fascinating. Plus, I seem to recall that some people already have done analyses of albedo variations in telescopic images/drawings from oppositions since, oh, probably 1840.... 
In fact, I remember reading a book when I was a kid that presented Mars images from several successive oppositions, comparing the albedo features and noting observed changes. It might make a good thesis for some astrogeology postgrad out there to pull up all those old telescopic analyses and plug them into the patterns of changes we've seen from our orbiters from 1971 to present...
-the other Doug
Posted by: Phil Stooke Jan 10 2009, 01:08 PM
Very true, Doug. The top image was produced in a very different way. While the other two are spacecraft data, albeit manipulated, the top one is a drawing. It exaggerates small details more than the other two, and is more contrasty. My intention is to show surface changes, and it does do that well - look around Isidis and Elysium, or north of Tharsis, especially.
Actually I had another reason for making these. I'm preparing a set of maps to serve as base maps for my Mars atlas. As I go through the history of Mars exploration the base map I use will evolve to follow the growth of our knowledge, and then the changing appearance of the planet. Step 1 is the old ACIC map, pre-Mariner 4, with canals. They have to be converted to Simple Cylindrical so my software can reproject them into the azimuthal projection I will actually use in the book.
Phil
Posted by: tedstryk Jan 10 2009, 01:38 PM
I have a set going back to I think the 1890s...If I can find it I will post it (that is a big if).
Ted
Posted by: AndyG Jan 11 2009, 11:36 AM
Hi Don,
Mapping is an ancient art, and I'm a great fan of relief shading (my Dad's ancient cloth map of the UK's Lake District is a joy to behold). It's a shame that the technique's fallen out of popularity.
AndyG
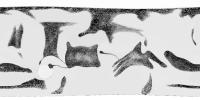
Posted by: Phil Stooke Jan 15 2009, 08:53 PM
Speaking of ancient art... here's a map of Mars made from the Mariner 6 far encounter images.
Phil
|
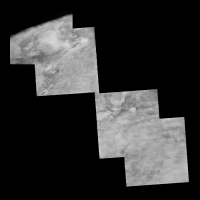
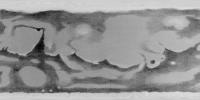
Posted by: Phil Stooke Jan 21 2009, 09:15 PM
... and here's Mars seen by Mariner 7, far encounter only. It took a better set of images than Mariner 6. Next step - add the near encounter frames.
Phil
|
Posted by: elakdawalla Jan 21 2009, 10:14 PM
Very cool. Mars comes in to focus. Thanks for posting these.
Does the shape of Mars and the variety of mapping conventions that have been used over the years cause problems with geographic features appearing to shift from one mission to the next? (Obviously, it's not the geographic features shifting, just the coordinate systems we use to represent them...)
--Emily
Posted by: Phil Stooke Jan 21 2009, 11:28 PM
Not really - shifts between these mariner maps, and between them and the later maps I posted, are partly caused by registration errors (mariner 7 here is more carefully done than mariner 6 was), and partly by albedo boundary shifts - Syrtis Major especially has changed a lot.
Phil
Posted by: mcaplinger Jan 22 2009, 12:13 AM

The main problem other than registration errors has been the various redefinitions of W0 and to a lesser extent, the IAU spheroid. See http://astrogeology.usgs.gov/Teams/Geomatics/geodesy/P22D-06.pdf
Hopefully we are now past these problems, at least at the 100-meter scale.
Posted by: Phil Stooke Jan 23 2009, 02:55 PM
Here is a comparison between a MOC wide-angle mosaic - courtesy of Malin Space Science Systems - and a reprojected version of Mariner 4 frame 1. I can't recall seeing this frame matched to topography before (correct me if I'm wrong). At the time I think people said many features were likely atmospheric rather than on the surface, but this comparison shows a very close match even to the smallest bright spots on the surface. It also suggests only the most trivial changes have occurred in this area. Orcus Patera at bottom right gives the location. Blinking the two halves reinforces the close match.
Phil
|
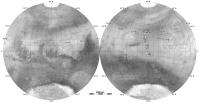
Posted by: Phil Stooke Feb 1 2009, 09:04 PM
This is Mars as it was known just after the Mariner 6 flyby. The background is Mariner 6 far encounter frames, except the north pole which is filled in with a USAF map based on telescopic data. Superimposed on that are the Mariner 4 images (left hemisphere) and Mariner 6's near encounter frames (right side).
Phil
|
Posted by: PhilCo126 Feb 2 2009, 06:17 PM
This is a nice poster: Mariner IV Mars flyby 1965
Posted by: Phil Stooke Feb 2 2009, 06:27 PM
It's a very nice poster, but the locations of the first few images are based on predictions, not feature mapping, and they are not very reliable. The inset at lower left shows the area of image no. 3. It suggests that this was the first one for which surface features could be identified. My post above in this thread shows that even image 1 reveals actual surface features, but they were not recognized at the time.
(sorry, Tayfun!)
Phil
Posted by: Tayfun Öner Feb 2 2009, 08:48 PM
Phil
As far as I remember it was based on a figure from a very old article by Leighton, if I can find the original file I will update the poster.
Posted by: Phil Stooke Feb 2 2009, 09:13 PM
Don't worry, you didn't do it incorrectly, it was your source that was wrong. The original image location predictions are a bit off.
Phil
Posted by: Phil Stooke Feb 4 2009, 05:22 PM
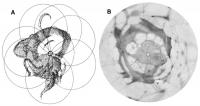
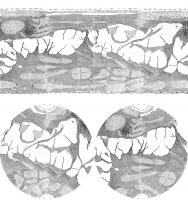
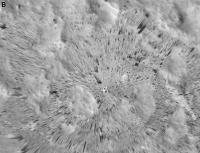
Here's the very beginning of Mars cartography. Who drew the first map of Mars? It wasn't Beer and Madler, as most sources seem to assume. It was William Herschel, in 1783. This is his map, compared with a map drawn in 1962 by the U. S. Air Force for NASA.
Herschel drew Mars over several weeks, observing all longitudes eventually. The small south polar cap was visible in every drawing. He conceived the idea of arranging the full disk images like flower petals, using the polar cap as a fixed central point, so he could see the global distribution of dark markings. In my illustration, his map (labelled A) shows that pattern, with an overlay of circles indicating the individual views which made up his set of observations. In his original, each circle is labelled with the date of observation. Map B is the USAF MEC-1 Prototype made by the Aeronautical Chart and Information Center in 1962 for NASA's Mars mission planning. I have removed the grid and placenames and reprojected it to match the south polar projection of Herschel's map.
The shape of Sinus Meridiani and Sinus Sabaeus at left will be familiar to Mars viewers. The bulge above it is Syrtis Major, not as pointed as in the USAF map, and the triangle at the bottom is probably Lunae Lacus, or a confused combination of that and Margaritifer Sinus. The hook shape at the top is Thoth-Nepenthes.
Phil
|
Posted by: tedstryk Feb 5 2009, 01:34 AM
Excellent work! I have worked with a lot of these images, but making a map like this is out of my league!
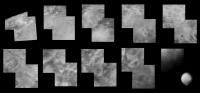
Posted by: tedstryk Feb 5 2009, 01:45 AM
Phil
This makes sense, based on my mosaic of the first four frames.
|
Here is my complete set of two frame mosaics....the image in the lower right hand corner is a telescopic view of the area taken around the time of the flyby.
|
Posted by: Phil Stooke Feb 23 2009, 04:07 PM
I posted a map showing Mars as it was known after the Mariner 6 flyby, a bit earlier. Here's the post-Mariner 7 version. A slight misregistration of the Mariner 6 near encounter mosaic has been corrected here.
Phil
|
Posted by: Byran Feb 26 2009, 01:03 PM
Main results current and history cartography Mars
http://www.planetary.brown.edu/pdfs/3416.pdf
http://adsabs.harvard.edu/abs/2008AGUFM.P31D..04E
ftp://ftp.lpi.usra.edu/pub/outgoing/lpsc2009/full626.pdf
Mariner-9 (1971-1972) 85% 1-2 km 7329 picture
Viking-1,2 (1976-1978) 97% 300 m 51539 picture
MGS (1999-2006) 100% 225m 93893+32414 picture
3% 1.4-12m 85859 picture
Mars Odyssey (2001-2006) 19% <20 m 35% <50 m
Mars Express (2003-2008) 50% 15 m 100% 30 m
Mars Reconnaissance orbiter (2006-2008) 38% 6 m
0.6% 0.25-1.2 m 9549 picture
My prediction future for 2015
Mars Express - 15 metres resolution 3D color global map Mars
Mars Reconnaissance orbiter - 6 metres resolution monochrome global map Mars
MGS+MEX+MRO 0.25-2.5 metres resolution 10% map Mars
Posted by: djellison Feb 26 2009, 02:08 PM
You can scrap MEX from your last line. It can't produced imagery at 2.5m/pixel - the SRC channel that it has is out of focus, so it's best imagery is basically the HRSC Nadir Channel.
Also - at 0.6% in 2 years - a further 6 years will allow MRO to have mapped a further 1.8% - for a total of 2.4% at <2.5m res. Add on MGS's 3% (not all of which is < 2.5m/pixel). That's 5.4%.
Where are you getting 10% from?
It would take MRO 20+ years to get to that figure.
Posted by: Byran Feb 26 2009, 02:50 PM
10% were not precise calculations, but just at random assumption
The future can be better than plans!
Example
http://www.planetary.brown.edu/pdfs/3416.pdf
Context camera (CTX) Planned: 15% (R=6m/px)
http://adsabs.harvard.edu/abs/2008AGUFM.P31D..04E
As of 31 August 2008, 36% of Mars was imaged at 6 m/pixel and 10.8% was covered more than once.
Posted by: Phil Stooke Aug 27 2009, 09:28 PM
Here is a very unusual Mars map - in two different projections. If anybody can identify its source* I'll give them a virtual Mars Bar. Answer next week...
Phil
|
* I mean its original source - it didn't look exactly like this originally, I have made changes.
Posted by: stevesliva Aug 27 2009, 11:38 PM
Schiaparelli? Wasn't my first guess. Lowell was.
Posted by: Phil Stooke Aug 28 2009, 12:25 AM
No, but from the same period as Schiaparelli - even the same opposition as the famous one that resulted in canali and satellites, I think.
Phil
Posted by: nprev Aug 28 2009, 12:44 AM
WAG based on a half-memory: Herschel?
Posted by: Phil Stooke Aug 28 2009, 12:50 AM
You Doofus! No... He was 100 years before the opposition I just mentioned.
Phil
Posted by: nprev Aug 28 2009, 12:53 AM
 ...sorry, haven't been drinking enough lately!
Posted by: Simon_Frazier Aug 28 2009, 02:16 AM
Hi Phil:
I think this might be Dawes' work.
If I recall correctly, he was an English astronomer in the mid-19th century, and he named all the continents and seas he observed on Mars. Places like "Dawes' Continent", and "Dawes' Ocean"...
Simon
Posted by: mhoward Aug 28 2009, 02:20 AM
Hmm. Flammarion? Looks similar, but different.
Posted by: volcanopele Aug 28 2009, 02:51 AM
Asaph Hall?
Posted by: Phil Stooke Aug 28 2009, 03:02 AM
Simon is close... but Dawes was the observer, not the cartographer.
Phil
Posted by: mhoward Aug 28 2009, 03:19 AM
Proctor, then? I wouldn't have guessed that.
Posted by: Phil Stooke Aug 28 2009, 03:25 AM
Excellent - now we have the cartographer, Richard Proctor. All we need now for the unveiling of the great Mars Bar is the publication. Who can track that down?
Proctor was criticised quite correctly for naming too many things after Dawes - including Dawes' Forked Bay, which was Schiaparelli's Sinus Meridiani. So he revised his naming scheme. And look at the map... where Schiaparelli had 'canali', he has rivers!
Phil
Posted by: stevesliva Aug 28 2009, 04:01 AM
Did these guys know how large Mars was? Would have been some wide rivers.
Posted by: nprev Aug 28 2009, 06:17 AM
Okay, an attempt at redemption: Proctor's http://en.wikipedia.org/wiki/Richard_A._Proctor, 1870.
Posted by: Phil Stooke Aug 28 2009, 11:21 AM
No, the 'Other Worlds' map was his first, the one with the flawed nomenclature.
"Did these guys know how large Mars was? Would have been some wide rivers. "
Not really - lines are not usually drawn with width to scale - look at the width of a highway on a road map of a continent.
Phil
Posted by: stevesliva Aug 28 2009, 04:35 PM
Not really - lines are not usually drawn with width to scale - look at the width of a highway on a road map of a continent.
Yeah. And I'm not saying they didn't lack the skepticism to consider that linear features could be lots of other things. It's just that when you look at a globe of the earth, and imagine it through a telescope, you won't see rivers. It would have been interesting to wonder what they expected Earth's albedo features to be. Were they expecting Amazon and Nile or even Red Sea in amongst water, brown land, green land, ice, and clouds?
Might actually be interesting to get a few photos of Mars at opposition through similar or antique telescopes and say, this is about what they were looking at. Granted, the eyeball is a little better than a photo.
Posted by: centsworth_II Aug 28 2009, 04:50 PM
But you may see a band of enhanced vegetation along them.
Posted by: Phil Stooke Aug 28 2009, 06:30 PM
Right - the fertile Nile Valley is much wider than the river and shows up clearly against its dry surroundings. The supposed canals were also thought to be surrounded by irrigated land - the canal itself would have been invisible, they all accepted that.
Proctor and others at the time thought Mars was reasonably Earthlike. Lowell had given up on oceans, but Proctor had not. Rivers were a perfectly sensible interpretation of the faint and barely glimpsed markings. More sensible than canals, really.
Phil
Posted by: MarsIsImportant Aug 31 2009, 12:59 AM
Those maps are interesting from an historical aspect. It's a nice tour down memory lane.
My interest is mainly concentrated on real surface features of Mars and what they tell us about geologic history. Given that Block Island proves a much thicker atmosphere on Mars in the distant past, what does that tell us about the prospects for ice and water related surface features?
Most everything I've been reading lately suggest enormous reservoirs of water ice just underneath the surface of large tracts in many vastly different latitudes of Mars. The more that is found, the more that this suggests there must have been large glacial fields on Mars at one time in the very distant past. Occam's razor tells us that water or ice related processes cannot be logically ignored - as so often has been done in the past.
Posted by: Phil Stooke Aug 31 2009, 09:11 PM
Here's the answer to my map question - the map was published here:
Proctor, R. A., 1888. Maps and Views of Mars. Scientific American, supplement, v. 26, July-December 1888, pp. 10659-10660.
It seems that the map is not very well known. The earlier map from 'Other Worlds than Ours' is well known but has different names for many features. I'm assuming I can post this pic of the original as it's 120 years old. For my illustration I reprojected it to match the division into hemispheres that I am using elsewhere.
Phil
|
Posted by: djellison Aug 31 2009, 09:27 PM
Snow on the poles. I think he can be quite proud of that in 1888
Posted by: nprev Sep 1 2009, 12:27 AM
Very cool map, thanks for educating (me, at least), Phil!
"Fogland"...interesting. That wouldn't happen to coincide approximately with the Tharsis region, would it?
Posted by: elakdawalla Sep 1 2009, 05:07 AM
I like "windy land." Is that Hellas? Appropriate name for the source of planet-encircling dust storms
--Emily
Posted by: Phil Stooke Sep 1 2009, 10:48 AM
This original map is south up - mine was north up. So yes, Windy Land is Hellas, but Fog Land is Argyre, not Tharsis!
Phil
Posted by: JohnVV Oct 1 2009, 06:14 AM
i have 12 maps
|-- marte_1960.png
|-- marte_1988.png
|-- marte_alpo.png
|-- marte_antoniadi_1896.png
|-- marte_antoniadi_1909.png
|-- marte_antoniadi_1930.png
|-- marte_demottoni_1957.png
|-- marte_green_1877.png
|-- marte_lowell_1894.png
|-- marte_maggini_1939.png
|-- marte_schiapparelli_1881_82.png
`-- marte_schiapparelli_1883_84.png
all south up , well the image in the scope is upside down without a Barlow lens .
the 3 oldest
the images are 2048x1024
http://www.imagebam.com/image/0d68c250688261 http://www.imagebam.com/image/19023050688263 http://www.imagebam.com/image/9f2def50688265
i was having some fun with them years ago in Celestia back in `03
it is interesting how things have changed over the years . From Edgar Rice Burroughs to " it's like the moon" with Merrier
then to date with "hay there is melting water STILL " shots from mro and hirise
Posted by: Phil Stooke Oct 1 2009, 08:13 PM
Here's another oldie but goldie:
The 1783 map by William Herschel, drawn in a south polar azimuthal projection, here reprojected into a cylindrical projection with north up. This was the first map of Mars ever compiled. It's often overlooked because of the unusual projection, but in cylindrical projection it's not bad at all. The big dark-ringed shape at the bottom is the residual south polar cap.
Phil

|
Posted by: JohnVV Oct 2 2009, 09:06 PM
Phil I did not know of that one
from 1783 cool
Posted by: Phil Stooke Oct 22 2009, 01:31 PM
Here are a couple of other early maps which I have converted to cylindrical projection for use elsewhere. The Beer and Madler map corrects a mistake in their original. The Green map adds the poles, and in both cases the original grid and text labels have been removed.
Phil
Beer and Madler:
|
Green:
|
Posted by: Phil Stooke Oct 22 2009, 03:56 PM
I've added an illustration showing five historic maps of Mars, including the three shown above, but all reprojected into a different projection, to my Mars Atlas web page:
http://publish.uwo.ca/~pjstooke/marsatlas.htm
This is from the historical intro part of the book.
Phil
Posted by: ElkGroveDan Oct 22 2009, 04:01 PM
Phil I really love the Lunar Book. I can't wait for this one.
Posted by: machi Jun 25 2012, 01:09 AM
I did my first map - Martian topography map.
I suppose, that I'll write more info about it tomorrow on my blog.
Map is now available as 9MB jpeg (with equivalent resolution 2 km/pix) and if it'll be okay (all comments are welcome!),
then I want to upload PDF version (which is much more useful, but also much larger - 56 MB):
http://www.planets.wz.cz/mars/marsorig/mar_mgs_dam_001.jpg
Posted by: Phil Stooke Jun 25 2012, 02:44 AM
Nice map! One comment - the position for Mars 2 should be 10 degrees further east. The position you show is the one reported as "where Mars 2 entered the atmosphere", but it was not travelling vertically to impact at that point, it was travelling to the east at a very low angle. The published locations of atmospheric entry and impact for Mars 6 make it very clear how this worked.
Phil
Posted by: djellison Jun 25 2012, 05:29 AM
I especially love the color scale used - very nice - it retains that blue 'Oh..was this an ocean??' of the low altitude, but is clearly martian above it. LOVELY work.
D
Posted by: vikingmars Jun 25 2012, 06:12 PM
CONGRATULATIONS Machi : how beautiful (and useful with all those elevations) !

(PS : I thought that the minimum depth in Hellas was -8,200 m, the USGS figure. Please, how did you get -8,530 m ?)
Posted by: machi Jun 25 2012, 07:21 PM
Phil
Thanks and thanks as well for info about Mars 2 (this will be repaired in pdf).
D
Thanks! I used altimetry scale similar to that from maps in my old school atlas. I always liked these maps, so I think that's good idea.
And false color images from HRSC (with infrared as red) have similar colors in dependence on elevation. Deeper -> more atmosphere -> bluer, heigher -> less atmosphere -> redder.
(PS : I thought that the minimum depth in Hellas was -8,200 m, the USGS figure. Please, how did you get -8,530 m ?)
Thanks!
USGS figure is somewhat weird. Lowest point in Hellas Planitia was measured as -8197.51 meters below areoid. This is information from PEDR MOLA altimetry profiles. But in MEGDR maps, they have lowest point as -8208 meters. And MEGDR maps are constructed from PEDR profiles! I suppose, that this is some minor flaw in interpolation algorithm, which can did some errors (+/- 10 meters in some points). Or this algorithm works with slopes and can extrapolate possible peaks and depressions. I don't know.
Hellas' depth (-8530 meters) in the map is based on HRSC DTMRDR dataset. All data from this dataset are depicted as blue triangles (it is depicted in small legend down in the map). It's not so good visible in jpeg, it's better in pdf.
This dataset has digital terrain models with better local coverage and because of that often with better data for some regions. Authors of this dataset used data from MOLA altimeter as source of true elevations (they mapped elevations in DTM with help of MEGDR maps). Because they used not only same dataset, but also same areoid model, informations about elevation are (in theory) compatible between MOLA PEDR and HRSC DTMRDR.
This (-8530m) information looks weird, but I look at these DTM and MOLA detected lowest point as deep crater and in DTM data, smaller crater (undetected by MOLA) is in the middle of this crater, so this small crater in larger crater (which is in another crater - Hellas Planitia
) is actual deepest point on Mars.
Posted by: vikingmars Jun 25 2012, 08:55 PM
) is actual deepest point on Mars.Thanks a lot Machi for all your good explanations.
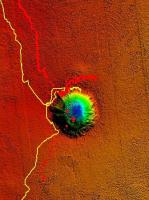
Did you make a more detailed hi-res elevation map of the inside of the crater with its small crater in its middle ? (please, see CTX image herewith, with the small crater marked with a yellow "+")
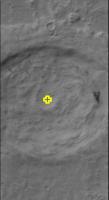
|
Posted by: machi Jun 25 2012, 10:00 PM
"Did you make a more detailed hi-res elevation map of the inside of the crater with its small crater in its middle ?"
No, I didn't. It's possible (one can use local DTM in same way as global DEM), but my plan was to work only on global map of Mars.
But I can confirm, that your crater is that lowest place.
Here is part of browse image for h0532_0000 observations (shadow relief, BW image, color image) and DTM (with "cool" LUT) with dark (deep) crater.
|
|
Posted by: vikingmars Jun 26 2012, 10:10 AM
Thanks so much Machi
And about Olympus Mons ? I guess that your 21,281 m elevation now replaces 21,229 m as calculated by USGS ?
As for the crater in Hellas, could you, please, be so kind to show us a detailed map showing us where is the exact topmost place on the summit of Olympus Mons (between the main caldeira and Pangboche crater I guess...) ? Thanks a lot !
Posted by: machi Jun 26 2012, 06:21 PM
Finally I did http://my-favourite-universe.blogspot.cz/2012/06/topograficka-mapa-marsu.html about my map.
I downloaded new improved version (26.6.2012) with corrected Mars 2 landing site and minor changes (more HRSC elevations, proper citations).
Map is now available as http://4.bp.blogspot.com/-P_3ALLICAMc/T-nq-nyxudI/AAAAAAAAAP8/N0jwGrHKq50/s0/MarsMap2.5kmpix.jpg (9MB) and as https://docs.google.com/open?id=0B7ahcDowD8i_blRndVA0QzA0bEk (56MB).
JPG is alright, but I have some problems with PDF. It is too big for Google Docs, so it is not so easy to download this version. For example, Google writes, that it cannot check PDF with antivirus, because it's too big. But download link is despite this fully functional, and I don't know about any virus in my PDF .
http://my-favourite-universe.blogspot.cz/2012/06/topograficka-mapa-marsu.html
And about Olympus Mons ? I guess that your 21,281 m elevation now replaces 21,229 m as calculated by USGS ?
As for the crater in Hellas, could you, please, be so kind to show us a detailed map showing us where is the exact topmost place on the summit of Olympus Mons (between the main caldeira and Pangboche crater I guess...) ? Thanks a lot !
I plan smaller blog entry about highest and lowest place on Mars, so patience!
Posted by: machi Dec 11 2012, 11:25 PM
I have uploaded new (fifth) version of my topographic map of Mars (14 MB jpg):
http://2.bp.blogspot.com/-iHfkEf5vshs/UMeYXYjk7uI/AAAAAAAAAXs/bOfvxVuVCCM/s0/MarsMap11.12.2012.jpg
Most of changes are related to the new names on Mars. Those names can be found on http://astrogeology.usgs.gov/HotTopics/index.php?/categories/26-Planetary-Nomenclature.
https://docs.google.com/uc?export=download&confirm=no_antivirus&id=0B7ahcDowD8i_UTZ3SlFNV0VkdVk (57 MB!).
Posted by: TheAnt Dec 14 2012, 06:56 PM
Thank you machi, wonderful map. I spent quite some time browsing around on it.
A map like this gives one really good context for what Mars is like.
And thank you for posting the old maps, some of them do indeed remind me of what Mars looks like in a telescope.
I have seen the bows and hook shape, though the map by Beer and Madler does not look much to how I remember Mars trough the ocular - that's one oddball.
Also I took a look of the highest and lowest points, so rest assured that your blog might be of interest.
Posted by: machi Dec 14 2012, 07:59 PM
You're welcome!
But old maps are mostly posted by Phil, not by me!
Posted by: TheAnt Dec 14 2012, 08:32 PM
Yes I felt it as a good time to make a nod to Phil and JohnVV while I were at it posting in this thread.
Posted by: machi Dec 14 2012, 08:35 PM
I see that I promised post about lowest and highest points on Mars and I forgot to give a link.
http://my-favourite-universe.blogspot.cz/2012/07/martanske-extremy.html
Posted by: vikingmars Dec 27 2012, 08:28 AM
Thanks a lot Machi. A long belief was that the topmost point of Olympus Mons was somewhere between the main caldeira and Pangboche crater. Now, thanks to you, we know now that it's right at Pangboche crater rim... What a BIG improvement you made on the global Martian topographic data.
Your work deserves
 (i.e. an "Olympus Games" GOLD medal !!!!)
Posted by: Lucas Jul 23 2014, 07:09 PM
There is a new geologic map of Mars that was recently released by the USGS -- check it out!
http://pubs.usgs.gov/sim/3292/
Posted by: machi Nov 3 2014, 01:16 AM
I've just published my new topographic map of Mars in Mercator and polar stereographic projections.
Basic info is directly in the map.
Map is available as 17 400 × 14 700 pix 78 MB jpeg via https://www.flickr.com/photos/109586958@N03/15663993206/ and as https://docs.google.com/uc?export=download&confirm=nnqP&id=0B7ahcDowD8i_bGNLRDRNSWI2QzQ (106 MB!).
As always for big PDFs, I recommend Sumatra viewer.
Some other infos are on my http://my-favourite-universe.blogspot.cz/2014/11/topograficka-mapa-marsu-ve-vysokem.html but it's in Czech language.
https://www.flickr.com/photos/109586958@N03/15663993206/
Posted by: vikingmars Nov 3 2014, 09:45 PM
Basic info is directly in the map.
WOW ! WOW ! WOW ! What a MAP !!!!!!!!!!!
Thanks so much Machi for sharing this impressive work of yours.
Thank you so much again.
With warmest regards, VM
Posted by: Bjorn Jonsson Nov 3 2014, 09:59 PM
Very impressive work. And Google translate apparently does a relatively good job translating the Czech text into English - I think I was able to understand/interpret all of translated text.
Posted by: machi Nov 6 2014, 07:00 PM
You're welcome!
Google translate is very good for some languages in case of translating them to English and Czech is one of them ( I think
).
Posted by: machi Jan 25 2015, 11:21 PM
https://drive.google.com/file/d/0B7ahcDowD8i_WnVnU0wwZ2QyMlU/view?usp=sharing of Mars is now available.
This "Easter egg" version has high resolution (~ 100 m/pix) parts around most of the landing sites.
It works only as PDF so only this version is available. It has 116 MB and it needs good PDF viewer and
computer with enough power (tested with Sumatra, FOXIT, SMART viewer and 8GB RAM).
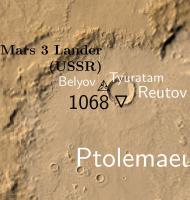
For an example here is part around Mars 3 landing site (located via HiView, longitude 202.01934056, latitude 45.0445105).
EDIT: Files are now with correct English abbreviation for Soviet Union.
|
Posted by: vikingmars Jan 26 2015, 10:48 AM
Dear Machi, thanks so much !!!!
Could you, please, be so kind to provide us also with the Mars 3 lander elevation ?
Thanks so much in advance and with warmest regards,
VM
Posted by: machi Jan 26 2015, 10:47 PM
You're welcome!
Closest measurement from MOLA gives 1626 meters, HRSC DEM with better coverage but with lower precision gives ~1660 meters.
Best guess based on published data 1655+/-30 meters. I suppose that I will add elevations for every identified lander in future version of the map.
BTW, according to HiView coordinates of Beagle 2 are 90.4303226,11.5270253. These are slightly different than values which http://www.unmannedspaceflight.com/index.php?showtopic=7962&view=findpost&p=217082. This very small difference gives location error ~500 meters. But I have no idea how precise HiView is but based on my experience with other landers I suppose
that Google is worse than HiView.
Posted by: djellison Jan 26 2015, 10:51 PM
I pulled my values from HiView also...which is worrying.
Posted by: vikingmars Jan 26 2015, 10:52 PM
Closest measurement from MOLA gives 1626 meters, HRSC DEM with better coverage but with lower precision gives ~1660 meters.
Best guess based on published data 1655+/-30 meters. I suppose that I will add elevations for every identified lander in future version of the map.
BTW, according to HiView coordinates of Beagle 2 are 90.4303226,11.5270253. These are slightly different than values which http://www.unmannedspaceflight.com/index.php?showtopic=7962&view=findpost&p=217082. This very small difference gives location error ~500 meters. But I have no idea how precise HiView is but based on my experience with other landers I suppose
that Google is worse than HiView.
Thanks a lot Machi !
Posted by: machi Jan 26 2015, 11:06 PM
From which image? I've used ESP_037145_1915.
I tried to extract location again in full resolution and it gives me 90.43036115568,11.52698736394 or 90.43036543916,11.52698314553.
And I used wrong number in calculation so it's not error ~500 meters but only 50 meters. That's relatively negligible error.
Posted by: machi Jan 27 2015, 10:42 AM
My apology, as in previous version, I forgot Czech abbreviation of the Soviet Union in the map.
Now links leads to version with correct English abbreviation.
And I've added small new feature - the map has hidden word "outpost" which facilitates the searching for landing sites.
Posted by: machi Jan 15 2016, 02:12 AM
Updated version of my map with all official names up to date 14.1.2016.
Full resolution image has ~110MB and PDF has 117MB.
BTW, lowest place on Mars has finally official name - crater Badwater.
https://www.flickr.com/photos/109586958@N03/24017504669/
Posted by: vikingmars Jan 20 2016, 09:04 AM
[quote name='machi' date='Jan 15 2016, 03:12 AM' post='229048']
Updated version of my map with all official names up to date 14.1.2016.
What an INCREDIBLE work !!!!! Thanks a lot Machi !
Posted by: serpens Apr 12 2016, 01:52 AM
Interesting to match Machi's stunning topographical map with the just completed Gravity and crustal thickness maps.
http://mars.nasa.gov/mro/news/whatsnew/index.cfm?FuseAction=ShowNews&NewsID=1899
Posted by: kamkaran Dec 8 2016, 11:17 AM
what a nice photos 
Posted by: Rain Nov 28 2018, 10:36 AM
https://www.voxxlr.com/1531074107806
My Mars model
Where can i get digital elevation data for Mars?
Posted by: RoverDriver Nov 28 2018, 03:00 PM
My Mars model
Where can i get digital elevation data for Mars?
HiRISE DEMs are available here: https://www.uahirise.org/dtm/ Keep in mind that the corner coordinates can be of by quite a bit.
Paolo
Posted by: kymani76 Jan 7 2019, 08:02 PM
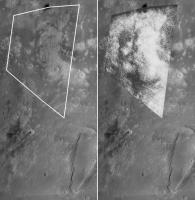
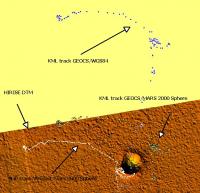
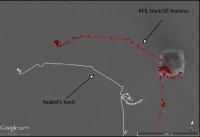
I am currently doing some Mars cartography work and just realised that Spirit and Opportunity tracks in Mars2000 Sphere projection published at Analyst's Notebook don't align with Google Earth kml based data and vice versa. Does anyone have any idea which projection is used to display Google Mars data, as it does not seem to use standard GSC/WGS84? Thank you.
|
Posted by: Phil Stooke Jan 9 2019, 04:58 AM
I don't know, but I looked at the traverse map in Analysts Notebook and it matches the background map properly. That map is in a cylindrical projection. It might be that cylindrical projection data have been mapped straight onto the GE globe without correction.
Phil
Posted by: machi Jan 9 2019, 06:01 PM
My Mars model
Where can i get digital elevation data for Mars?
Sorry for late reply,
you can download global DEMs from MOLA altimeter here: http://pds-geosciences.wustl.edu/missions/mgs/megdr.html
There is also combined MOLA/HRSC DEM https://astrogeology.usgs.gov/search/map/Mars/Topography/HRSC_MOLA_Blend/Mars_HRSC_MOLA_BlendDEM_Global_200mp_v2 but for now server is down thanks to US budget shutdown.
Posted by: machi Jan 9 2019, 09:45 PM
New version (1.2) of my Topographic Map of Mars.
It contains all official names up to end of year 2018 but main difference between this version and the previous one is new base map with higher resolution
so now map shows almost twice as much details.
There are also new mini scale bars directly in the map so estimating size of surface features is now much easier when browsing at full resolution.
https://drive.google.com/file/d/1kbH1OXmFsuTFNrx4ETIvvfu_YSsWuC4o/view?usp=sharing(171 MB!) contains on top of that more detailed regional maps of most of the landing sites including some future ones (Jezero crater and Oxia Planum).
More detailed description of changes is http://my-favourite-universe.blogspot.com/2019/01/topograficka-mapa-marsu-verze-12.html (in Czech language but there is a Google translate button on the page).
https://www.flickr.com/photos/109586958@N03/39701330513
Posted by: vikingmars Jan 10 2019, 06:02 PM
[quote name='machi' date='Jan 9 2019, 10:45 PM' post='243339']
What a feat ! Congratulations Machi for this outstanding work
Btw, about the deepest point in Hellas, which figure you would recommend for EPO purposes, please : the one derived from MOLA or the one from HRSC ?
Posted by: machi Jan 11 2019, 01:38 AM
Thank you!
I would recommend HRSC result. MOLA result is in this case affected by lack of coverage as it clearly missed the lowest point.
It's a pity that MOLA suffered fatal malfunction long before MGS' end of mission. We could have better coverage of the Martian surface by the laser altimetry.
Posted by: vikingmars Jan 11 2019, 09:53 AM
It's a pity that MOLA suffered fatal malfunction long before MGS' end of mission. We could have better coverage of the Martian surface by the laser altimetry.
Dear Machi, Thank you very much for your kind answer
Posted by: kymani76 Jan 11 2019, 12:14 PM
Phil
First of all, thank you Phil very much for your attention, I was really hoping for your answer.
Yes, the Analyst's track aligns perfectly with HiRISE imagery as well as with stereo DTM's in Equirectengular Cylindrical Projection using Mars2000 sphere. What does not align are Opportunity tracks (and other Mars data) I originaly got in KML format. The first picture illustrates the point. Even when the track is reprojected from basic WGS84 to Mars2000 sphere datum, KML track still won't align.
And vice versa. When I load SHP Analyst's track into GE Mars, it is off by about 200 meters (second picture), but all KML based data aligns nicely.
It appears to me the problem lies with the the fact the apparently unknown datum other than WGS84 or Mars2000 Sphere is used by Google Mars, and so the transformation does not work out.
For Curiosty rover I only have Fernando Nogal's excellent track in KML and am not sure how well it aligns when reprojected onto EC Mars2000 Sphere map
Is it in the right place or is off by the same amount as the other KML Mars data?
Thank you in advance, Jack
|
|
Posted by: Greenish Mar 8 2021, 05:09 AM
Regarding the map projection & registration, for rover ops, I learned some things when mcaplinger pointed out this MSL document a little while back: https://pds-imaging.jpl.nasa.gov/data/msl/MSLPLC_1XXX/DOCUMENT/PLACES_PDS_SIS.PDF
For Curiosity, there were some deliberate simplifying assumptions made regarding position plotting on the mission-specific image mosaic. I wonder what the status is for Perseverence... the orthoimages and DEMs at the USGS site (e.g. https://astrogeology.usgs.gov/search/map/Mars/Mars2020/JEZ_hirise_soc_006_orthoMosaic_25cm_Eqc_latTs0_lon0_first) are much larger and more comprehensive from what I can tell, but they may not be exactly what the operations team is using.
Posted by: Andreas Plesch Mar 8 2021, 02:10 PM
For Curiosity, there were some deliberate simplifying assumptions made regarding position plotting on the mission-specific image mosaic. I wonder what the status is for Perseverence... the orthoimages and DEMs at the USGS site (e.g. https://astrogeology.usgs.gov/search/map/Mars/Mars2020/JEZ_hirise_soc_006_orthoMosaic_25cm_Eqc_latTs0_lon0_first) are much larger and more comprehensive from what I can tell, but they may not be exactly what the operations team is using.
Thanks, that is a very helpful document. I learned that the rover positions are with respect to the center between the center wheels, that RMC means Rover Motion Counter, that the onboard positioning can get refined, and how the stacked system of reference frames is defined. Given this, it seems to me that the coordinates provided in the geojson data are directly from the PDS PLACES (or successor) database. Unfortunately, I could not find direct access to the PDS PLACES database for the Mars2020 (M20?) mission, only previous missions, for a more robustly defined source. For example, it is unclear if the geojson provided latitudes are planetocentric or planetodetic as both are described. But choosing the wrong interpretation for projecting back into the equirectangular projection used for the base map would lead to an obvious mismatch I think.
I am using that USGS mosaic and here is the geotiff CRS:
PROJCRS["Equirectangular Mars 2000 Sphere IAU",BASEGEOGCRS["D_Mars_2000_Sphere",DATUM["Mars_2000_(Sphere)",ELLIPSOID["Mars_2000_Sphere_IAU",3396190,0,LENGTHUNIT["metre",1]],ID["ESRI",106971]],PRIMEM["Reference_Meridian",0,ANGLEUNIT["degree",0.0174532925199433,ID["EPSG",9122]]]],CONVERSION["Equidistant Cylindrical",METHOD["Equidistant Cylindrical",ID["EPSG",1028]],PARAMETER["Latitude of 1st standard parallel",0,ANGLEUNIT["degree",0.0174532925199433],ID["EPSG",8823]],PARAMETER["Longitude of natural origin",0,ANGLEUNIT["degree",0.0174532925199433],ID["EPSG",8802]],PARAMETER["False easting",0,LENGTHUNIT["metre",1],ID["EPSG",8806]],PARAMETER["False northing",0,LENGTHUNIT["metre",1],ID["EPSG",8807]]],CS[Cartesian,2],AXIS["easting",east,ORDER[1],LENGTHUNIT["metre",1,ID["EPSG",9001]]],AXIS["northing",north,ORDER[2],LENGTHUNIT["metre",1,ID["EPSG",9001]]]] - Projected
I think it is exactly the projection described in the PDS pdf, including the sphere radius of 3396190m.
The Where is the rover ? online map uses leaflet and proj4leaflet plugin which indicates that it uses a custom map projection, likely the equirectangular projection, for the tiled base map. The traverse data on the other hand had a crs field indicating potentially use of a terrestrial crs.
I am relying on QGIS/GDAL to convert between CRSs which should be better than trying to do it myself although the conversion is straightforward for this projection.
On a side note, I saw in the MSL PDS archives that there are site specific mesh reconstructions of local topography, presumably based on stereo imagery. It would be cool if Mars2020 could make those available. They are probably generated currently.
I also saw in the configuration data for the online map that there is an option for "site experiences", and that THREE.js is being loaded, a popular web 3d rendering library, presumably in anticipation of such experiences once they are ready for consumption. Something to look forward to.
Posted by: Greenish Mar 9 2021, 07:16 AM
Great, I'm glad you were able to make some use of it. I'm a GIS neophyte so appreciate you posting the details.
In terms of other potential resources - this SPICE topocentric kernel was made pre-landing, but other than exact coords of actual landing has useful detail:
https://naif.jpl.nasa.gov/pub/naif/MARS2020/kernels/fk/m2020_tp_jez_iau2000_v4.tf (it in turn https://naif.jpl.nasa.gov/pub/naif/MARS2020/kernels/pck/pck00010.tpc many https://astropedia.astrogeology.usgs.gov/alfresco/d/d/workspace/SpacesStore/cff0ec29-ce29-4c39-a361-1500af5b696b/Duxbury.pdf, but I think the upshot is that "IAU" + "east-positive longitude" seems to indicate planet'ocentric).
The above kernel provides the local definition that connects to the rover kernel, which fully defines all the other transformations. Note that the one in the main folder doesn't seem to be quite as complete as this one, which has more instruments:
https://naif.jpl.nasa.gov/pub/naif/MARS2020/misc/hlee/m2020_v03.tf
So far as I know (which isn't that far) PLACES is internal to JPL. But the data does get published with the periodic PDS releases. I think the .geojson is a great asset that gets most of what we'd want from there in terms of near-real-time location data.
Posted by: Andreas Plesch Mar 10 2021, 01:27 AM
Wow, another document covering similar topics.
Some notes:
https://naif.jpl.nasa.gov/pub/naif/MARS2020/kernels/fk/m2020_tp_jez_iau2000_v4.tf
"The landing site Gaussian longitude and latitude upon which the definition is built are:
Lon = 77.429800 degrees East
Lat = 18.670633 degrees North
"
This is far from the actual landing site.
https://naif.jpl.nasa.gov/pub/naif/MARS2020/kernels/pck/pck00010.tpc
"Mars
Old values:
Values are from the 2006 IAU report.
body499_radii = ( 3397. 3397. 3375. )
Current values:
The 2009 IAU report gives separate values for the north and
south polar radii:
north: 3373.19
south: 3379.21
The report provides the average of these values as well,
which we use as the polar radius for the triaxial model.
BODY499_RADII = ( 3396.19 3396.19 3376.20 )"
It appears earlier USGS products used this (averaged) ellipsoid but I think now use a spheroid with 3396.19km radius.
https://naif.jpl.nasa.gov/pub/naif/MARS2020/misc/hlee/m2020_v03.tf
"Local Level Frame
-------------------------------------------------
M2020 local level frame, M2020_LOCAL_LEVEL, is defined as follows:
- +Z axis is along the downward normal at the landing site
("nadir");
- +X axis is along the local north direction ("north");
- +Y axis completes the right hand frame ("east");
- the origin of this frame is located between the rover's middle
wheels and moves with the rover.
Since this frame is essentially the M2020_TOPO frame flipped by 180
degrees about +X ("north") to point +Z down, this frame is defined
as a fixed offset frame with respect to the M2020_TOPO frame."
This is consistent with the PLACES document. So these documents seem to be developed together, and do not compete with each other (luckily).
There are cool ascii drawings of rover reference frames and mentioning of sclk which shows up as field in the geojson.
There are cool ascii drawings of camera reference frames. The MASTCAM frames includes toe in angles of -1.25 deg. and +1.25 deg. for right and left.
There are cool ascii drawings of arm axes frames.
Everything is referenced by id with value mappings somewhere else.
SCLK means SPICE spacecraft clock (SCLK) kernel.
It turns out that the PLACES document pdf for MSL lives along with the database archive, last updated in December: https://pds-imaging.jpl.nasa.gov/data/msl/MSLPLC_1XXX/
But there is no PDS archive for Mars2020 yet, it appears. There is a https://pds-imaging.jpl.nasa.gov/data/reviews/mars2020/. But it mentions that PLACES is not included to be picked up later.
Posted by: Greenish Mar 10 2021, 03:18 AM
Sorry if I was unclear. The file was made as a placeholder until actual landing. The M2020 team will be using an updated version by now, but everything except the coords will be identical. (We know those from other sources. Posting operational SPICE kernels on public-facing side is probably not a priority.)
Posted by: kymani76 Mar 12 2021, 03:01 PM
On the subject of Percy's geoJSON precision. I've noticed that since the sol 20 update they started using 9 decimal places coordinates. This presupposes mm level positional accuracy.
The track line itself still uses 6 decimal places precision, or 0.1 m accuracy, which seems much more realistic. I guess mm "accuracy" comes from GIS data manipulation that uses
9 digit precison by default.
Posted by: Andreas Plesch Mar 12 2021, 05:47 PM
The track line itself still uses 6 decimal places precision, or 0.1 m accuracy, which seems much more realistic. I guess mm "accuracy" comes from GIS data manipulation that uses
9 digit precison by default.
The yaw_deg property is also changed to just yaw.
Here is my updated map animation:
https://bit.ly/PercyMAP
I noticed that the provided elevation is about 1m higher than the MOLA DEM elevation at the current waypoint. Perhaps it marks the rover body but the rover reference frame is supposed to originate at ground level.
[CORRECTION] I may have mixed up the way points. The MOLA and reported elevation are actually very close, at -2568.9m
Posted by: Greenish Mar 13 2021, 01:51 AM
Thanks for finding and posting this direct JSON link.
For those like me who like the data but aren't used to the tools for this format, I recently had the brilliant, if belated, idea to search for "JSON-to-CSV converter," and sure enough there are several easy ones (https://www.convertcsv.com/json-to-csv.htm). Stuff like thisis just easier for me to understand in a table (before it's plotted):
3_0 3 0 0 0.000 0.000 4354494.086 1093299.695 -2569.910 -4253.470 3391936.530 77.45088572 18.44462715 -1.182 -0.025 130.882 0.000 Site increment, no motion.
3_110 3 110 14 0.006 0.004 4354497.517 1093294.730 -2569.862 -4253.417 3391936.583 77.45094676 18.44454339 0.971 -0.267 -15.112 0.000 First localization!
3_386 3 386 15 0.043 0.027 4354502.424 1093329.801 -2569.935 -4253.583 3391936.417 77.45103403 18.44513505 1.683 -1.700 88.565 2.392 Used Mobility Report WID: 40151
3_578 3 578 16 0.070 0.044 4354528.468 1093338.387 -2569.287 -4252.973 3391937.027 77.45149727 18.44527990 -0.299 1.950 71.211 1.973 Used Mobility Report WID: 40161
3_770 3 770 20 0.091 0.057 4354548.640 1093330.590 -2568.930 -4252.597 3391937.403 77.45185605 18.44514836 0.966 0.966 127.838 1.165 Used Mobility Report WID: 40201
...I was thinking of asking if anyone could program this for the raw image metadata too... but now I can just get it on my own with a few clicks.
Posted by: Andreas Plesch Mar 13 2021, 10:08 PM
I am trying to figure out the easting and northing values.
The landing site in the geojson is at
4354494.086 1093299.695
The USGS 25cm HiRISE mosaic and 1m DEM geotiffs and metadata use this equirectangular projection:
PROJCRS["Equirectangular Mars 2000 Sphere IAU",BASEGEOGCRS["D_Mars_2000_Sphere",DATUM["Mars_2000_(Sphere)",ELLIPSOID["Mars_2000_Sphere_IAU",3396190,0,LENGTHUNIT["metre",1]],ID["ESRI",106971]],PRIMEM["Reference_Meridian",0,ANGLEUNIT["degree",0.0174532925199433,ID["EPSG",9122]]]],CONVERSION["Equidistant Cylindrical",METHOD["Equidistant Cylindrical",ID["EPSG",1028]],PARAMETER["Latitude of 1st standard parallel",0,ANGLEUNIT["degree",0.0174532925199433],ID["EPSG",8823]],PARAMETER["Longitude of natural origin",0,ANGLEUNIT["degree",0.0174532925199433],ID["EPSG",8802]],PARAMETER["False easting",0,LENGTHUNIT["metre",1],ID["EPSG",8806]],PARAMETER["False northing",0,LENGTHUNIT["metre",1],ID["EPSG",8807]]],CS[Cartesian,2],AXIS["easting",east,ORDER[1],LENGTHUNIT["metre",1,ID["EPSG",9001]]],AXIS["northing",north,ORDER[2],LENGTHUNIT["metre",1,ID["EPSG",9001]]]] - Projected
When I project the provided latitude/longitude coordinates with this equirectangular projection with QGIS/gdal I get:
4590877.824 1093299.695
The projected northing matches exactly the northing in the geojson but the easting is off by ca. 236 km.
My first idea would be that perhaps the provided easting is computed from a reference meridian other than 0 degrees.
Does anybody have an idea what the projection is that the provided easting refers to ?
[ 3396190 * PI * 2 / 360 * 4 = 237098.8
So a reference meridian at 4 degrees E would give easting numbers closer to the provided numbers. But that seems rather arbitrary. ]
Posted by: Andreas Plesch Mar 13 2021, 11:20 PM
https://pds-imaging.jpl.nasa.gov/data/msl/MSLPLC_1XXX/DOCUMENT/PLACES_PDS_SIS.PDF
section 3.9.2 has a discussion on easting which I think provides a start of an explanation:
" These “easting” meters at a given latitude are related to true meters at the equator by the simple formula:
map_meters = true_meters / cos(φ)
where φ is the planetocentric latitude. "
[ hey, one can use html entities in the forum ♥ https://www.w3schools.com/html/html_symbols.asp ]
It looks like the provided meters are true meters (at the equator) and the projected easting has map meters since:
4590298.31635 = 4354494.086 / cos(18.4446271 degrees)
This is getting closer to 4590877.824, with still ca. 580m of a difference.
The gdal computed easting assumes a sphere with a radius of 3396190 m. Perhaps the reported true meter easting takes into account a local radius because these are also listed in the geojson, in the radius field.
The gdal computed easting and northing is consistent with the simple formulas given in section 4.4.2.4:
" planetocentric_latitude: Latitude of the point, measured using a planetocentric system.
Planetocentric coordinates are measured as angles from the center of the planet. Latitude (φ_pc) is
computed from northing (x) using the formula:
φ_pc = x / Re • 180 / PI
where Re is the ellipsoid radius, or 3396190 meters.
longitude: Longitude of the point. Longitude is computed from easting (y) using the formula:
θ = y / Re • 180 / PI
"
[ This is good and so simple that I can probably directly plot the traverse geojson on my equirectangular basemap ].
Since the northing matches, Re is 3396190 m. In addition to the correction to true meters from map meters easting, something else seems to be done to the easting. But what ?
Posted by: markril Mar 14 2021, 05:13 AM
This is getting closer to 4590877.824, with still ca. 580m of a difference.
Solving for the latitude using the target easting we get:
18.46629998 = acos(4354494.086 / 4590877.824) degrees
Curiously, this number shows up as the center latitude of an orthographic projection in this metadata https://planetarymaps.usgs.gov/mosaic/mars2020_trn/HiRISE/JEZ_hirise_soc_007_orthoMosaic_25cm_Ortho_blend120.xml. The relevant snippet is this:
<mapprojn>Orthographic</mapprojn>
<equirect>
<stdparll>18.4663</stdparll>
<longcm>77.4298</longcm>
<feast>0.0</feast>
<fnorth>0.0</fnorth>
</equirect>
</mapproj>
The TIFF file this refers to is described on this https://astrogeology.usgs.gov/search/map/Mars/Mars2020/JEZ_hirise_soc_006_orthoMosaic_25cm_Eqc_latTs0_lon0_first as the Derived JPL Surface Operations Mosaic:
Thanks for bringing this up because it looks likes this may have solved a problem I've been working on, too.
Mark
Posted by: Andreas Plesch Mar 14 2021, 05:15 AM
Another way to look at it is to assume that the reported easting is from a equirectangular projection with a https://en.wikipedia.org/wiki/Equirectangular_projection#Definition not at the equator but close to the landing site. In fact, one can back out the standard latitude because the easting and the corresponding longitude are given:
arccos(4354494.086 / 4590877.824) is 18.4663 degrees for the standard latitude possibly used.
If this is the case all the waypoints should use the same standard latitude. Here is the table with the standard latitude computed for all waypoints:
sol easting northing lon lat Re easting at 0 lat. standard lat.
0 4354494.086 1093299.695 77.45088572 18.44462715 3396190 4590877.824 18.46629998
14 4354497.517 1093294.73 77.45094676 18.44454339 3396190 4590881.442 18.46630001
15 4354502.424 1093329.801 77.45103403 18.44513505 3396190 4590886.615 18.46629999
16 4354528.468 1093338.387 77.45149727 18.4452799 3396190 4590914.073 18.46630002
20 4354548.64 1093330.59 77.45185605 18.44514836 3396190 4590935.34 18.4663
And, in fact all waypoints do use the same standard latitude. The only question is why this particular latitude. Perhaps that was the original target. A little farther north, closer to the delta, would make sense.
The center of the https://mars.nasa.gov/mmgis-maps/M20/Layers/json/JEZ_TRNEllipse_190507_line.json seems very close.
The average of the ellipse latitudes is 18.46630439 (after not double counting the repeated start and end).
Close enough for me.
So I think the M20 localization uses an equirectangular projection with a standard latitude at 18.4663 degrees N. The reported easting is based on this projection.
[edit] Ah, thanks, Mark. That completely confirms it.
Posted by: Andreas Plesch Mar 14 2021, 09:03 PM
The TIFF file this refers to is described on this https://astrogeology.usgs.gov/search/map/Mars/Mars2020/JEZ_hirise_soc_006_orthoMosaic_25cm_Eqc_latTs0_lon0_first as the Derived JPL Surface Operations Mosaic:
Glad we arrived at the same conclusion (at the same time !). I am using the https://astrogeology.usgs.gov/search/map/Mars/Mars2020/JEZ_hirise_soc_006_orthoMosaic_25cm_Eqc_latTs0_lon0_first you linked to as my base map. Confusingly, the geotiff embedded projection does have 0 as the Latitude of the 1st standard parallel, somewhat contrary to the description which mentions 'centering' on the landing ellipse:
Unknown CRS: PROJCRS["Equirectangular Mars 2000 Sphere IAU",BASEGEOGCRS["D_Mars_2000_Sphere",DATUM["Mars_2000_(Sphere)",ELLIPSOID["Mars_2000_Sphere_IAU",3396190,0,LENGTHUNIT["metre",1]],ID["ESRI",106971]],PRIMEM["Reference_Meridian",0,ANGLEUNIT["degree",0.0174532925199433,ID["EPSG",9122]]]],CONVERSION["Equidistant Cylindrical",METHOD["Equidistant Cylindrical",ID["EPSG",1028]],PARAMETER["Latitude of 1st standard parallel",0,ANGLEUNIT["degree",0.0174532925199433],ID["EPSG",8823]],PARAMETER["Longitude of natural origin",0,ANGLEUNIT["degree",0.0174532925199433],ID["EPSG",8802]],PARAMETER["False easting",0,LENGTHUNIT["metre",1],ID["EPSG",8806]],PARAMETER["False northing",0,LENGTHUNIT["metre",1],ID["EPSG",8807]]],CS[Cartesian,2],AXIS["easting",east,ORDER[1],LENGTHUNIT["metre",1,ID["EPSG",9001]]],AXIS["northing",north,ORDER[2],LENGTHUNIT["metre",1,ID["EPSG",9001]]]] - Projected
And I do think the image data is supposed to be used with that 0 latitude projection because the https://astropedia.astrogeology.usgs.gov/download/Mars/Mars2020/ancillary/JEZ_hirise_soc_006_orthoMosaic_25cm_Eqc_latTs0_lon0_first.lbl and https://astropedia.astrogeology.usgs.gov/download/Mars/Mars2020/ancillary/JEZ_hirise_soc_006_orthoMosaic_25cm_Eqc_latTs0_lon0_first_pds3.lbl also do not specify a standard parallel away from the equator.
It would be possible to reproject (or gdalwarp) the mosaic to the off-equator equirectangular projection and that would yield a less distorted map more appropriate for the region. In effect, it would mean squeezing the x dimension by about 5.15%. But I do not think I am going to do that because it introduces some data loss compared to the existing mosaic.
Posted by: markril Mar 15 2021, 07:17 AM
There are two images referenced on that https://astrogeology.usgs.gov/search/map/Mars/Mars2020/JEZ_hirise_soc_006_orthoMosaic_25cm_Eqc_latTs0_lon0_first. The primary image and subject of that page is the equirectangular projection prepared by the USGS:
JEZ_hirise_soc_006_orthoMosaic_25cm_Eqc_latTs0_lon0_first.tif
I agree, the https://planetarymaps.usgs.gov/mosaic/mars2020_trn/HiRISE/JEZ_hirise_soc_006_orthoMosaic_25cm_Eqc_latTs0_lon0_first_pds3.lbl seems to indicate that the 0.25 meters/pixel applies to the equator:
TargetName = Mars
EquatorialRadius = 3396190.0 <meters>
PolarRadius = 3396190.0 <meters>
LatitudeType = Planetocentric
LongitudeDirection = PositiveEast
LongitudeDomain = 180
MinimumLatitude = 18.3067994496865651
MinimumLongitude = 77.2229330769714153
MaximumLatitude = 18.6693150068777456
MaximumLongitude = 77.5839640209350847
ProjectionName = Equirectangular
CenterLongitude = 0.0
CenterLatitude = 0.0
CenterLatitudeRadius = 3396190.0
UpperLeftCornerX = 4577366.0
UpperLeftCornerY = 1106618.0
PixelResolution = 0.25 <meters/pixel>
Scale = 237098.790093224874 <pixels/degree>
End_Group
The following relations hold:
UpperLeftCornerX = MinimumLongitude * Scale * PixelResolution
UpperLeftCornerY = MaximumLatitude * Scale * PixelResolution
Scale = EquatorialRadius (or PolarRadius or CenterLatitudeRadius) * 2 * Pi / PixelResolution / 360
So, UpperLeftCornerX appears to be an easting based on the equator and not what the JPL operations team is using in the https://mars.nasa.gov/mmgis-maps/M20/Layers/json/M20_waypoints.json feed. At our latitude of interest (~18.4663 degrees), the horizontal resolution becomes 0.25*cos(18.4663) = 0.237 meters/pixel. So the pixels aren't quite square. It seems desirable to use easting and northing "meters" that are close to equal where you'll be driving your rover so that's where this image comes in:
JEZ_hirise_soc_007_orthoMosaic_25cm_Ortho_blend120.tif
An https://en.wikipedia.org/wiki/Orthographic_map_projection centered on the target landing site (77.4298 Lon, 18.4663 Lat) where "meters" are nearly equal around the landing site. I suppose they chose orthographic projection (over equirectangular) because any distortion in "meters" as you move from the center of projection will apply to both easting and northing in a symmetrical manner instead of just one dimension as you would have with an equirectangular projection.
The second image seems to be superior from what I've seen, so in order to use it for Google Earth tiles, I'll have to resample it with something like bicubic interpolation to obtain an equirectangular projection with center latitude of 18.4663 degrees.
I'm sure there's already been a little squeezing (and stretching) here and there in order to get these projections from the original HiRISE images, so what's a little more?

Mark
Posted by: kymani76 Mar 15 2021, 02:36 PM
There is really no mystery here, only an age old geographical problem. Compromises need to be made in order to render spherical planetary surface onto a 2d surface.
First we need to see how HiRise images are produced. Camera images the surface of Mars while in orbit around the planet looking straight down, so images are really in orthographic (OR) projection. But as images cover very small part of spherical surface of the planet, it is possible to approximate it as a 2d picture in equirectangular (EQ) projection with central longitude and latitude near the center of the imaged area (in essence we treat this area as it would be flat). That's why different HiRise images come all with the same EQ projection, but varying central longitudes and latitudes. EQ projection also has true scale latitude defined, which means only at this latitude scale will be in true meters. On this map straight lines looking to be of the same length but located at different latitudes would have different lengths in reality. Also lines are that are always straight in EQ projection will be curved in reality (except at central long/lat point).
To get straight lines straight in reality as well as on the map you have to choose orthographic projection with central long/lat at the center of the area of interest. That's way Perseverance's HiRise mosaic used for driving comes in
OR projection with central long/lat at 77.4298/18.4663. This particular coordinate is at the center of HiRise mosaic as well as very near to a predicted landing spot. So what you get is a map with approximates very well the spherical surface as
a 2d Cartesian space. In essence you get x/y grid defined with parallel longitudes and latitudes. So when planning rover's traverse you can simply plot a straight line from point A to B and be sure the this line is also straight on the surface of Mars.
Pretty important when navigating a 2.2 billion dollar rover on Mars.
Coming back to geoJSON data and why it uses ER projection coordinates. Well OR projection really doesn't have a true scale, so if you want to measure a distance in meters you have to reproject it into ER with appropriate true scale latitude. Only then will your measurment be in true scale meters. Thats's why easting and northing in geoJSON file are given in ER projection with central long/lat at 77.4298/18.4663.
I hope this helps.
|
Mars in OR projection with central long/lat at 77.4298/18.4663. Note that extent of Perseverance's mosaic (yellow rectangle) is totally rectangular in this projection.
Posted by: Phil Stooke May 13 2021, 02:29 AM
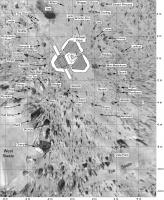
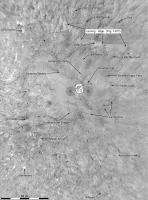
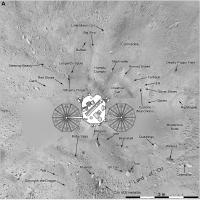
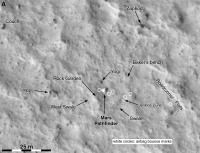
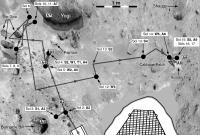
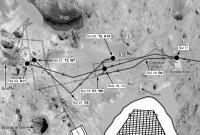
Here are some maps of the Pathfinder site. One overview and three detailing the traverse of Sojourner. Take a look at the maps of Sojourner's travels in any other source - journal articles and the mission website... there's something lacking. The only one that looks good is a big polar projection, but it's simplified. The 'A' boxes are APXS analysis sites.
Phil
|
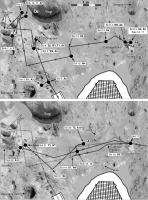
|
Posted by: Phil Stooke May 13 2021, 02:31 AM
And 2 more:
|
|
Phil
Posted by: Phil Stooke May 13 2021, 02:37 AM
And a last one - should have been first, really.
Phil
|
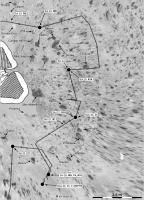
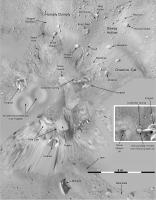
Posted by: Phil Stooke May 16 2021, 10:22 PM
Some Phoenix maps.
Phil
|
|
and a third one:
|
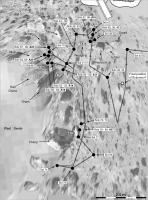
Posted by: Antdoghalo May 20 2021, 09:42 PM
Stookes Pathfinder HiRISE/Pano reprojection
|
|
Posted by: Antdoghalo May 23 2021, 03:19 AM
Separate images for first two Sojourner path maps.
|
|
Posted by: Phil Stooke Dec 2 2023, 06:14 PM
I have started posting some things on:
https://mastodon.social/@PhilStooke
Almost everything I put there will have been seen here first.
I am starting with a set of maps of Mars landing sites, beginning with Viking 1.
https://mastodon.social/@PhilStooke/111511806000535744
Phil
Posted by: kymani76 Dec 9 2023, 10:49 AM
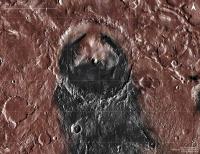
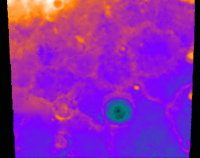
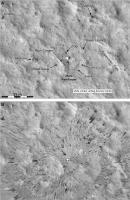
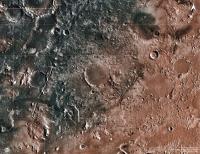
|
I recently noted that a new Mars Express global color map was made available (https://hrscteam.dlr.de/public/data/globalcolor.php).
I blended it with THEMIS global map, which resulted in this composite view of the Gale Crater. The contrast between "regular" surface and black sand dunes is really striking.
Posted by: kymani76 Dec 9 2023, 10:52 AM
|
The same for Jezero crater region. Both maps are at the same scale.
Posted by: Antdoghalo Dec 9 2023, 01:12 PM
It looks weird because Themis is mainly an infrared camera so its like a "multiwavelength" map
Powered by Invision Power Board (http://www.invisionboard.com)
© Invision Power Services (http://www.invisionpower.com)