Printable Version of Topic
Click here to view this topic in its original format
Unmanned Spaceflight.com _ MSL _ MSL data in the PDS and the Analyst's Notebook
Posted by: Phil Stooke Feb 27 2013, 07:22 PM
"February 27, 2013. MSL Release 1, part 1, Sols 0-89.
The first release of MSL data takes place in two parts.
Part 1, February 27, 2013, includes raw data products (EDRs) acquired on Sols 0 through 89, August 6 through November 5, 2012, for these instruments: APXS, ChemCam, DAN, Hazcam, Navcam, and REMS, along with SPICE data.
Part 2, March 20, 2013, will include the derived data products (RDRs) for Sols 0 though 89 for the APXS, ChemCam, DAN, Hazcam, Navcam, and REMS instruments, along with both the EDRs and RDRs for the CheMin and RAD instruments, and the RDRs for the SAM instrument.
Release 1 does not include data from the MAHLI, MARDI, or Mastcam instruments. These instrument teams have not yet delivered data products to PDS.
Some documents in the MSL archives are awaiting clearance by JPL Document Review and/or the JPL Import/Export Control Office. They will be posted online as soon as clearance has been received, and announced on this web site."
Phil
Posted by: Phil Stooke Feb 27 2013, 08:29 PM
"Mars Science Laboratory (MSL) #1 On HOLD by the MSL Project
February 26, 2013: The first MSL EDRs (Sols 0-89) for Hazcam and Navcam is pending. "
Still not quite there yet! - not in the planetary image atlas anyway. But at Geosciences, ChemCam images are in.
Phil
Posted by: renee Feb 28 2013, 12:03 AM
MSL Release 1 Announcement:
The NASA Planetary Data System announces the first release of data from the Mars Science Laboratory (MSL) mission, covering data acquired on Sol 0 through Sol 89, August 6 through November 5, 2012.
This release takes place in two parts. Part 1, February 27, 2013, is the release of raw data sets from the following instruments:
Alpha Particle X-ray Spectrometer (APXS)
Chemistry & Micro-Imaging (ChemCam)
Dynamic Albedo of Neutrons (DAN)
Hazard Avoidance Cameras (Hazcam)
Navigation Cameras (Navcam)
Rover Environmental Monitoring Station (REMS)
Spacecraft, Planet, Instrument, Pointing C-Matrix, and Event kernels (SPICE)
Part 2, March 20, 2013, will include derived data sets for the above instruments, along with these additional data sets:
Chemistry and Mineralogy (CheMin) raw and derived data
Radiation Assessment Detector (RAD) raw and derived data
Sample Analysis at Mars (SAM) derived data
Release 1 does not include data from the MAHLI, MARDI, or Mastcam instruments.
Links to all MSL data sets may be found on the PDS Geosciences Node web site http://pds-geosciences.wustl.edu/missions/msl/. The data may also be reached from the main PDS home page, http://pds.nasa.gov/. MSL data are archived at the PDS Atmospheres, Planetary Plasma Interactions (PPI), Geosciences, Imaging, and Navigation and Ancillary Information Facility (NAIF) Nodes.
PDS offers two services for searching the MSL archives:
The Planetary Image Atlas at the Imaging Node allows selection of MSL image data by specific search criteria.
http://pds-imaging.jpl.nasa.gov/search.
The MSL Analyst's Notebook at the Geosciences Node allows searching and downloading of all MSL data in the context of mission events.
http://an.rsl.wustl.edu/msl. The Analyst's Notebook will be available starting February 28, 2013.
Some documents in the MSL archives are awaiting clearance by JPL Document Review and/or the JPL Import/Export Control Office. They will be posted online as soon as clearance has been received, and announced on the web site http://pds-geosciences.wustl.edu/missions/msl.
To receive email announcements of future releases of MSL data, please sign up on the PDS Subscription Service at http://pds.jpl.nasa.gov/tools/subscription_service/top.cfm.
The PDS Team
Posted by: Phil Stooke Feb 28 2013, 12:49 AM
Yes, folks, now the nav and haz images are in the Planetary Image Atlas!
Phil
Posted by: jmknapp Mar 1 2013, 12:57 AM
The recent PDS release included some NAIF files for sols 0-89. Not sure how absolutely accurate they are yet, but here's an animation based on them, from sol 34, I think the first time the robotic arm was used extensively (MAHLI took some images from underneath the rover):
http://www.youtube.com/watch?v=-kxF6Fo-EOg
Posted by: elakdawalla Mar 1 2013, 01:06 AM
Oh that is cool. You can see them imaging the cal target and pointing APXS at its cal target toward the end, I think.
Posted by: Phil Stooke Mar 1 2013, 01:14 AM
Nice! And I see that the rock Jake Matijevic was originally called Musk Ox... I'm collecting some new feature names.
Phil
Posted by: fredk Mar 1 2013, 03:29 AM
Joe, could you compare an actual mahli image that shows some of the rover with a render from the model mahli at the corresponding time? I'm curious how accurate the rendered view of the rover will be. Of course you may see differences due to the optical distortions in the (real) mahli system.
Posted by: jmknapp Mar 1 2013, 12:17 PM
Well, I don't have a way as yet to automatically set up the animation software to show the view of a particular camera, but as a manual test take this MAHLI shot:
http://mars.jpl.nasa.gov/msl-raw-images/msss/00034/mhli/0034MH0067001000E1_DXXX.jpg 10SEP2012 01:36:28 UT.
Positioning the RA per the NAIF files at that moment gives this:
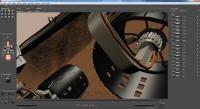
A wire frame sketch of the model "movie" camera is shown above, which I positioned by hand to more or less match the MAHLI orientation. Here's another angle:
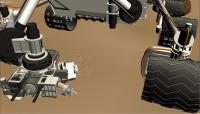
OK, so, drum roll, here's how the scene is rendered by that camera:
Not too far off! I used the MAHLI focal length of 21mm and f/9.8. The aspect ratio is different.
Posted by: fredk Mar 1 2013, 03:00 PM
Nice job! Did you spin the model wheels manually so the morse cutouts matched the real positions?
Posted by: djellison Mar 1 2013, 04:32 PM
So as of now, img2png + MSL Navcam IMG's = no joy.
I'd imagine Bjorn's already on it ![]()
Posted by: Airbag Mar 1 2013, 06:55 PM
I'm just lost in the flood of information available there; the Mission Manager and SOWG documents alone could keep my busy for a long time.
Question - is there a way to download (say) all the .LBL files for a specific instrument for a range of sols all at once instead of selecting them one by one manually?
Airbag
Posted by: elakdawalla Mar 1 2013, 07:59 PM
You can do it via FTP, right? http://geo.pds.nasa.gov/dataserv/anonftp.html
Posted by: Airbag Mar 1 2013, 08:25 PM
Well, only to some extent it seems - for instance, when I go to ftp://pds-geosciences.wustl.edu/msl/ (or ftp://geo.pds.nasa.gov/msl/) there are no Navcam entries there while they are available via the Analyst's Notebook. Am I looking in the wrong place?
Airbag
Posted by: elakdawalla Mar 1 2013, 08:30 PM
I usually don't use FTP; I download the INDEX.TAB file in the INDEX folder and use that info to build lists of things that I want that I then use wget to grab. I haven't tried this for the MSL data, but there's got to be a way.
Posted by: Airbag Mar 1 2013, 08:39 PM
An INDEX.TAB file would work (for instance I ftp://geo.pds.nasa.gov/msl/msl-m-apxs-2-edr-v1/mslapx_0xxx/index/one for APXS) , but there is no NAVCAM subdirectory at the MSL top level. I guess that data has not been added to the FTP area yet.
Airbag
Posted by: Greenish Mar 1 2013, 08:58 PM
Airbag
Not sure about LBL specifically but you can easily grab all or some of the data files for a specific instrument for a range of sols using the search tab. Enter the sols of interest, select the instrument (say navcam) and select the data types (e.g. EDR) if you only want certain data. Hit submit. Then you can use the checkboxes to add whole sols or expand the tree to add individual items to your cart. When you checkout you can get the whole thing zipped or ask for a webpage of links, which includes the data and LBL files separately. You can save all of those links or I know some download managers (i.e. DownloadThemAll or Flashgot) can then grab all the .LBL files. It also looks like in future it may provide an option for a FTP script to be generated.
I did see somewhere a wget option in a corner somewhere but haven't been able to find it again.
Posted by: kemcab2012 Mar 1 2013, 09:18 PM
Interesting. A quick look reveals that the headers on some of the NAVCAM .IMG files don't start with the standard LBLSIZE or PDS_VERSION_ID metadata labels like most VICAR/PDS formatted files do. These start with ODL_VERSION_ID, with LBLSIZE popping up 26k later in the file.
Looks like they http://pds.nasa.gov/tools/subscription_service/SS-20110509.shtml for this. I'll need to update my own software as well.
Posted by: Airbag Mar 1 2013, 09:34 PM
Ah yes, thanks, the http://pds-imaging.jpl.nasa.gov/search/search.html has exactly what I am looking for, and the wget script creation option lets me grep out just the .LBL files if needed later.
Posted by: Greenish Mar 1 2013, 10:27 PM
The MSL .IMG files do seem to be viewable with the gimp by installing the PDS plugin (http://registry.gimp.org/node/1627 or http://areo.info/gimp/).
Posted by: Airbag Mar 2 2013, 12:15 AM
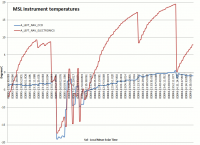
This is the kind of thing I was looking for (just out of, well, curiosity...); some sample engineering data. In this example, the NAVCAM left instrument and CCD temperatures at the time each image was taken, for a range of sols. No big surprises here - the more the instrument is used, the warmer it gets - but it (or at least the sensor) cools down very quickly again when not in use. As for any good CCD camera, the CCD temperature is kept as low as possible. It is interesting to see how much colder the instrument was later in the day on sol 45 as compared to the more typical early afternoon images.
The data came from the .LBL files associated with each NAVCAM EDS product. Well, it's a hobby!
Airbag
Posted by: JohnVV Mar 2 2013, 01:57 AM
Mind you if you use the wget option
the labels might NOT work
there is a known bug , some of the closing "end sections" are missing and some vicar data is included
-- NOT every one but a lot are affected --
downloading the zip file might be better for use in ISIS3
that is an ancient plugin for gimp2.2
you might want to use "gdal_translate " in GDAL or FWTools3
or Bjorn's "img2png"
the old gimp plugin outputs to a 8 bit INDEXED image
just like "nasaview"
Posted by: Greenish Mar 3 2013, 02:48 AM
I was careful to say you could see the images, not necessarily use them for anything special:)
Seriously, though, thanks for the heads-up. So far as the plugin, there is a recent version 2.8 file so it is at least kept up to the Gimp releases... And since img2png didn't work at all I thought some folks might find it useful in the interim. The images are at least not contrast stretched like the jpgs. Since the readme specifically doesn't mention the rovers, I was pleasantly surprised it worked at all.
I didn't know about the gdal tool, will check that out at some point.
Posted by: kwan3217 Mar 3 2013, 10:04 PM
The EDL spice kernels are not up yet. Perhaps those are the files that are held up in ITAR?
Bummer, that and MEDLI are the interesting things to me on this mission.
Posted by: Gerald Mar 8 2013, 07:43 PM
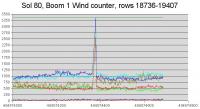
I wonder, whether these visualized sol 80 Boom 1 Wind counter data
based on http://atmos.nmsu.edu/PDS/data/mslrem_0001/DATA/SOL_00001_00089/SOL00080/RME_404548423ESE00800000000ACQ____M1.LBL and the associated TAB-File indicate a vortex event.
EDIT: I think, I've got it: There is a gap of 15 seconds of recording after row 19099 (timestamp 404574363), which I didn't notice before. So the peak will probably be an artifact.
Posted by: Phil Stooke Mar 10 2013, 07:25 PM
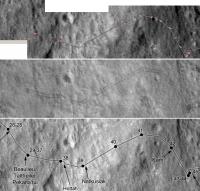
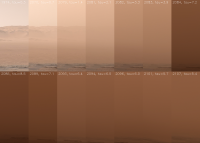
This is a comparison of the route map in the Analyst's Notebook (top, a set of screen shots) with the latest HiRISE image of tracks and my UMSF route map. My LPSC poster is a comparison like this for Spirit and Opportunity maps (to show the difference between localization using MOC, early in the mission, and HiRISE now). So I thought I would do this comparison with the new map in PDS.
Very interesting comparison. First, look at the right side. The rock Jake Matijevic can be seen in HiRISE and my map as a black dot (arrowed by the sol 45 marker at right edge, bottom map). On the PDS map it's offset to the north. Similarly a crater between sols 40 and 41 is offset to the north in the PDS map. Actually what's happening is, the PDS map has its traverse offset to the south a few meters relative to the HiRISE base. That persists along its whole length... except between sols 29 and 38. There, the PDS traverse is shifted north to exactly the right place, causing an offset at each end of that segment which clearly does not exist in the HiRISE tracks - it must be based on a different localization result.
(PS the similarity between my map and the HiRISE is not a coincidence, I edited my map to fit HiRISE)
Phil
Posted by: Gerald Mar 10 2013, 08:33 PM
Based on REMS data:
"REFERENCE_COORD_SYSTEM_INDEX = 3" in http://atmos.nmsu.edu/PDS/data/mslrem_0001/DATA/SOL_00001_00089/SOL00028/RME_399932153ESE00280000000ACQ____M1.LBL (subdirectory for Sol 28)
"REFERENCE_COORD_SYSTEM_INDEX = 4" in http://atmos.nmsu.edu/PDS/data/mslrem_0001/DATA/SOL_00001_00089/SOL00029/RME_400020927ESE00290000000ACQ____M1.LBL (subdirectory for Sol 29)
May be, the offset has something to do with the switch from Coord System 3 to 4.
Posted by: Phil Stooke Mar 10 2013, 10:04 PM
Yes, I expect so - the basic idea being that dead reckoning from the start of the previous coordinate system took them off track a bit, but then a new localization at the start of the new site coordinate system put them back where they should be. A new error crept in again later.
Phil
Posted by: Gerald Mar 10 2013, 10:12 PM
Next error near Sol 58? There seems to be the switch from Frame 4 to 5.
A second mere coincidence should be unlikely.
Posted by: Phil Stooke Mar 10 2013, 11:01 PM
No, the offset at sol 29 is 'corrected' by a second offset at sol 38, and after that the routes stay together pretty closely. There's just that one strange departure from the proper path. So it may have been caused initially by a change in coordinate systems, but most changes are fairly seamless.
Phil
Posted by: jmknapp Mar 20 2013, 07:13 PM
They released some more sol 0-89 data to the PDS today:
The NASA Planetary Data System announces Part 2 of the first release of data from the Mars Science Laboratory (MSL) mission, covering data acquired on Sol 0 through Sol 89, August 6 through November 5, 2012. Part 2 consists of derived data products. Release 1, Part 1, took place on February 27, 2013, and consisted of raw data products.
Part 2 consists of derived data sets from the following instruments:
Alpha Particle X-ray Spectrometer (APXS)
Chemistry and Mineralogy (CheMin)
Hazard Avoidance Cameras (Hazcam)
Navigation Cameras (Navcam)
Rover Environmental Monitoring Station (REMS)
Sample Analysis at Mars (SAM)
Release of the following data sets has been delayed. The data sets will be released as soon as they are made available to PDS.
Chemistry & Micro-Imaging (ChemCam) derived data
Chemistry and Mineralogy (CheMin) raw data
Dynamic Albedo of Neutrons (DAN) derived data
Radiation Assessment Detector (RAD) raw and derived data
Release 1 does not include data from the MAHLI, MARDI, or Mastcam instruments.
Links to all MSL data sets may be found on the PDS Geosciences Node web site http://pds-geosciences.wustl.edu/missions/msl/. The data may also be reached from the main PDS home page, http://pds.nasa.gov/. MSL data are archived at the PDS Atmospheres, Planetary Plasma Interactions (PPI), Geosciences, Imaging, and Navigation and Ancillary Information Facility (NAIF) Nodes.
PDS offers two services for searching the MSL archives:
The Planetary Image Atlas at the Imaging Node allows selection of MSL image data by specific search criteria.
http://pds-imaging.jpl.nasa.gov/search.
The MSL Analyst's Notebook at the Geosciences Node allows searching and downloading of all MSL data in the context of mission events.
http://an.rsl.wustl.edu/msl.
Some documents in the MSL archives are awaiting clearance by JPL Document Review and/or the JPL Import/Export Control Office. They will be posted online as soon as clearance has been received, and announced on the web site http://pds-geosciences.wustl.edu/missions/msl.
To receive email announcements of future releases of MSL data, please sign up on the PDS Subscription Service at http://pds.jpl.nasa.gov/tools/subscription_service/top.cfm.
The PDS Team
Mailto: pds_operator@jpl.nasa.gov
Posted by: PaulH51 Mar 21 2013, 12:10 PM
Thanks Joe,
I am going through the PDS learning curve, and learning a little, but still have a lot to learn. Can I ask if you have found any "REMS Ground Temperature" info in the PDS? I saw your posts in another thread regarding 'REMS Air Temperature' Thought it best to post here this time.
Posted by: Gerald Mar 21 2013, 12:22 PM
The ground temperature may most likely be provided by some of the thermopiles. With thermopiles you can measure temperature from a distance.
Posted by: jmknapp Mar 21 2013, 07:16 PM
Haven't looked at it closely myself yet, but I think the column definitions are in this file:
http://atmos.nmsu.edu/PDS/data/mslrem_1001/LABEL/ENVRDR1.FMT
...and as Gerald says, look for the thermopile data, such as:
NAME = "BRIGHTNESS_TEMP_A"
UNIT = "KELVIN"
FORMAT = "F7.2"
DESCRIPTION = "Brightness temperature of the GTS Thermopile A
(band 8-14 um)"
DATA_TYPE = ASCII_REAL
START_BYTE = 187
BYTES = 7
So that looks like it might even be calibrated to temperature (K), although it's brightness temperature which I gather is not the same as "real" ground temperature ("kinetic temperature") from this reference:
http://adsabs.harvard.edu/abs/2009EGUGA..11.4304A
Posted by: PaulH51 Mar 21 2013, 09:43 PM
Many thanks Gerald and Joe
Posted by: jmknapp Mar 25 2013, 04:47 PM
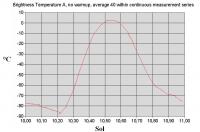
OK, here's a taste of some calibrated REMS data, the brightness temperature of ground temperature sensor A during sol 89:
The sensor looks at the infrared in the band 8-14 um. Looks pretty noisy, particularly at night. Note that brightness temperature is different than actual temperature. There must be some conversion formula?
The data file for that is:
http://atmos.nmsu.edu/PDS/data/mslrem_1001/DATA/SOL_00001_00089/SOL00089/RME_405347393RNV00890000000_______P1.TAB
Generally the files with the temperature readings have "RNV" in the file name.
The column definitions are here:
http://atmos.nmsu.edu/PDS/data/mslrem_1001/LABEL/ENVRDR1.FMT
Posted by: mcaplinger Mar 25 2013, 05:04 PM
You need to know, or assume, the emissivity of the surface in order to do that conversion. The brightness temperature is the temperature that a black body of the observed IR radiance would have.
Posted by: jmknapp Mar 25 2013, 05:40 PM
That would explain how it's a bit high.
According to the http://adsabs.harvard.edu/abs/2009EGUGA..11.4304A above:
...so the ground temperature reading is evidently a function of the thermopile A & B readings.
Posted by: Gerald Mar 26 2013, 11:52 AM
You'll be close to a solution by dividing the two values, because (by gray-assumption) the emissivity cancels out, see http://en.wikipedia.org/wiki/Pyrometer.
Then by applying Planck's, or for simplicity, Wien's law you may get close to the absolute temperature, see http://en.wikipedia.org/wiki/Wien_approximation.
My rough approximative ad-hoc idea is, to divide the values of Wien's (or better Planck's) law for the respective mean measured wavelengths for any given fixed temperature, and compare it with the measured quotient.
More accurately, Planck's curve for a fixed temperature multiplied by the sensivity of the respective thermopile (as a function of wavelength) has to be integrated over the wavelength.
The underlying principle is, that the quotient of the emissions of a black or grey body at two fixed wavelengths is temperature-dependent, and provided by Planck's law. Restricted to an appropriate temperature interval the quotient determines temperature uniquely.
Some adjustment might be necessary due to IR absorption by CO2 or dust coating. This may be a second step.
EDIT: By the two values I meant the sensor values as defined in http://atmos.nmsu.edu/PDS/data/mslrem_0001/LABEL/ACQ.FMT, B1_IR_OUT_2 and B1_IR_OUT_3, rover-induced fluctuations removed, and calibrated for power or radiance. It's not easy, nevertheless.
Posted by: jmknapp Mar 27 2013, 01:37 PM
I had a feeling calculus might be involved--a more direct route would be to get the paper submitted to the EGU by Gomez-Elvira et al, maybe they said exactly what they do.
Failing that, wouldn't the brightness temperatures in effect already be the result of integration or other analysis of the raw data? I.e., a sample at a particular time says that the ground looks like a gray body radiating at 265K for the A band (8-14 um) and 273K for the B band (16-20 um). Maybe the conversion to actual temperature from those data points isn't too involved.
P.S. I'm trying to track down this reference cited by the authors:
http://www.ncbi.nlm.nih.gov/pubmed/16642125
Posted by: mwolff Mar 27 2013, 02:11 PM
If you are after ground temperature, then the Zorzano reference will not really help. They are using measurements at two different temperatures (and two channels) to reduce the uncertainty associated with the instrument calibration. They are interested in the time series of temperature differences because this is the more important quantity in sensible heat flux characterization. As mentioned by M. Caplinger above, you need to know the emissivity of the material to get absolute temperature. The observed radiance is equal to the emissivity times the Planck function (ignoring atmospheric effects); calculus not needed if you believe your assessments of radiance and emissivity. The hard part, and the subject of the Zorzano paper, is dealing with getting radiance accurately from the instrument measurements. If you want to send me a message, I am sure that one can find you a copy of that paper.
Posted by: jmknapp Mar 27 2013, 04:11 PM
The thing is, the emissivity can't be determined a priori, right?
Thanks for the offer, but I was able to get a copy of the paper. By taking the measurements at two different temperatures (in practice, two different times of day) and two wavelength bands it looks like they were able to get within maybe 6K on the individual measurements and less than 1K for the difference.
Posted by: Gerald Mar 27 2013, 05:02 PM
The paper can be read online http://www.readcube.com/articles/10.3390/s101009211.
Now I understand better how the thermopiles work internally.
But I didn't find an answer, how to estimate the emissivity; there is mentioned an estimate of somewhere between 0.9 and 1.0, depending on the composition of the ground.
A 10% uncertainty means up to about 27K near 0°C.
The influence of reflected sun light is estimated to be below 0.5%.
As quotient of the Planck function for Kelvin temperature T, and two different wavelengths frequencies nu and mu, I got
(nu/mu)^3 x exp(4.8 x 10^-11 x [(mu-nu)/T] s K),
s = second, K = Kelvin, 4.8 x 10^-11 is Planck's constant h divided by Boltzmann's constant k.
(no errors assumed)
This avoids emissivity by cancelling out, if it is assumed to be the same for both wavelength frequency bands.
By taking 11 um for mean wavelength thermopile A and 18 um for mean wavelength thermopile B, one could try to avoid calculus in a first attempt.
Using the brightness temperatures instead of the radiance sounds good, especially because they will already be calibrated. I'll need to think a bit, how to do it exactly.
EDIT: The above formula just shows, how emissivity cancels out, but to be useful, integrals of the Planck function over the respective wavelengths have to be divided, with the same cancellation effect. Hard to avoid calculus or a numerical solution at the end.
With the very rough assumptions and the formula above, and without calculus, I get
T = 509 K / ln (0.228 q), with q = I(18 um) / I(11 um).
Still to solve is, how to calculate I(18 um) and I(11 um) from the brightness temperatures.
P.S.: In the meanwhile I found the calculus version http://contrails.iit.edu/DigitalCollection/1962/AEDCTDR62-174.pdf. (The paper uses the wavelength version of Planck's law.)
Posted by: mwolff Mar 28 2013, 03:14 PM
Not in the way you are suggesting. With wavelength resolution and broad enough coverage, IR remote sensing has "exploited" the Christiansen frequency to have a region where the emissivity was ~1. You are probably aware of the TES products, but just in case:
(http://tes.asu.edu/products/). This approach is much more applicable from orbit, unfortunately.
Posted by: jmknapp Mar 28 2013, 11:59 PM
Just going by some comments in the Zorzano paper.
All the geometrical dependencies cancel out, but any wavelength-dependent factor remains. (For instance, the medium absorption, sensor response, and target emissivity may differ from one wavelength to the other.)
Also, they say regarding the Planck equation:
The user must know the emissivity to get the correct temperature value; thus this technique is not useful to explore unknown targets. In ratio pyrometry intensities are measured simultaneously at two different wavelengths and divided. The resulting representative equation is solved for temperature assuming that the spectral emissivities in both ranges are equal and are canceled in the division. This method works only if the emissivity is the same at both wavelengths, but, again, it is not useful for a general case.
They don't talk about Christiansen frquency but that sounds interesting. Thanks for the link to the TES maps.
Posted by: Gerald Mar 29 2013, 02:42 PM
Planck's function isn't linear, and it's dependent of the absolute temperature. So it should be possible to infere the absolute temperature from the brightness temperatures at two known wavelengths and two different temperatures...
Under ideal conditions, in theory.
Before doing theory in detail, I first checked the data to find out, whether it can work in practice.
The intermediate answer is: Not in a straightforward way.
Emissivity seems to change with time, and in a different way for the two frequency bands A and B.
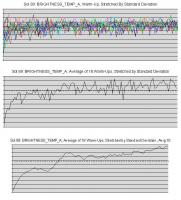
The first reason I could isolate is warm-up. Here some statistical analysis of 18 warm-ups on sol 89 for brightness temperature A, based on http://atmos.nmsu.edu/PDS/data/mslrem_1001/DATA/SOL_00001_00089/SOL00089/RME_405347393RNV00890000000_______P1.TAB:
The first diagram shows brightness temperature A for the first 100 seconds of 18 warm-ups, adjusted by average and stretched by respective standard deviations.
The second diagram averages over these 18 curves.
The third diagram smoothes the latter curve by averaging over a window of 10 seconds.
It shows a significant average increase of brightness temperature A during warm-up.
So a first step to get better data, will be to apply the last column (column 63) of the referenced table, indicating warm-up, not just to pressure data as described http://atmos.nmsu.edu/PDS/data/mslrem_1001/LABEL/ENVRDR1.FMT, but also to brightness temperatures.
EDIT: Some number-crunching later: Radiance at 250K and 11um seems to be much less (about factor 5) sensitive to emissivity near 1 than to absolute temperature (use Planck function with 250K at 11um as brightness temperature, and divide it by the value at 255K as absolute temperature; the result is the corresponding emissivity). So an emissivity of 0.9 will lead to an absolute temperature 5K above brightness temperature (near 250K). I overestimated emissivity in the beginning. Although I didn't yet investigate, how the emissivity quotient influences measurement of absolute temperature by dividing radiances of two wavelength bands (two-colour pyrometer).
Posted by: Gerald Mar 30 2013, 11:57 AM
Here the simplified theoretical principle for the two-colour pyrometer to calculate absolute temperature and the emissivities at two wavelengths from brightness temperatures, as far as I could infere it from Planck's law:
Input data: Take the (measured) brightness temperatures Tb_11 and Tb_18 at two frequencies nu_11 = c/11um and nu_18 = c/18um.
Algorithm:
Apply Planck's function to retrieve measured radiances I_11 := I(nu_11, Tb_11) and I_18 := I(nu_18, Tb_18).
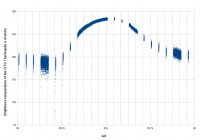
The graph of the according Planck functions is shown in the left of the two diagrams:
Now start an iteration with initial emissivities E_11 = E_18 = 1:
Calculate a modified radiance quotient by Q := (I_11 / E_11) / (I_18 / E_18).
Calculate absolute temperature T_abs := T_abs(Q) for a given radiance quotient Q by applying the inverse function of the quotient I(nu_11,T)/I(nu_18,T) of the Planck functions (restricted to an appropriate temperature interval).
The graph of I(nu_11,T)/I(nu_18,T) is shown in the right of the two diagrams above.
Apply the Planck function to T_abs, to get the black body radiances I(nu_11, T_abs) and I(nu_18, T_abs) at T_abs for nu_11 and nu_18.
Calculate E_11 := I_11/I(nu_11, T_abs) and E_18 := I_18/I(nu_18, T_abs) to get better approximatives for the emissivities.
Repeat the iteration until T_abs changes less than a given epsilon; abort with an error, if it doesn't converge after an upper bound of iterations.
If the iteration converges, we get absolute temperature, and emissivities at both wavelengths.
Posted by: jmknapp Apr 1 2013, 03:11 PM
Have you tried this on the time series yet? In one of the press conferences they had a chart of ground temperature vs. time that could be used as a rough check. Another issue would be how best to deal with the noisy raw data.
On the "warm up" effect--what does that refer to exactly? Like when the readings are taken after an idle time of an hour or so? Looks like they normally take readings every second for a few minutes every hour, with occasional longer stretches.
Posted by: Gerald Apr 1 2013, 08:39 PM
I'll answer the easy questions first:
Most of the noise can be averaged away by appropriate low-pass filters, if it is purely statistical, because temperature changes are slow; the simplest way to do it, is just averaging over a few dozens of samples; a more advanced way is using appropriate regression curves.
Example for simple averaging over 40 samples:
Again based on http://atmos.nmsu.edu/PDS/data/mslrem_1001/DATA/SOL_00001_00089/SOL00089/RME_405347393RNV00890000000_______P1.TAB.
About warm-up I know just that little info from the http://atmos.nmsu.edu/PDS/data/mslrem_1001/LABEL/ENVRDR1.FMT; it referes to pressure data:
COLUMN_NUMBER = 63
NAME = "PS_CONFIDENCE_LEVEL"
DESCRIPTION = "String representing the confidence level for the
pressure sensor; 0 = bad; 1 = good;
- Byte 0: Warm up effect (only for barocap 1)
0 = warm up effect; 1 = no warm up effect;
- Byte 1: Shadow effect; 0 = shadow effect;
1 = no shadow effect;"
DATA_TYPE = CHARACTER
START_BYTE = 568
BYTES = 8
END_OBJECT = COLUMN
Warm-up seems to take 180 seconds at the beginning of each series of measurements, at least on sol 89.
Posted by: Gerald Apr 2 2013, 10:45 AM
The simplified answer is: No, not yet, but a good idea for a better calibration.
A little more detailed: I also looked at the UV data. They are less noisy. I tried to get a 5-point absorption spectrum of atmospheric trace gases, that form or degrade after sunrise. For this I had to do a very detailed analysis. Doing this, I also found a jiggering caused by truncation of numeric values, and indications for superposed sinus oscillations with a period of about 300 to 350 seconds of unknown origin, might be due to my way of data analysis, may be due to data analysis done by the REMS team, or due to technical properties of the sensors, like a combination of inductivity and capacity.
Similar systematic errors may also occur for brightness temperature data. Accurate results for absoute temperatures can only be obtained, after those systematic effects are annihilated. Therefore I was focussed on that.
The only thing I had been doing, was dividing the Sol 80 EDR raw thermopile A/B data to see, whether they can be used as two-band pyrometer data, and it looked good, but calibration wasn't available to me.
It will take me a while to elaborate things in more detail.
Posted by: Gerald Apr 3 2013, 11:53 AM
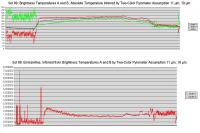
Here the sol 89 results, based on the two-color pyrometer algorithm described above, and http://atmos.nmsu.edu/PDS/data/mslrem_1001/DATA/SOL_00001_00089/SOL00089/RME_405347393RNV00890000000_______P1.TAB, without correction of systematic errors, no bugs assumed:
The green curve in the top diagram describes the inferred absolute Kelvin temperature by record (not by time), averaged (all weights set to 1) over 40 samples.
Absolute temperature was restricted to a range between 100 and 400K before averaging.
The bottom diagram describes the inferred emissivities, also averaged over 40 samples.
Emissivities were restricted to a range between 1e-20 and 100 before averaging.
The algorithm leaves one degree of freedom, e.g. the emissivity quotient. It is set to 1 in this run, meaning grey body assumed.
The absolute emissivity values look rather confusing to me, because I expected them to be between 0.9 and 1.0, and constant over time.
On the other hand, absolute temperature values look rather reasonable for less noisy regions (sufficiently high brightness temperatures).
Any of my attempts to get more reasonable-looking emissivities by adjusting emissivity quotients, absolute value of one of the emissivities, or wavelengths failed,
because other values became less reasonable.
Some calibration of the absolute temperature is possible by adjusting the difference of the wavelengths.
Posted by: Gerald Apr 3 2013, 11:37 PM
The best approximation of the chart of the press conference I could get, was just using Brightness Temperature A of http://atmos.nmsu.edu/PDS/data/mslrem_1001/DATA/SOL_00001_00089/SOL00010/RME_398334213RNV00100000000_______P1.TAB, discarding 180s warm-up at the beginning of each measurement, and averaging:
Compare it with http://photojournal.jpl.nasa.gov/jpeg/PIA16081.jpg.
Posted by: PaulH51 Apr 11 2013, 03:57 AM
Gentlemen,
Not sure if you are aware, but the Spanish REMS team (Ashima Research) have "processed" the 1st 90 days of the REMS data using the public NASA PDS data sets.
Their page provides NetCDF versions of the first 90 sols of REMS measurements created from data available in public PDS archive as of March 20th, 2013. Each file is a direct conversion from the PDS archive of the corresponding file type (except for the ADR files, which is now split into two files containing the correction and geometry data, respectively. 'UNK' data values are converted to masked data, -9e36 for floating point, -2**15 for integer.
Each variable in the PDS dataset is converted to a NetCDF variable depending on the type stored in the PDS label .CHARACTER variables (strings) are converted to character arrays, ASCII_INTEGER to 32 bit integers, ASCII_REAL to 32 bit floats. In addition a "Time" dimension is added by dividing the TIMESTAMP data by 86400 to give the number of days since noon January 1, 2000. The Local Mean Solar Time (LMST) stored in the PDS tables is stored as a 18 character string, and split into sol, hour, minute, and second, with the latter containing the milliseconds component. Where available, the unit and description fields for each column have been converted to NetCDF variable attributes.
I hope that this will assist in resolving some of the issues you have encountered, but will no doubt raise further questions and additional debate ![]()
LINK to page containing the document download links : http://www.marsclimatecenter.com/rems.html
LINK to Blog post that alerted me of this data : http://marsweather.com/first-90-sols-of-rems-data-released-netcdf-processed-versions
Posted by: Gerald Apr 11 2013, 10:15 AM
Thanks! This may help more people to access the PDS data, and contribute to the debate.
I personally have been learning how to work with PDS data directly, and how to read and process them with spreadsheet or self-written software.
I think, the underlying question is, how to interprete the REMS data correctly. Several of those questions have been answered during the recent EGU conference, e.g. the origin of the UV oscillations I mentioned before; they seem to be attributed to http://en.wikipedia.org/wiki/Gravity_wave, not to systematic errors as I've been suspecting as likely, surprising news (to me)! Or rover movements leading to changes of the measured area, less surprising, but important to consider.
Difficult to understand are Brightness Temperature B data; jumps in the time series of e.g. UV data still have to be explained explicitely, afaik, most likely recalibrations, imho.
Posted by: Gerald Apr 11 2013, 12:05 PM
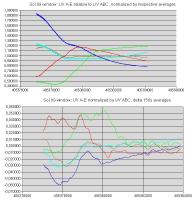
Here one of the charts that shows UV oscillations, which I was assigning to my lack of appropriate data analysis:
It's still based on http://atmos.nmsu.edu/PDS/data/mslrem_1001/DATA/SOL_00001_00089/SOL00089/RME_405347393RNV00890000000_______P1.TAB.
The first diagram describes each of the UV curves normalized by its average and divided by the UV ABC value.
The second diagram contains delta curves, obtained by averaging values of 150 seconds and subtracting this from the average of the next 150 seconds of the first diagram.
My original intention was to find a shift of absorption for different UV bands, that might indicate a short-term change of composition of the Martian atmosphere.
(Btw.: A shift between the red curve (UVA) and the green curve (UVB) - the two steeply ascending curves in the first diagram - looks obvious.)
The fine jiggering is likely due to numeric errors.
The next-longer oscillations have been the mystery. Can anyone else duplicate similar results? Are they due to errors or due to real physical processes like gravity waves?
Posted by: PaulH51 Apr 11 2013, 01:17 PM
I was sort of hoping that the "Processed Data" would have provided more insight to the well documented issues you and Joe have been debating, I have been following your discussion closely, sadly I do not have the knowledge to contribute. However, I have been learning much as it progresses... So lets hope the provision of the "Processed" REMS data does bring more people into this debate.
Separately I was also hoping that the chart detailing the ground temperature (min / max) for the first 200 sols released at that EGU conference would have helped you and Joe to test / prove some of your theories / assumptions re the temperature of a target by understanding the brightness temperatures.
I will continue to monitor this debate and hopefully learn a lot more along the way...
Thanks
Posted by: Gerald Apr 11 2013, 03:46 PM
Thanks for your interest!
There are ways to go deeper into analysis.
First: The emissivity values obtained thus far are most likely nonsensical.
During the conference they told, that kinetic temperature should be at most three Kelvin above brightness temperature. That's exactly my opinion. And it means, that emissivities for both IR wavelength bands should be between 0.9 and 1.0, and rather similar to each other, as stated earlier. Taken this as a basis we get a contradiction to the results above. The logical consequence is, that at least one of the assumptions was wrong.
One assumption was a two-color assumption instead of a two-band assumption in order to avoid calculus.
An other (implicite) assumption was, that noisy temperature data are allowed to be averaged to get the actual mean temperature; this is valid only for symmetric noise distribution.
Both assumptions will most likely to be replaced by more appropriate ones. Dropping the first one might lead to a spectrum combined of the spectra of the two IR sensors and the wavelength-dependent albedo/emissivity properties of the soil.
Dropping the second one may lead to a function, which transforms http://en.wikipedia.org/wiki/Gaussian_noise to the actual noise. The idea to get this function may be the calculation of the http://en.wikipedia.org/wiki/Moment_(mathematics) of the noise distribution, and infer from this the first few http://en.wikipedia.org/wiki/Taylor_series of the transformation function; I'll have to check, whether it works in this case. The result may then be used to average appropriately.
There will remain rover- and sun-induced effects that have to be isolated.
I'll explain details based on actual data, as soon as I succeed with one step. It's far from easy, and I've other jobs as well, so it may take a little time.
Everyone is invited to contribute improved solutions.
Posted by: Gerald Apr 15 2013, 11:17 AM
A small step towards a better assessment of Brightness Temperature B:
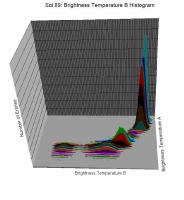
Take a (cartesian) coordinate system with two axes, one for Brightness Temperature A, one for Brightness Temperature B.
Now take http://atmos.nmsu.edu/PDS/data/mslrem_1001/DATA/SOL_00001_00089/SOL00089/RME_405347393RNV00890000000_______P1.TAB and add a point for each record of the data at the respective (Brightness Temperature A / Brightness Temperature B ) position.
Tile the coordiante system parallel to the axes. Count the points in each rectangle and take that count as the respective position on a third axes.
The result is a sequence of histograms. They may be drawn in the following way as "slices":
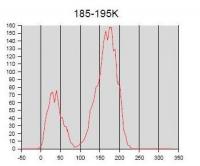
Looking just at one such "slice" (for a fixed Brightness Temperature A interval) at a time, and repeating this for the first 20 slices may result in an animated gif like this one, as a different way to represent the same data:
http://makeagif.com/DNbMcC
The headline indicates the considered Brightness Temperature A interval. The horizontal axis describes Brightness Temperature B. The vertical axis shows the number of entries near the respective Brightness Temperature B.
(I allowed neighbouring slices to overlap.)
The diagrams show clearly, that for low Brightness Temperature A there are two peaks for Brightness Temperature B. That's not at all a Gaussian distribution. So the concern about averaging correctly is justified based on actual data.
Posted by: Gerald Apr 16 2013, 03:00 PM
The official statement regarding the noise of thermopiles B and C according to the PDS file http://atmos.nmsu.edu/PDS/data/mslrem_1001/CATALOG/REMS_ENVRDR_DS.CAT is
I'm not yet quite at that point, because the noise seems to be structured; it might be possible - besides appropriate averaging - to exploit this structure by analysing a sufficiently large set of data.
Examples:
1. The double peak of the Brightness Temperature B noise distribution seems to indicate temperatures below 200K. Dividing the areas of the two peaks may lead to a temperature estimate.
2. http://en.wikipedia.org/wiki/Standard_deviation and https://en.wikipedia.org/wiki/Skewness of the noise distribution seem to be correlated to temperature.
For all REMS RDR data:
Posted by: Gerald Apr 17 2013, 09:57 AM
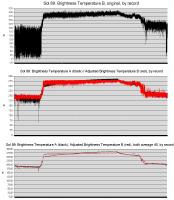
Here a regression polyline (consisting of 20 Kelvin line fragments) using a least squares method for Sol 89 Brightness Temperature B vs. Brightness Temperature A:
It doesn't fully exploit all statistical properties, but it may be useful from a practical point of view as a map from Brightness Temperature B data to an adjusted value comparable to Brightness Temperature A:
The first diagram shows the Sol 89 Brightness Temperature B, as provided by http://atmos.nmsu.edu/PDS/data/mslrem_1001/DATA/SOL_00001_00089/SOL00089/RME_405347393RNV00890000000_______P1.TAB.
The second plot shows the adjusted B data (in red) together with A data (in black).
The third diagram shows the two Brightness Temperatures averaged over a 40 record window, respectively. Averaging adjusted B-temperatures should be sufficiently appropriate.
EDIT: Replaced graphics after fixing inaccuracies of the least squares algorithm.
Posted by: Gerald Apr 20 2013, 04:54 PM
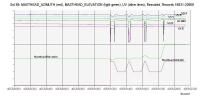
This diagram shows qualitatively, how REMS UV RDR data are influenced by Masthead movements:
Data are rescaled to fit into one diagram.
Sol 89 Masthead movements can be found in http://atmos.nmsu.edu/PDS/data/mslrem_1001/DATA/SOL_00001_00089/SOL00089/RME_405347393ADR00890000000_______P1.TAB, explained in http://atmos.nmsu.edu/PDS/data/mslrem_1001/LABEL/ADR_GEOM1.FMT.
UV data are contained in http://atmos.nmsu.edu/PDS/data/mslrem_1001/DATA/SOL_00001_00089/SOL00089/RME_405347393RNV00890000000_______P1.TAB as temperature data. They are explained in http://atmos.nmsu.edu/PDS/data/mslrem_1001/LABEL/ENVRDR1.FMT.
So, when analyzing UV data, Masthead movements can be used as a filter to skip data invalidated by those movements.
Posted by: Gerald Apr 24 2013, 09:07 AM
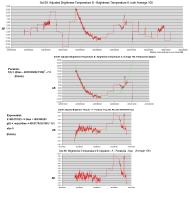
There are ways to further reduce the discrepancy between Sol 89 Brightness Temperature A and B by applying time-dependent calibrations:
Take the central part of the Sol 89 time series of the adjusted version of Brightness Temperature B, average it by a window of 100 records, and subtract Brightness Temperature A, averaged in the same way. The result shows the remaining discrepancy of the two temperature series. The goal is, to reduce this discrepancy to noise by applying simple adjustments.
The following two calibration steps lead to an improved consistency:
Step one: Subtract an appropriate biquadratic parabola for a time interval.
Step two: Subtract an appropriate exponential function for a time interval:
The applied functions aren't the best possible, but they may be sufficient to show the desired effect.
Discussion: A quadratic parabola instead of a biquadratic one didn't work. But using squared sine or cosine instead of the parabola may yield similar good results.
The exponential function is adjusted to the averaging window of 100 records; for other averaging windows either its parameters need to be adjusted to the way of averaging, or an appropriate exponential function itself has to be averaged over the window.
Interpretation: The http://en.wikipedia.org/wiki/Stefan%E2%80%93Boltzmann_law is a temperature-related physical law that contains a 4th power. There might be a connection to the biquadratic parabola.
http://en.wikipedia.org/wiki/Newton%27s_law_of_cooling#Newton.27s_law_of_cooling follows an exponential law. There might take place a http://en.wikipedia.org/wiki/Heat_transfer, which explains the exponential function.
At the right wing of the central part of the Sol 89 Brightness B time series there are still discrepancies, which need to be explained in a different way. I didn't yet find an evident coincidence with other Sol 89 causes, like masthead movements applicable to UV.
Posted by: Gerald Apr 27 2013, 03:50 PM
The http://atmos.nmsu.edu/PDS/data/mslrem_1001/DATA/SOL_00001_00089/ don't comprise the same observation period each Sol.
So, here a comparison of 3000 seconds of Sol 82 with according 3000 seconds of Sol 89:
The Masthead wasn't in motion, and up to 0.01 degrees at the same pointing during both observation periods:
MASTHEAD_AZIMUTH: -179,00 degrees, MASTHEAD_ELEVATION: 43,00 (Sol 82) resp. 43,01 (Sol 89) degrees.
SOLAR_AZIMUTH and SOLAR_ELEVATION, relative to the rover coordinate system, were the only obviously changing parameters.
This is a hint, that the displaced peeks (Sol 82: 15:29 - 15:41 LMST, Sol 89: 15:43 - 15:52 LMST) should have been induced by the sun position relative to the rover.
The peak isn't there (14:00 - 16:00 LMST) in Sol 77 REMS RDR data. At that Sol the Masthead was at a different pointing. This indicates, that the peak was caused by the shadow of the Masthead.
At Sol 72 the peak occured (14:14 - 14:20 LMST), with Masthead pointing the same as Sol 82.
May be, Joe will be able to add more evidence by looking from Boom 1 towards the sun in a 3d simulation.
I didn't find any further obvious kind of systematic discrepancy between Sol 89 Brightness Temperatures A and B.
Posted by: Gerald Apr 28 2013, 05:49 PM
A summarized list of ChemCam targets of the first 90 sols, calibration targets excluded: msl_ccam_obs_targets_noCal_Sols_10_88.txt ( 1K )
: 813
It consists of target/sol-pairs in a syntax usual for csv files; it's an excerpt of the file msl_ccam_obs.csv in http://pds-geosciences.wustl.edu/msl/msl-m-chemcam-libs-4_5-rdr-v1/mslccm_1xxx/document/.
Images of targets and of spectra can be found in http://pds-geosciences.wustl.edu/msl/msl-m-chemcam-libs-4_5-rdr-v1/mslccm_1xxx/browse/.
Posted by: Gerald Apr 29 2013, 10:17 AM
This is a "blink" gif between http://mars.jpl.nasa.gov/msl-raw-images/proj/msl/redops/ods/surface/sol/00088/opgs/edr/ccam/CR0_405303566EDR_F0050104CCAM01088M_.JPG and its processed PDS version, converted from a tif in http://pds-geosciences.wustl.edu/msl/msl-m-chemcam-libs-4_5-rdr-v1/mslccm_1xxx/data/sol00088/: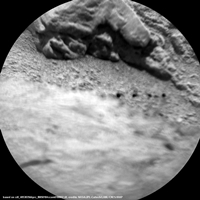
http://makeagif.com/i/ciDLwA.
Posted by: Gerald Jun 10 2013, 04:28 PM
A new summarized list of ChemCam targets, first 180 sols; calibration target, sky and drill head observations have been removed: msl_ccam_observations_Sol_Target_TargetType_summary__sols_10_to_176.txt ( 3.52K )
: 770
This time it consists of target/target type/sol triples, again as comma separated textfile, ready for spreadsheet import.
It's again an excerpt of the file msl_ccam_obs.csv in http://pds-geosciences.wustl.edu/msl/msl-m-chemcam-libs-4_5-rdr-v1/mslccm_1xxx/document/, the syntax of which has been extended a bit. This makes it easier to filter for target types.
Posted by: Phil Stooke Jun 10 2013, 05:07 PM
"MAHLI, MARDI, and Mastcam data are still undergoing PDS peer review by the PDS Imaging Node. The data are in lien resolution. When the major liens have been resolved the data will be posted on the Imaging Node web site (link below)."
You'll have to wait a wee bit longer for these goodies, however.
Phil
Posted by: mcaplinger Jun 11 2013, 02:04 AM
From http://pds-imaging.jpl.nasa.gov/ "The Imaging Node is pleased to announce the release of Mastcam, MAHLI, and MARDI EDRs and RDRs for Sols 0-179."
http://pds-imaging.jpl.nasa.gov/data/msl/MSLMST_0001/DOCUMENT/MSL_MMM_EDR_RDR_DPSIS.PDF would be a good document to read first.
Posted by: mcaplinger Jun 11 2013, 04:24 AM
BTW, the simplest way to use the archive products would be to stick with the EDRs, which for all JPEG compressed images (the vast majority) just consist of the JPEG data as we received it from Mars, with a simple header containing critical metadata at the beginning. I'd use only that metadata to get the SCLK, exposure time, filter, and other image parameters (ignoring the detached label), and continue to use the SPICE data for all the pointing information. IMHO getting the other metadata from the MMM archive products isn't going to be any better than using SPICE, but will likely be harder, especially if you've already written SPICE code.
Depending on what you're trying to do, doing your own processing might be as easy as using the RDRs, but that's a determination you have to make for yourself.
All of the information we use to make RDRs should be on the volumes.
Posted by: CosmicRocker Jun 11 2013, 05:33 AM
Phil: What does that mean?
Posted by: mcaplinger Jun 11 2013, 05:54 AM
It's legal jargon that PDS uses (inappropriately, IMHO) to indicate that there are issues associated with the dataset that they are awaiting correction of. In this instance I think these were all addressed in the volume errata files. Since they put the datasets online it doesn't really matter.
Posted by: Ant103 Jun 11 2013, 12:41 PM
Yay ! Finally the Mastcam and MaHLI images released in the PDS ![]() .
.
BUT, I have a big problem now. I'm using ImageJ and the PDS Reader plugin to open the IMG files in order to convert them into png files. This works for MER files, and Phoenix files. But with MSL, no. I have a message saying me : "This doesn't appear to be a PDS file". So, I do not know what else to do, because I'm on Mac OS 10.5, and there is no support from developpers for this -only 6 years old- OS. Many years ago, I tried a Gimp plugin to open IMG files, it did worked on OS 10.3 (and also Windows), but not on OS 10.5. For IMG2PNG (developped by Björn Jonsson), I can forget it, this is an executable, and I will not run any virtual machine in order to run it (by guessing it's even work). And dual boot, no, be serious! (I don't even have the space on my hard drive to do that, and the Windows installer).
Upgrade to OS 10.7 is not in my projects for now. I will certainly upgrade to OS 10.6 because I just want to run the latest versions of both Gimp, Blender, Inkscape and Hugin.
So, what can I do to open these precious MSL IMG files ?
Posted by: mcaplinger Jun 11 2013, 01:37 PM
The only program these were tested with, AFAIK, was NASAView: http://pds.jpl.nasa.gov/tools/release/software_download.cfm
I had nothing to do with the software development, but I'll try to look at this when I get a chance. But any solution I come up with will likely be based on the Python Imaging Library.
Posted by: mcaplinger Jun 11 2013, 04:13 PM
These files have detached labels; the IMG file has no label information. I don't know how the ImageJ plugin works, but possibly you need to open the LBL file rather than the image file?
For example, I just looked at http://pds-imaging.jpl.nasa.gov/data/msl/MSLMHL_0002/DATA/RDR/SURFACE/0085/0085MH0001130000100959E02_DRCL.IMG and LBL and this is a normal, 8-bit, band sequential RGB image with 1646 samples and 1198 rows (don't ask me where those image dimensions came from, something to do with removing some of the dark pixel columns or something? I had nothing to do with it
Posted by: Ant103 Jun 11 2013, 11:16 PM
This is weird. I can't open also Navcam IMG files with my plugin. But I thought it was the same Navcam as on MER. And so they could be open the same way. Can't tell what seems to be the problem…
Posted by: mcaplinger Jun 11 2013, 11:28 PM
Looking at the source at http://rsbweb.nih.gov/ij/plugins/download/PDS_Reader.java , it appears that the plugin (from 2001) requires there to be a SFDU label in the data product. These were required a long time ago, but aren't any longer. "The PDS does not require Standard Formatted Data Unit (SFDU) labels on individual products." Seems like some updating of the plugin is required.
Posted by: Ant103 Jun 11 2013, 11:38 PM
Okay :/
This is sad because this plugin was simple, opened the files in 16 bits, and with ImageJ it was cool to export it in png with 16 bits.
I guess, I'll have to find an other way to handle MSL data (maybe try this NASAView software, but as far as I can recall, I've already tried it and found it not very convenient to use, and it's an online tool I believe, so exit the reading of local files). ![]()
Edit : I've downloaded NASAView, and yes, it can open local files (I mistooken it with an other software). So now, the challlenge is to apply the right color scheme. Because I'm opening an LBL files, and I have a window that suggest me to enter value for each R, G and B "layer" of the Bayer matrix (I think).
Edit 2 : Opening Mastcam. Check. Find the good values for the LBL file. Not quite. Save the result as a Jpeg file. Not very good. It leads to a greyscale images with vertical bands all over the image. And with Navcam images, the Jpeg export lead to a stretched picture. Not the thing I'm looking for when working with IMG files…
Edit 3 (and this will be the last) : I'm reading on http://pdssbn.astro.umd.edu/tools/software.shtml this line about NASAView : "The program is not intended to be used for saving and intensive scientific analysis of the data.". As well I'm not a scientist, I quite like an high quality imagery. So, NASAView is not the droidsoftware I'm looking for.
Edith : An interesting reeading here about a modifyed version of the ImageJ plugin. http://www.marsroverblog.com/discuss-203549-imagej-mer-basicspage14.html It seems to working well with MSL IMG files ![]() . I managed to download the .java source file, and copy / paste the new code. I succeed to compile it. I will try with Navcam files.
. I managed to download the .java source file, and copy / paste the new code. I succeed to compile it. I will try with Navcam files.
Posted by: mcaplinger Jun 12 2013, 12:51 AM
Someone who knows how to compile Java in a platform-independent manner could fix the plugin in about 5 minutes, I suspect.
Attached is a simple Python script that reads these files and saves them out as PNGs, but if you don't have Python and PIL installed on your system, that won't do you much good. Also, PIL can't save a 16-bit-per-channel RGB image, so the 16-bit forms of the RDRs would have to be managed as separate channels. For this version, I convert 16-bit data back to 8 bits.
 pdspildet.txt ( 1.56K )
: 605
pdspildet.txt ( 1.56K )
: 605Of course, I hasten to point out that if you want to use the RDRs, saving them out as JPEGs is losing information, since they were JPEGs to begin with as transmitted from Mars.
Posted by: Ant103 Jun 12 2013, 01:12 AM
Okay, this new PDS Reader plugin for ImageJ run like a charm ![]() .
.
Here a Sol 2 Navcam image.
Posted by: mhoward Jun 12 2013, 03:26 PM
Thanks for all the tips on this. One thing I'm wondering is if any files are duplicated between, for example, the MSLMST_0001 and MSLMST_0002 directories, and if so, are the contents of the files the same or different. (I'll probably find out the hard way before too long.)
Posted by: PaulH51 Jun 12 2013, 04:03 PM
Here a Sol 2 Navcam image.
Looks crisp... Can you point us to the original 'raw' file name for this image (prior to calibration)? Or if that is not possible then its current file name in PDS.
TIA
Posted by: mcaplinger Jun 12 2013, 04:03 PM
There are certainly instances where we have transmitted the same image with different compression types or quality levels (for example, the MARDI EDL images were initially transmitted as JPEGS of one quality, then a subset were retransmitted with higher quality, and eventually as lossless versions.) Also, I wouldn't be surprised if some files got archived in partial form (data missing at the end) and then later in complete form, although those arguably should have been weeded out in the archiving process. If you see anything that looks confusing, let me know by PM and I'll pass anything I don't understand on.
Posted by: Ant103 Jun 12 2013, 05:41 PM
Yes Paul ![]()
http://pds-imaging.jpl.nasa.gov/data/msl/MSLNAV_0XXX/DATA/SOL00002/NLA_397681339EDR_F0020000AUT_04096M1.IMG
Posted by: fredk Jun 12 2013, 07:22 PM
Thanks for the tip, Ant. I get an error message when I compile the new PDS reader:
public class PDS_Reader_New extends ImagePlus implements PlugIn {
^
1 error
Edit: Fixed. The filename needed to be "PDS_Reader_New.java", with mixed upper/lower case. Works great now.
And thanks to Horton, if you still read here...
Posted by: Gerald Jun 17 2013, 07:22 PM
A list of APXS targets, first 180 sols: apxs_summary_targets_sol_0_179.txt ( 4.01K )
: 537
CSV-file (for spread sheet software) containing according weight percent (rwp) data: apa_rwp_Sol_0_179_comma.txt ( 8.3K )
: 732
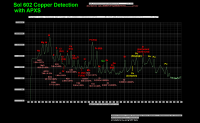
Graphical synopsis:
http://imgbox.com/acdibALc
The above data and graphics are derived from data provided by http://pds-geosciences.wustl.edu/msl/msl-m-apxs-4_5-rdr-v1/mslapx_1xxx/data/.
Posted by: Greenish Jun 18 2013, 02:58 PM
Nice, Gerald. Here is MAVOR, the one from Sol 158 that is the obvious outlier in terms of way more SO3 content. Distances are from the daily uplink notes.
context 25cm http://mars.jpl.nasa.gov/msl-raw-images/msss/00158/mhli/0158MH0075001000E1_DXXX.jpg
closeup 2cm (focus merged) http://mars.jpl.nasa.gov/msl-raw-images/msss/00158/mhli/0158MH0185000006R0_DXXX.jpg
(edit, fix link to full image not thumbnail)
Posted by: Gerald Jun 18 2013, 05:50 PM
Thanks, Greenish!
Mavor APXS data are consistent with most of the sulfur being bound to calcium sulfate. But there seems to be a small excess of sulfur:
18.95 (g CaO/100g) / 56 (g CaO/mol) = 0.338 mol / 100g,
excess of SO3: 0.022 mol / 100g.
PDS data source in file apa_411516167rwp01580051954_______p1.csv in http://pds-geosciences.wustl.edu/msl/msl-m-apxs-4_5-rdr-v1/mslapx_1xxx/data/sol00158/.
Posted by: Gerald Jul 7 2013, 01:51 PM
For convenience, here the PDF version of the MSL mission summaries for sols 0 to 179: MSL_Mission_summaries_sol_0_179.pdf ( 55.73K )
: 973
It can be obtained via http://an.rsl.wustl.edu/msl/mslbrowser/tab.aspx?t=MS:
Follow the link "Historical overview", then "Download as PDF".
Print the page, redirected to saving as PDF file.
Posted by: Gerald Jul 26 2013, 03:13 PM
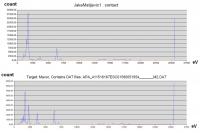
The elemental composition determined by APXS analysis is derived from APXS spectra.
Two examples of APXS spectra:
They show the rsp files apa_401575435rsp00460042100_______p1.csv (http://pds-geosciences.wustl.edu/msl/msl-m-apxs-4_5-rdr-v1/mslapx_1xxx/data/sol00046/) and apa_411516167rsp01580051954_______p1.csv (http://pds-geosciences.wustl.edu/msl/msl-m-apxs-4_5-rdr-v1/mslapx_1xxx/data/sol00158/) as diagrams.
Transforming the x-ray photon energy (in electron volt) via
Z = sqrt(eV / (0.75*13.6057))+1
simplifies the identification of the K-alpha spectral line with the atomic number of the respective chemical element:
(See http://en.wikipedia.org/wiki/Rydberg_constant, http://en.wikipedia.org/wiki/Lyman-alpha_line, and http://en.wikipedia.org/wiki/Moseley%27s_law)
Note the peaks at K-alpha for atomic numbers 16 (https://en.wikipedia.org/wiki/Sulfur) and 20 (https://en.wikipedia.org/wiki/Calcium) in the Mavor spectrum.
Although some of the x-ray emissions aren't K-alpha.
A comparison of Ekwir_1 (29896 seconds counting time) with Snake river (1330 seconds counting time) shows, how counting time influences data quality (logarithmic scale for the counts):
Posted by: Gerald Jul 28 2013, 03:32 AM
Here an annotated version of the Ekwir_1 APXS spectrum:
http://imgbox.com/abeNiIPZ
I've been trying to find the most plausible x-ray emission lines the above spectrum is composed of without using sophisticated optimization software.
It may provide a rough idea of how APXS data can be analysed. Besides the K-alpha spectral line the K-beta line(s) occur, particularly for calcium (Ca) and iron (Fe). For the peaks between 4.6 and 5.0 keV I didn't find a fully plausible explanation; the peak near 22.2 keV is close to K-alpha of silver, and occurs also in pure SiO2 calibration data.
For Rayleigh and Compton backscattered x-rays plutonium emission lines are relevant, because curium used by APXS decays (partly) to excited plutonium, which releases x-ray photons when returning to the ground state. The Rayleigh component occurs close to the originally emitted photon energy, the associated Compton spectrum is in an energy range a little below.
A summary of APXS as used by MSL can be found in the http://msl-scicorner.jpl.nasa.gov/Instruments/APXS/.
Detailed data about X-ray transition energies can be queried via http://physics.nist.gov/PhysRefData/XrayTrans/Html/search.html.
Technical and physical background about X-ray spectroscopy can be found in http://www-pub.iaea.org/MTCD/publications/PDF/te_1190_prn.pdf.
http://www.lpi.usra.edu/meetings/lpsc2008/pdf/2319.pdf provides an idea of how light elements can be inferred by comparing Rayleigh with corresponding Compton backscattering when the preliminary elementary composition is known.
http://link.springer.com/content/pdf/10.1007%2Fs11214-012-9873-5.pdf is behind the paywall.
Posted by: jmknapp Aug 25 2013, 11:50 PM
Here's the UV irradiance data from the PDS displayed in graphical form by sol:
http://curiosityrover.com/rems/uv.php
There are some weird jumps and scale changes in the data from time to time--it's from the ENVRDR files. I think that the MODRDR files are supposed to have corrected data, but from what I can see the UV data isn't included there yet.
The max in the broad band (bandABC, 200-400nm) looks to be about 20 watts/m^2, whatever that translates to in sunburn factor. I that it's a lot, particularly in the "erythemal" band (approximately bands A&B), where 250 mW/m^2 on Earth is considered a UV index of 10.
Posted by: elakdawalla Aug 26 2013, 12:09 AM
http://www.quickmeme.com/meme/3vljla/
(Sorry, couldn't help myself)
Posted by: jmknapp Aug 26 2013, 12:21 AM
It is a barren wasteland, riddled with fire and ash and dust, the very air you breathe is a poisonous fume.
Posted by: Gerald Aug 26 2013, 08:47 AM
cited from http://atmos.nmsu.edu/PDS/data/mslrem_1001/ERRATA.TXT.
So some of the REMS calibration errors seem to have been fixed in the meanwhile. Not yet all as it looks, and more fixes may be provided in the August 30 release.
... And really terrible are UV C to E. There isn't enough oxygen/ozone in the Martian atmosphere to protect the surface.
(after
Posted by: jmknapp Aug 26 2013, 09:06 AM
Interesting. I changed the data files to use release 2--things look a lot better. Thanks, Gerald.
BTW, the UV index as calculated on Earth would (roughly) be in excess of 100, where 11+ is "extreme risk of harm from unprotected sun exposure."
Posted by: Gerald Aug 30 2013, 03:35 PM
PDS data of Sols 180 to 269 are going to get online, e.g. http://atmos.nmsu.edu/PDS/data/mslrem_0001/DATA/SOL_00180_00269/.
Edit: http://pds-geosciences.wustl.edu/missions/msl/index.htm.
Posted by: Gerald Aug 30 2013, 05:13 PM
http://pds-geosciences.wustl.edu/msl/msl-m-chemin-4-rdr-v1/mslcmn_1xxx/data/rdr5/cma_414856883min01960060000ch12240p1.lbl(!) CheMin analysis results for John Klein, PDS file sorted by abundancy:
ANDESINE, 43.8, 3.6
PIGEONITE, 12.7, 4
AUGITE, 8.5, 3.4
MAGNETITE, 7, 1.9
ORTHOPYROXENE, 6.8, 3.1
FORSTERITE, 5.1, 3.3
ANHYDRITE, 3.3, 2.1
ALBITE, 2.7, 1.3
AKAGANEITE, 2.4, 1.4
BASSANITE, 2, 0.9
SANIDINE, 1.7, 1.8
PYRRHOTITE, 1.5, 1.5
HEMATITE, 1.2, 0.9
QUARTZ, 0.6, 0.7
PYRITE, 0.4, 0.5
HALITE, 0.2, 0.3
"... ~28 +/- 15 weight% of this sample consists of X-ray amorphous material ..."
http://webmineral.com/data/Akaganeite.shtml#.UiDKrdJFCSo.
Posted by: Gerald Aug 30 2013, 10:40 PM
Mission summary update, sols 167 to 269 (site 6, accessible via http://an.rsl.wustl.edu/msl/mslbrowser/tab.aspx?t=MS) : Mission_summaries_sol_167_269.pdf ( 31K )
: 619
Details about conjunction activities:
Activities
The pre-built conjunction plan for Sols 236-261 includes background environmental science with the REMS, RAD and DAN instruments. No commanding is planned during this period but the team continues to assess S/C health via a daily direct-to-earth X-band beep as well as basic telemetry relayed via Odyssey.
Posted by: elakdawalla Dec 13 2013, 10:44 PM
The mission summaries are now available through sol 359: MSL_Historical_Overview.pdf ( 218.92K )
: 889
The images are not in the Analyst's Notebook yet -- I'm told by someone at Wash U that they are being ingested into the system now but that it'll be a day or two before the database update is complete. You can, however, download all the images from the http://pds-imaging.jpl.nasa.gov/volumes/msl.html. (Wash U gets them from the Imaging Node.)
Posted by: xflare Mar 13 2014, 10:10 AM
I still cant find any Mastcam images.
Posted by: elakdawalla Mar 13 2014, 03:19 PM
If you're looking for help you're going to have to be more specific about what you're trying that's not working. I just went to both the https://an.rsl.wustl.edu/msl/mslbrowser/default.aspx and the http://pds-imaging.jpl.nasa.gov/volumes/msl.html and had no problem finding Mastcam images.
Posted by: xflare Mar 15 2014, 10:12 AM
OK thanks, thats the site I was on but it wasnt working when I tried.
Im having problems with the .IMG file.
I have NASAview 3.10.0win, but it when i try and open its saying Label/Object not found. I also have IMGtoPNG, but apparently something is missing from my computer and it wont run.
So I turned to a GIMP plugin.. after extracting the .gz file I have a folder called PDS-2.4.116, it says in the help to copy a file called pds.exe to the GIMP plugin folder, but I don't see a file with that name in there...?
uhhhmmmm... can anyone help? ![]()
![]()
Posted by: Phil Stooke Mar 16 2014, 03:26 AM
Hi - you might try opening the IMG file as a raw image. My experience is with Photoshop, but there must be similar in GIMP.
In Photoshop, open using 'open as' rather than 'open', and choose the option to open as a raw image - or however GIMP might describe that. In Photoshop that leads to a window where you have to specify what the image size and bits//pixel is. The IMG will be accompanied by a label file which is just a text file. It typically includes a ton of information you don't need but somewhere it will say how many lines and samples the image consists of - samples being pixels along each line. Enter those numbers and the size of any header and you can open the image, and then save it in a more accessible format.
In practice it can get complicated but trial and error or advice on specific points from here will probably get past any issues.
Phil
Posted by: xflare Mar 16 2014, 09:46 AM
There doesnt seem to be a "Open As" option.
OK I found the pds.exe plugin for GIMP and it recognises the file type now, unfortunately it just causes GIMP to crash when I open the file. ![]()
![]()
![]() T
T
Looks like it may not work win Win 8.1 64BIT
I think I will have to stick to the PNG files.
Posted by: Phil Stooke Mar 16 2014, 06:00 PM
I don't use GIMP, so I was using Photoshop terminology. I see that the 'HowtoGimp' website has instructions on opening raw images using an extra 'raw converter' application, and mentions a couple of candidates.
Phil
Posted by: elakdawalla Mar 16 2014, 09:21 PM
OK, I have confirmed that it works fine in GIMP on Windows, if you open it as a raw file that way.
GIMP expects raw data files to have the extension *.data So rename your .img file to that extension
Open it in gimp. You'll get a dialog with a wonky looking screen because it doesn't properly guess the image dimensions
You will have to tell it the right image dimensions. You can figure out the correct image directions by reading the .lbl file or just by looking at the JPG or PNG version to see how big it is.
Select "Planar RGB" from the Image type dropdown menu
I tried it on http://pds-imaging.jpl.nasa.gov/data/msl/MSLMST_0003/DATA/RDR/SURFACE/0229/0229ML0010620000106079E01_DRCL.IMG. http://www.midnightplanets.com/web/MSL/image/00229/0229ML1063000000E1_DXXX.html. The image is 1616 by 1212 pixels.
Or, you can just use the PNG versions from the Analyst's Notebook, which appear to be white-balanced in some way; I assume it's documented somewhere.
Posted by: Greenish Mar 16 2014, 09:50 PM
It can also be done similarly in ImageJ (or Fiji.) Not at a machine with that software now, but you basically just open as a raw image and enter the dimensions. Nice thing is you can keep full 16 bit or whatever the bit depth is.
Posted by: elakdawalla Mar 19 2014, 03:47 AM
The update is here! The Analyst's notebook now has lots of data through sol 449.
Posted by: Gerald Mar 19 2014, 04:45 PM
Here is the according mission summary: Mission_summaries_sol_0_449.pdf ( 133.84K )
: 678
Posted by: JohnVV Mar 19 2014, 07:01 PM
the problem with using gimp with UFRaw ( unidentified flying RAW) on a img file is the vicar header in the img file
it really is NOT a raw
it is a " header + raw"
you can read the offset and length of that header in any hex editor
then use imagemagic to open it as a raw ( rename the extention to "raw" first) and have IM skip the header length
personally on windows using NASAview to export it as a 8 bit GIF is easier
or using the VERY VERY VERY good tool
img2png
that Bjorn Jonsson made
http://www.unmannedspaceflight.com/index.php?showtopic=4979
---- edited later ----
well what do you know "0229ML0010620000106079E01_DRCL.IMG" dose not have a built in header
according to the label file
0229ML0010620000106079E01_DRCL.LBL
it is
------------
LINES = 1212
LINE_SAMPLES = 1616
------------
8 bit 3 band RGB
for MS windows
install the Windows version of G'Mic
-- a terminal based graphics program ( has replaced Imagemagick for me )
rename the img to raw
and that makes a nice png image
Posted by: elakdawalla Mar 28 2014, 12:59 AM
The RDR versions of the ChemCam RMI data are so much more beautiful than the raw images that I thought I should make it easier to access and download it. So I made one of my usual data-browser index pages to all the ChemCam RMI images (there are about 1600 of them now). The images are still uploading to Amazon as I write this so if you find this note soon after I post it you may see broken image links.
http://planetary.s3.amazonaws.com/data/msl/pds/chemcam.html
I usually build these pages by manipulating the text in the PDS INDEX.TAB file, but for the ChemCam data set the INDEX.TAB file is pretty limited. It includes sol number and the Earth date and time of the image and not much else. I'd gladly add any other metadata to this page that somebody can provide to me in a csv format.
Posted by: Gerald Mar 28 2014, 01:53 AM
The metadata are in file msl_ccam_obs.csv in http://pds-geosciences.wustl.edu/msl/msl-m-chemcam-libs-4_5-rdr-v1/mslccm_1xxx/document/
Posted by: elakdawalla Mar 28 2014, 03:25 AM
So it is ![]() I've updated the index page with some of that information. Not the prettiest design but I can work on that later.
I've updated the index page with some of that information. Not the prettiest design but I can work on that later.
Posted by: Airbag Mar 28 2014, 02:59 PM
Oh, that is really nice! I could even see MSL team members browsing that page...
Airbag
Posted by: Greenish Mar 28 2014, 03:10 PM
Emily this is really useful, thanks.
I stumbled recently upon the official site for chemcam, http://msl-chemcam.com -- don't know how I missed it before, or perhaps it has changed. http://msl-chemcam.com/index.php?menu=images_result&rubrique=63&sousrubrique=248&soussousrubrique=0&art=587&titre_url=Results%20-%20ChemCam%20-%20Results there are pre-made mosaics including target names and laser shot spots all the way through the last PDS released sol! Not sure if they are based on the full processing pipeline but they look nicer than the browse JPGs for sure.
Also, in another thread you mentioned that they are doing passive spectroscopy after all on some of these shots. I believe that the results of this are in the files with "CL1" in their names (actually CL0-3 and CL9 are all "no laser") - these seem to be only in the EDRs, not RDRs. I managed some really crude extraction of the data but am not confident in it yet, and have no idea of its utility since it's not calibrated. I'd encourage others more familiar with processing PDS .dat files to give it a shot.
EDIT: The EDRs are binary with a text label... RDR files are much easier since they are CSV text files. But I only see CL5 files (which are with the laser on).
Posted by: elakdawalla May 14 2014, 12:28 AM
Just noticed this in the APXS instrument description included with the archived data (http://pds-geosciences.wustl.edu/msl/msl-m-apxs-2-edr-v1/mslapx_0xxx/catalog/apxs_inst.cat):
==========================
The APXS instrument showed an abnormal behavior on Mars, unseen in the
lab during calibration and not seen in any other APXS instrument so far.
In some integrations the instrument stopped counting any real x-ray
counts in the midst of the data acquisition. If this happens the last
sub-spectra don't contain real events, only artificial counts around the
lowest detectable energy channel. This behavior, dubbed 'lockup', is
currently under investigation. After any powercycle, the effect is gone.
To mitigate the loss of scientific data, for longer data acquisitions
the integration is therefore split into two integrations with a power
cycle in the middle. This is to mitigate the risk that all data is
lost if the lockup happens early in a single integration.
Posted by: Gerald May 14 2014, 12:38 AM
This issue occurred in the beginning of the mission, but since then I've nothing heard about, whether the workaround ever failed.
Posted by: Gerald May 14 2014, 02:03 AM
It depends. The component images of, e.g. http://msl-chemcam.com/doc/images/587/CRM_436828580_CCAM03441_Deep_Kill_CCAM_after_annotated_scaled.png are listed in the upper right corner. One of these componenet images is http://pds-geosciences.wustl.edu/msl/msl-m-chemcam-libs-4_5-rdr-v1/mslccm_1xxx/data/sol00443/cr0_436828580prc_f0220000ccam03441l1.tif. The according processing steps are documented in http://pds-geosciences.wustl.edu/msl/msl-m-chemcam-libs-4_5-rdr-v1/mslccm_1xxx/browse/sol00443/qchemcam_00443_rmi_436828580.jpg.
Posted by: Gerald Jul 3 2014, 04:30 PM
The PDS provides a summary csv file for APXS data in the http://pds-geosciences.wustl.edu/msl/msl-m-apxs-4_5-rdr-v1/mslapx_1xxx/extras/.
Here a try of a graphical synopsis of the main species for the 66 measurements until Sol 359:
http://imgbox.com/NfSIUQV8
Read the disclaimer of the PDS files regarding trace species (especially Ni, Zn, Br, which aren't visualized here) in low-quality measurements.
The next data release is scheduled to be early in August.
Edit: I just saw, that imgur is terribly reducing the image, therefore used imgbox this time (hoping they'll be able to keep the site clean).
Edit: http://postimg.org/image/5emqimxxd/.
Posted by: JohnVV Jul 3 2014, 05:22 PM
i use that site (imgbox) all the time
BUT
i do have "no-script", "ad Block plus", and "Ghostery" installed on firefox and Seamonkey
the " family safe" is a good setting to use
Posted by: Gerald Jul 6 2014, 05:04 PM
An excerpt of the csv file in the http://pds-geosciences.wustl.edu/msl/msl-m-apxs-4_5-rdr-v1/mslapx_1xxx/extras/ of the PDS:
http://imgur.com/a/Kjs31#0, for the "check the spectra" part.
Counts are scaled logarithmically (vertical axis), energy is scaled close to the K-alpha line of respective ordinal numbers (horizontal axis).
Edit: Visualized spectra include sols 0 to 443, not just to 359.
Posted by: elakdawalla Aug 1 2014, 07:37 PM
The next MSL data release is beginning to hit the PDS! It covers sols 450-583. I just visited the Analyst's Notebook (which doesn't yet display data from the new release) and discovered that they now have a wonderful new product: https://an.rsl.wustl.edu/msl/mslbrowser/viewHelp.aspx?h=Mosaics. They seem to have done it for all of the mosaics that are not generated at JPL MIPL (JPL generates the geometrically controlled Navcam pans used for planning, but otherwise doesn't generate mosaics), although I haven't yet checked thoroughly to verify that their lists of mosaics are exhaustive. But they are just gorgeous.
Even though the latest data release is not yet ingested into the Analyst's Notebook, it can be browsed from the http://geo.pds.nasa.gov/dataserv/holdings.html and http://pds-imaging.jpl.nasa.gov/volumes/msl.html, if you're in a hurry.
Posted by: elakdawalla Mar 18 2015, 05:46 PM
https://an.rsl.wustl.edu/msl/mslbrowser/
Posted by: Gerald Mar 18 2015, 09:24 PM
For convenience, the mission summaries from sol 0 to 804 as pdf, retrieved from Analyst's Notebook: Mission_summaries_sol_0_804.pdf ( 239.58K )
: 1303
Posted by: Gerald Mar 22 2015, 05:16 PM
http://imgur.com/a/8VYYR.
Interesting e.g. peaks at K-alpha position of copper (ordinal number 29) at http://imgur.com/a/8VYYR#28. This would be the first significant APXS detection of copper at Gale I'm aware of.
The same spectrum with peaks at K-alpha positions of germanium (ordinal number 32), and bromine (ordinal number 35).
http://imgur.com/a/8VYYR#35 probably with a K-alpha peak for rubidium (ordinal number 37); the peak overlaps with a plutonium peak generated by the APXS curium alpha particle source.
The http://imgur.com/a/8VYYR#38 may contain some zirconium (ordinal number 40), but I'm unsure whether that's necessarily of Martian origin, could be abrasion from the drill bit.
Posted by: Gerald Mar 29 2015, 11:54 AM
Since indications for copper on Mars have been rather rare thus far, I think the detection at the Liga target deserves some more elaboration.
I'm not aware of an according paper (yet?).
https://an.rsl.wustl.edu/msl/mslbrowser/target.aspx?i=78583&mi=FULL.
https://an.rsl.wustl.edu/msl/mslbrowser/product.aspx?B1=FLB_450938781RADLF0310724FHAZ00323M1&xw=1.
And here an annotated APXS spectrum:
(http://physics.nist.gov/PhysRefData/XrayTrans/Html/search.html)
(http://pds-geosciences.wustl.edu/msl/msl-m-apxs-4_5-rdr-v1/mslapx_1xxx/data/sol00602/)
Posted by: Gerald Apr 1 2015, 05:06 PM
A try of an APXS synopsis Sols 360 to 803, assembled from rsp (for target names) and rwp (for abundance weight percent) files:
http://postimg.org/image/6cb4ktv7v/
Intermediate csv file: msl_apxs_sol_360_803_ver2.txt ( 19.89K )
: 709
It's roughly in the style of msl_apxs_sol_0_359_ver2_rg.csv in http://pds-geosciences.wustl.edu/msl/msl-m-apxs-4_5-rdr-v1/mslapx_1xxx/extras/, but abundances for Ni, Zn, and Cr are left as in the rwp files; columns fit_type,start_time,gnorm,sh_tavg [C],lifetime,Fe_FWHM eV are filled with dummy values, the sol number may follow a different convention (start/end of measurement) than the extras file.
Unusual is the high manganese (up to more than 4 wt-%) at the Stephen target.
Any errors are mine, verification using http://pds-geosciences.wustl.edu/msl/msl-m-apxs-4_5-rdr-v1/mslapx_1xxx/data/ recommended.
Posted by: Gerald Apr 3 2015, 04:35 PM
http://imgur.com/a/dap0P#0
I've provided an annotated version of the SiO2 target. It seems to contain a small Si (Kα+Kα) peak. That kind of peak can occur, when two x-ray photons enter the detector within a short period of time. In those (rare) cases the detector adds the energies of the two photons to one count of the summed photon energy.
(Edit: The peak annotated as "Pu L1L3 ?" overlaps with Ag Kα; since further right almost on noise level there seems to be a hint of an Ag Kβ peak, the "Pu L1L3 ?" peak likely contains a significant Ag Kα component indicating some silver instrument background.)
The calibration spectrum file apxs_pfm2008_spectrum_gh.csv seems to contain the data of the file apxs_pfm2008_spectrum_gsn.csv, correct apxs_pfm2008_spectrum_gh.csv seems to be missing, in http://pds-geosciences.wustl.edu/msl/msl-m-apxs-4_5-rdr-v1/mslapx_1xxx/calib/.
I've sent an error notification to the according PDS Geosciences Node email address.
Edit: File apxs_pfm2008_spectrum_gh.csv will be removed from the PDS APXS calibration directory, since the according measurement couldn't be completed in 2008; the GSN spectrum file happened to be delivered twice.
Posted by: PaulH51 Jul 31 2015, 09:41 PM
The NASA Planetary Data System announces the ninth release of data from
the Mars Science Laboratory (MSL) mission, covering data acquired from
Sol 805 through Sol 938 (November 10, 2014 through March 28, 2015).
This release consists of raw and derived data sets from the following
instruments:
Alpha Particle X-ray Spectrometer (APXS)
Chemistry & Micro-Imaging (ChemCam)
Chemistry and Mineralogy (CheMin)
Dynamic Albedo of Neutrons (DAN)
Hazard Avoidance Cameras (Hazcam)
Mars Hand Lens Imager (MAHLI)
Mars Descent Imager (MARDI)
Mast-mounted Cameras (Mastcam)
Navigation Cameras (Navcam)
Radiation Assessment Detector (RAD)
Rover Environmental Monitoring Station (REMS)
Sample Analysis at Mars (SAM)
Spacecraft, Planet, Instrument, Pointing C-Matrix, and Event kernels (SPICE)
New dataset MSL-M-ROVER-6-RDR-PLACES-V1.0 provides rover
positions and orientations.
To access the above data for this release:
http://pds.nasa.gov/subscription_service/SS-20150731.shtml
Links to all MSL data sets may be found on the PDS Geosciences Node web
site http://pds-geosciences.wustl.edu/missions/msl/. The data may also
be reached from the main PDS home page, http://pds.nasa.gov/. MSL data
are archived at the PDS Atmospheres, Planetary Plasma Interactions
(PPI), Geosciences, Imaging, and Navigation and Ancillary Information
Facility (NAIF) Nodes.
PDS offers two services for searching the MSL archives:
The Planetary Image Atlas at the Imaging Node allows selection of MSL
image data by specific search criteria.
http://pds-imaging.jpl.nasa.gov/search.
The MSL Analyst's Notebook at the Geosciences Node allows searching and
downloading of all MSL data in the context of mission events.
http://an.rsl.wustl.edu/msl.
Posted by: Gerald Aug 1 2015, 10:33 AM
https://an.rsl.wustl.edu/msl/mslbrowser/tab.aspx?t=MS for convenience: histOverview_sol_0_938.pdf ( 280.68K )
: 618
On sols 932, 933 HGA occlusion tests have been performed.
https://www-robotics.jpl.nasa.gov/publications/Khaled_Ali/ieee05_smc_hga.pdf.
About https://en.wikipedia.org/wiki/Euler_angles and https://en.wikipedia.org/wiki/Gimbal_lock, one of the topics in this context.
Posted by: Gerald Aug 1 2015, 03:01 PM
http://imgur.com/a/cYeKR#0.
Pointing out some observations:
High bromine at Pickhandle_DRT, comparison with Puente_DRT_raster:
High nickel and traces of arsenic at Potatoe_raster2, comparison with Hyrum_DRT:
High zirconium (contamination by drill bit?) at Mojave_mini_drill, comparison with Hyrum_DRT; you may note the increased count in the Hyrum spectrum for energies below the iron lines due to Compton scattering of the stronger x-ray emissions of iron:
To find out, whether the above peaks are actually caused by zirconium, here my try to simulate the SiO2 calibration target with additional simulated zirconium as comparison:
Posted by: Gerald Aug 1 2015, 11:20 PM
Overview elemental abundances by APXS, sols 805 to 937:
http://postimg.org/image/dteynsy83/full/
csv version:  rwp_Abundances_sol805_937_with_headlines.txt ( 11.79K )
: 603

Posted by: Greenish Aug 3 2015, 06:08 PM
Thanks for posting the data Gerald. Here's an alternate view. rwp_Abundances_sol805_937_replotted.pdf ( 146.28K )
: 626
Posted by: Herobrine Nov 10 2015, 11:20 PM
Honestly not sure which thread this belongs in; I could think of 3 that sounded right, and I picked this one.
I've been working on using stereo data from the engineering cameras, combined with color imagery from the science cameras to create color versions of HAZCAM and NAVCAM frames in an automated way. I've had some encouraging results, so I wanted to post about it.
Let me explain what it is I'm doing, first. I read in a bunch of XYR and RAD products from HAZCAM and NAVCAM, then read in a bunch of color images from the science cameras, and for each science camera image, go through all of the NAV/HAZ images (with 3D coordinates) and transform each pixel into the image space of the science camera image, and if it falls within the frame, use that pixel from the science camera image to color the pixel in the engineering camera image. And by "I", I mean the program I wrote to do all of the work for me.
Here is an example, using a NAVCAM image.
Here's the original image:
Here it is with the pixels colored in the manner described above, but with the 'value' (brightness) being provided by the original engineering camera image, so that the lighting conditions appear like they did in the original.
The color contribution in the above image has had a level adjustment performed on it to make differences in color more apparent.
And here it is with the pixels colored in the manner described above, with the original pixels being entirely replaced (in the colored region) by pixels from MASTCAM images:
Posted by: MarsInMyLifetime Nov 11 2015, 01:00 AM
This is quite a useful technique. Since it is a pixel-for-pixel substitution, there should be very little visual disturbance to the image itself, although you may need a test for parallax issues (e.g., the Mastcam is imaging a bright overhand whereas the Hazcam is looking into the darkness under it). As a purely human-friendly alternative way of viewing that formerly B&W data, this could open up a load of new visualizations.
Imagine using the original levels of images taken through filters to modify the brightness of the substituted color scene... the colors would be "normal" but the brightness would represent the filter's effects without actually discoloring the scene. I don't know that it would be scientifically useful, but it would be another way of imagining (not imaging) the effect of filters. Hmm... knowing the filter, you might actually be able to subtract the stopband from the pixel and actually get a filtered color result. Neat software to have and play with, by all means!
Posted by: Herobrine Nov 11 2015, 03:43 AM
That is definitely a real concern. With the HAZCAMs, in addition to having a much higher ranging error than the NAVCAMs, their low vantage point introduces some challenges. To use a slightly different example than the one you came up with, take this HAZCAM image (it's actually an average of 6 taken from the same position at different times):
Here's the replace-with-MASTCAM-pixels version:
MASTCAM is catching the top side of rover structure along the ray through that pixel, on its way to the coordinate on the ground and painting the ground with the rover structure as a result. In this case, there are some possible automated solutions. The NAVCAM and HAZCAM data products include masks for rover structure (I'm not using them right now, though I plan to start soon). MASTCAM doesn't, but the articulation data is still there, so it should be possible to generate a mask for rover structure; just need to do whatever it is Curiosity is doing for the engineering cameras.
That doesn't do anything for your example, but there are other ways to mitigate that issue. As with most issues I've encountered, the solution is to throw more data at it. The NAV/HAZCAM data products include surface normals (I'm not currently using them, but I have plans). The MASTCAM products don't, obviously, but you can constrain the possible surface normal to a hemisphere at worst. The surface normals for much of the underside of the overhang in your example would be outside or near the limits of that hemisphere. That data can be used as one part of a pass/fail test for MASTCAM pixels.
Here's the use-the-HAZCAM's-brightness version, while I'm at it:
The color contribution had a level adjustment performed in this image, to exaggerate differences in color.
I'll point out that I haven't yet made any attempt to get levels matched across MASTCAM frames, or to even sum and average contributions from multiple MASTCAM frames to make those transitions in the second image not so harsh. There are a lot of things I can do to make the output look a lot better. My focus is on other aspects of this process at the moment.
Posted by: Herobrine Nov 11 2015, 05:01 PM
I might as well say what I'm really working on since it's arguably more interesting than simply colorizing grayscale imagery; the engineering camera colorization is just a bonus product of it.
I'm trying to write software that uses massive amounts of engineering and science data from Curiosity to create photorealistic, virtual, 3-D, Martian environments, with high spatial fidelity, that a person can walk/fly around in and explore. I haven't really thought much, past wanting to make it, about what I'd actually do with it. I just really like the idea of being able to fly around the areas that Curiosity has explored, even being able to examine individual rocks on the surface.
As it turns out, in theory, the data products from the engineering cameras provide almost everything one would need to recreate, at a high spatial resolution, the areas Curiosity explores. They provide a very high number of 3-dimensional spatial data points, surface normals and radiance values included, enough to blanket the areas with fairly dense coverage.
I've been working on it for about a week now, so I'll show what I've been able to produce so far.
Here's a stereo pair of screenshots from the running program, with a view of part of a dense point cloud of the Martian terrain near Site 45, generated from 1.53 gigabytes of MSL data from Sols 896-899:
The point cloud contains 34,184,365 points. The spatial data are derived from 18 HAZCAM (9F,9R) and 84 NAVCAM (50 TRAV, 34 NCAM*) data products. The color data are derived from 1 MAHLI and 193 MASTCAM (167L, 26R) data products. The 'sky' is just a background color behind the point cloud.
Here are Red/Cyan anaglyphs of that stereo pair in http://mc.herobrinesarmy.com/msl/color/anaglyph_color.png and in http://mc.herobrinesarmy.com/msl/color/anaglyph_gray.png. Unfortunately, I spaced my shots too far apart, so the parallax is extreme and uncomfortable. If you have trouble getting them to converge because of this, try looking at the terrain in the background first, and then work your way down; that should make it much easier.
To provide another view, here's a shot looking downish above the small rock formation in the midground on the right side of the stereo view.
I used linearized image products for the science cameras and didn't trim quite enough off the borders in my code. As a result, there are some dark red and some white coloring artefacts throughout the point cloud. That's easy to fix, but I don't feel like waiting for it to re-process the entire dataset right now.
Also, I should note that the above "screenshots" of the point cloud have been altered for posting. The point cloud is dense, but it's not always dense enough everywhere that I can just render every point as a dot and have that cover the entire screen at every distance. In the original screenshots, there were gaps between points in some areas, causing the background to show through, and making it difficult to view. This isn't much of a problem when flying around the point cloud because the motion allows my brain to make sense of it. For a static image, however, those gaps really need to be filled or the image will be difficult to interpret. Fortunately, the parts of the point cloud with gaps are usually the parts where the surface is smooth and the albedo is roughly constant, so I was able to make the images much easier to look at by placing a blurred version of the image underneath the original, causing the gaps to be filled with smooth, roughly constant color.
It's also worth noting that my software doesn't do any photogrammetry at all (for now). The geometry is generated solely from the engineering data products, wherein the necessary photogrammetry has already been done for me.
Once the data is processed, the point cloud renders plenty fast enough (I get over 60 FPS exploring the point cloud seen above), but the processing is computationally demanding and takes quite a while. The software used to be able to process 5-10 gigabytes of MSL data, yielding dense point clouds of over 100 million points, with partial color coverage, in 15 minutes or so. I recently introduced the ability for it to handle data from different Drive points within the same Site (haven't made it handle different Sites yet) and the additional computations it now requires, in order to transform between different rover nav frames when coloring the points, have slowed it down quite a lot. The 34-million-point cloud used in the above screenshots took hours to generate. I'm not too concerned about that; I haven't made any effort to optimize the processing, as I'm still playing around with how it all should work, and haven't even multithreaded it yet. Probably more concerning is the memory requirement for this processing. After processing is finished, and the point cloud is displayed in the 3-D environment, the program occupies 10 gigabytes of pageable virtual address space in the case of the point cloud seen above, and over 24 gigabytes for point clouds in the 100+ million point range.
There are a lot of things I can do to add to, improve, or evolve the software I've written so far. What probably needs to happen next is turning the point cloud data into a solid mesh. Then I can bring in the surface normal data from the engineering data products, and also look at greatly reducing the density of vertices in flat regions and start turning this thing into something people might actually want to play with.
Once I have the surface normal data incorporated, I could even look at approximating some surface albedo and reflectance characteristics using images of the same point taken at different times of day in science and engineering images and the roughness values in the engineering data products. If I do that, I can potentially correct for shadows and lighting in the source imagery and apply dynamic lighting/shading/shadowing in the scene, with dirt looking dirty, and shiny rocks looking shiny and rocky.
And the list goes on.
*12 of the 34 NCAM frames were half-frame shots of the same spot, taken seconds apart.
Looks like I have some attachment space left, and I'd hate to see it go to waste, so here are two more overhead views, showing other parts of that point cloud.
Posted by: DanMan Nov 11 2015, 06:30 PM
Herobrine, this is really amazing work!
It would be great to see video "fly through" postings of particular sites. Also, as a 3D printer enthusiast, I would love to try printing any interesting meshes you are able to generate and posting the result.
Posted by: Herobrine Nov 17 2015, 06:59 AM
Sorry it's taken so long for me to respond. I was going to see if I'd get around to making enough progress to make a decent video before I responded but I haven't had time. There is a video on YouTube of whatever I had a few days after I started working on this stuff, but I wasn't going to post a video here until I had something better to show. I'm still working on other aspects of the software, but here's some shots I took the other day of various features near Site 45.
For each, I've included the original screenshot directly from the program on the left, and the version with the blurred background gaps and skyish background color on the right.
Click any for full-size versions.
http://mc.herobrinesarmy.com/msl/color/ba1.png
http://mc.herobrinesarmy.com/msl/color/ba2.png
http://mc.herobrinesarmy.com/msl/color/ba4.png
http://mc.herobrinesarmy.com/msl/color/ba3.png
I don't know much about 3-D printing, but one should be able to generate a pretty good mesh from these point clouds. I haven't gotten around to trying it yet, though. I'm still playing with throwing more data into the mix. 

Posted by: DanMan Nov 17 2015, 05:58 PM
Interesting images! I assume that the darkest areas have the highest concentration of points. For a first attempt, it would be really interesting to print a small portion of a site in life size (i.e. a weathered, layered portion of a rock face would be pretty cool to print). I'll watch here for any meshes you can generate and give feedback.
Posted by: Herobrine Nov 17 2015, 07:05 PM
As great as that would be, no; the black pixels in the left-hand images are actually pixels on which no point in the cloud falls. Most of the shots are taken from positions a fair distance away from any of the rover positions from which data was captured. The point cloud those shots came from contains around 75-80 million points derived from only NAVCAM data products from Sols 896-901...I think. I can fill out the areas with denser coverage by including more Sols of data from the exploration of this area. If I do that, I'll need to segment it spatially so I don't have giant memory issues. That point cloud currently is over 2 gigabytes stored in binary data on disk and requires about 10 gigabytes of RAM to display.
Posted by: nogal Dec 5 2015, 06:41 PM
New release of MSL data (10th) in PDS. The Astronomical Notebook also has data up to sol 1062.
Notification text:
The NASA Planetary Data System announces the tenth release of data from
the Mars Science Laboratory (MSL) mission, covering data acquired from
Sol 939 through Sol 1062 (March 28, 2015, through August 2, 2015).
This release consists of raw and derived data sets from the following
instruments:
Alpha Particle X-ray Spectrometer (APXS)
Chemistry & Micro-Imaging (ChemCam)
Chemistry and Mineralogy (CheMin)
Dynamic Albedo of Neutrons (DAN)
Hazard Avoidance Cameras (Hazcam)
*Mars Hand Lens Imager (MAHLI)
Mars Descent Imager (MARDI)
Mast-mounted Cameras (Mastcam)
Navigation Cameras (Navcam)
Radiation Assessment Detector (RAD)
Rover Environmental Monitoring Station (REMS)
Sample Analysis at Mars (SAM)
Spacecraft, Planet, Instrument, Pointing C-Matrix, and Event kernels (SPICE)
*This release of MAHLI data includes a technical paper documenting the MAHLI
characterization and calibration status from August 2008 to February 2015.
To access the above data for this release:
http://pds.nasa.gov/tools/subscription_service/SS-20151205.shtml
Links to all MSL data sets may be found on the PDS Geosciences Node web
site http://pds-geosciences.wustl.edu/missions/msl/. The data may also
be reached from the main PDS home page, http://pds.nasa.gov/. MSL data
are archived at the PDS Atmospheres, Planetary Plasma Interactions
(PPI), Geosciences, Imaging, and Navigation and Ancillary Information
Facility (NAIF) Nodes.
PDS offers two services for searching the MSL archives:
The Planetary Image Atlas at the Imaging Node allows selection of MSL
image data by specific search criteria.
http://pds-imaging.jpl.nasa.gov/search.
The MSL Analyst's Notebook at the Geosciences Node allows searching and
downloading of all MSL data in the context of mission events.
http://an.rsl.wustl.edu/msl.
The PDS Team
Mailto: pds_operator@jpl.nasa.gov
Phone: (818) 393-7165
Posted by: Gerald Dec 6 2015, 02:00 AM
For convenience, the historical overview / mission summeries of Analyst's Notebook: histOverview_sol_0_1062.pdf ( 318.08K )
: 593
Posted by: Gerald Dec 6 2015, 06:41 PM
APXS of sols 938 to 1062, main species
as csv file:
 rwp_Abundances_sol_938_1062_with_headlines.txt ( 4.18K )
: 478
rwp_Abundances_sol_938_1062_with_headlines.txt ( 4.18K )
: 478and http://imgur.com/a/YFkUj.
Interesting:
- SiO2-equivalent up to more than 70%, FeO-equivalent down to less than 10% in some samples, TiO2 enriched,
- Buckskin_mini_start_hole (sol 1059, apb_491545899rsp10590482542_______p1): heavily depleted in Mg,
- Kern Peak (sol 949, apb_481703738rsp09490451108_______p1): Peaks near K-alpha energy of trace species like Ga, Ge, As, Br.
Posted by: yogi Jan 17 2016, 07:18 AM
Almost three years later, that seems to still be the case. Of course, I can download the INDEX.TAB files to construct wget commands to download everything, but even after I've done that it's still less convenient than ftp (for example, it's harder to pause & resume the process or to figure out approximately how many bytes I will be downloading in total).
Does anyone know a place where navcam, hazcam and mastcam images & metadata are available over FTP?
Posted by: Gerald Feb 19 2016, 05:52 PM
Try pdsimage2.wr.usgs.gov, and switch to directory /Missions/Mars_Science_Laboratory, in analogy to the instructions of http://www.lpi.usra.edu/meetings/7thmars2007/pdf/3356.pdf.
But the latest data seem to be of Sol 804.
Posted by: JohnVV Feb 19 2016, 06:07 PM
the imaging node has this listed
http://pds-imaging.jpl.nasa.gov/volumes/msl.html
mast cam to SOL-1062
http://pds-imaging.jpl.nasa.gov/data/msl/MSLMST_0010/
Posted by: jccwrt Mar 7 2016, 05:21 PM
I've started diving into the PDS-quality images of the time spent in Artist's Drive (really I should have been doing this earlier!) and I've made a couple images with these.
First up is a nice panorama of the entrance to Artist's Drive on Sol 931. It's kind of a shock to jump back half a Mars year and see how dusty the atmosphere was - the rim of Gale Crater is just barely visible on the right, and the skies are much darker than they are now.
https://flic.kr/p/E1tVNX
The other one is a composite that I spent most of Sunday afternoon working on, using a couple of observations from Sol 956. That was the day that Curiosity attempted to image a transit of Mercury at sunset. Earlier that day, Curiosity took a six-frame M-100 mosaic looking in the direction of sunset. I combined it with an M-34 image taken at sunset.
To do so, I set the foreground mosaic to grayscale, and then adjusted the brightness and contrast until the lighting was similar to the sunset image. Then I aligned the sunset image with the foreground, and used that to recolorize the scene. Once everything was stitched together I brightened the entire image to make the foreground a little brighter, since it was really underexposed. The entire scene should maintain the proper relative brightnesses and everything, although it's not 100% accurate, since the shadow lengths in the foreground still represent an early afternoon scene.
https://flic.kr/p/E1xFet
Posted by: nogal Mar 16 2016, 11:10 PM
Release 11 of MSL data, covering sols 0-1159, has just been made available in the PDS.
The Analyst's Notebook has been similarly updated.
Here is the Historical overview in PDF format:  MSL_Curiosity__Historical_Overview.pdf.pdf ( 703.11K )
: 516
Fernando
Notification text:
The NASA Planetary Data System announces the eleventh release of data from
the Mars Science Laboratory (MSL) mission, covering data acquired from
Sol 1063 through Sol 1159 (August 2 to November 10, 2015).
This release consists of raw and derived data sets from the following
instruments:
Alpha Particle X-ray Spectrometer (APXS)
Chemistry & Micro-Imaging (ChemCam)
Chemistry and Mineralogy (CheMin)
Dynamic Albedo of Neutrons (DAN)
Hazard Avoidance Cameras (Hazcam)
Mars Hand Lens Imager (MAHLI)
Mars Descent Imager (MARDI)
Mast-mounted Cameras (Mastcam)
Navigation Cameras (Navcam)
Position Localization and Attitude Correction Estimate Storage (PLACES)
Radiation Assessment Detector (RAD)
Rover Environmental Monitoring Station (REMS)
Sample Analysis at Mars (SAM)
Spacecraft, Planet, Instrument, Pointing C-Matrix, and Event kernels (SPICE)
To access the above data for this release:
http://pds.nasa.gov/tools/subscription_service/SS-20160316.shtml
Links to all MSL data sets may be found on the PDS Geosciences Node web
site http://pds-geosciences.wustl.edu/missions/msl/. The data may also
be reached from the main PDS home page, http://pds.nasa.gov/. MSL data
are archived at the PDS Atmospheres, Planetary Plasma Interactions
(PPI), Geosciences, Imaging, and Navigation and Ancillary Information
Facility (NAIF) Nodes.
PDS offers two services for searching the MSL archives:
The Planetary Image Atlas at the Imaging Node allows selection of MSL
image data by specific search criteria.
http://pds-imaging.jpl.nasa.gov/search.
The MSL Analyst's Notebook at the Geosciences Node allows searching and
downloading of all MSL data in the context of mission events.
http://an.rsl.wustl.edu/msl.
The PDS Team
Mailto: pds_operator@jpl.nasa.gov
Phone: (818) 393-7165
Posted by: jccwrt Mar 17 2016, 03:41 PM
I've decided to start working through the PDS from the start of the mission to do a bit of catching up on what I missed. I didn't start really following along with the mission's day to day activities until about mid 2014, so I missed a lot of stuff. I know flickr is a bit picky about allowing downloads, so I've included a direct link to the full-size images, so I think you can just right-click "Save As" normally from there.
Sol 42 mosaic of the Yellowknife Bay area from "Glenelg Overlook" with a bit of a sol 45 mosaic of Mt. Sharp for cosmetic purposes.
https://flic.kr/p/Fito35
https://flic.kr/p/Fito35 by https://www.flickr.com/photos/132160802@N06/, on Flickr
https://www.flickr.com/photos/132160802@N06/25795636536/sizes/o
Testing the sands at Rocknest on Sol 59:
https://flic.kr/p/Fn5U6T
https://flic.kr/p/Fn5U6T by https://www.flickr.com/photos/132160802@N06/, on Flickr
https://www.flickr.com/photos/132160802@N06/25836516085/sizes/o
Anaglyphic and non-anaglyphic images of Point Lake on Sol 127:
https://flic.kr/p/FdtKXd
https://flic.kr/p/FdtKXd by https://www.flickr.com/photos/132160802@N06/, on Flickr
https://www.flickr.com/photos/132160802@N06/25739127782/sizes/o
https://flic.kr/p/EWAoXs
https://flic.kr/p/EWAoXs by https://www.flickr.com/photos/132160802@N06/, on Flickr
https://www.flickr.com/photos/132160802@N06/25559359000/sizes/o
Posted by: phase4 Mar 18 2016, 10:14 AM
I have written an addon for Blender that converts Rover Navcam data from PDS. Here is a screenshot showing three Navcam products made by Curiosity on Sol 440.
Posted by: phase4 Mar 21 2016, 01:50 AM
The Blender addon is now available on https://github.com/phaseIV/Blender-Navcam-Importer.
Enjoy!
Posted by: jccwrt Mar 21 2016, 07:49 PM
ChemCam RMI mosaic of the target "Robin Hood". Just incredible resolution with the RMI, it looks like I'm looking at it through a hand lens. This particular rock is also pretty neat, it's got sodium feldspar lathes and probably represents some felsic (in the Mars sense) igneous rock that developed somewhere upstream from Gale Crater.
https://flic.kr/p/FnKnky
https://flic.kr/p/FnKnky by https://www.flickr.com/photos/132160802@N06/, on Flickr
Looking forward to finding some of the long-distance RMI mosaics!
Posted by: phase4 Mar 26 2016, 02:50 AM
Hey all,
I made an animation of Curiosity’s path along Bridger Basin, (sol 1100) using navcam xyz files. With the Blender addon (2 posts up) I mapped out 6 site locations and moved through them.
And while xyz data tend to have spiky glitches and contain many gaps (which the addon fills inexpertly) the result came out quite nice. The depth range of the Navcam instruments is astonishing!
You can see the animation here: https://vimeo.com/160405895
Posted by: James Sorenson Mar 26 2016, 03:24 AM
That is some awesome work. I love the animation as well. ![]()
Posted by: PaulH51 Mar 26 2016, 05:21 AM
Ditto awesome..... Hope you have the time to make more of these ![]() thanks for sharing...
thanks for sharing...
Posted by: sittingduck Mar 26 2016, 12:32 PM
Phase4, that's incredible! Please let us know if you ever make any more. I get an error when using the PDS left navcam filenames with the plugin. Are you taking the name from elsewhere or modifying it in some way?
Posted by: scalbers Mar 26 2016, 03:25 PM
Reminds me of some of the animations (e.g. from MARS3D) that were posted prior to Curiosity's launch/arrival such as this: https://www.youtube.com/watch?v=Cq0Z3cKJaGQ
Now we can see the real-life low altitude view!
Posted by: Herobrine Mar 28 2016, 10:19 PM
@phase4
That looks really nice! I'd been trying to generate good meshes from the data for a while but never got results that good. Might need to peek at your code. ![]()
Have you tried projecting MASTCAM imagery onto the meshes to give them color? I've had good results, and I can only imagine how amazing your video would look in color.
Here's an example of the results I get from projecting MASTCAM imagery into a NAVCAM point cloud that I then generate a mesh from (the mesh is vertex-colored; you should be able to do better than this if you uv-map it instead).
The camera angles in these screenshots aren't quite the same, but you get the idea. The mesh above is generated from the data products available in the Analyst's Notebook for a single NAVCAM frame. The color data appears to have come from as many as 32 MASTCAM images (probably less since a lot of the colors were probably overwritten multiple times with better images, but that's how many times the total number of colored points increased after an image was projected).
Posted by: phase4 Mar 31 2016, 11:00 PM
Thank you for the kind words. I hope to make many more. ![]()
@sittingduck, The import script is updated, there was a problem on windows. (Apologies, I only tested macs)
@Herobrine, Mastcam images overlay is possible in Blender but I need to figure out how to aim the camera correctly.
Btw, not every site location has full Mastcam coverage, so it is quite a puzzle to get animations like this in full color.
Posted by: Herobrine Apr 1 2016, 08:49 PM
I haven't used Blender in more than 10 years, so I don't know anything about how it works anymore, but if it doesn't support the CAHV(OR(E)) model, then I imagine you'd have quite a challenge on your hands.
I'd guess it was already quite a puzzle to get it all assembled so seamlessly as you did for that video. If you can manage to get MASTCAM imagery into it, then for the areas without MASTCAM coverage, you can consider combining the brightness from the NAVCAM imagery with a constant hue+saturation to produce a fairly convincing color. The areas with little-to-no MASTCAM coverage tend to be less "interesting" and so there isn't usually as much variation in color in those areas, fortunately. This might be getting to the point where it's not worth the effort, but if you can automate it, it might worth it (I haven't looked at your code yet, so I have no idea how easily any of this could be worked into your process).
Here's an example of what I just described, using that same Sol 440 location you showed us a few posts back.
Here's the mesh (14 meshes, actually) I generated using 14 NAVCAM images at Site 22 on Sol 440 and a bunch of MASTCAM imagery (probably isn't all of the MASTCAM coverage of this area). Now, if I take an average of the color in the colored area and combine that hue and saturation with the brightness values of the greyscale parts...
...it looks fairly convincing. It's not perfect, but the transitions don't look too terrible.
I was using level-adjusted MASTCAM data to increase the color contrast here. If I hadn't level-adjusted it, the blending probably would have looked even better since Mars is pretty pinkish with not very much color variation in most places.
Posted by: James Sorenson Apr 2 2016, 03:42 AM
With all do respect, That would ruin a masterpiece! Personally if no color data is available from Mastcam, I wouldn't stoop to the awful "Navcam Colorization" method. I'd just leave it alone with just plain and simple original grayscale.
Posted by: Herobrine Apr 4 2016, 04:11 AM
I don't see the difference, personally. You don't destroy any of the original NAVCAM data; you're just weighting the channels in a completely reversible way so that it doesn't clash with the color imagery it's being rendered adjacent to.

Posted by: jccwrt Apr 8 2016, 10:14 PM
I agree, adding coloration to the NavCam data is useful for VR environments and drive visualizations, otherwise the clash really breaks immersion. But the nice part about having the code available is that the individual working with the data can make their own decisions about how to handle it!
Anyway, I've put together a full panorama of the Dingo Gap traverse documentation 360 panorama taken by Curiosity on Sol 530. Here's the flickr upload for the pano:
https://flic.kr/p/FZtg6p
https://flic.kr/p/FZtg6p by https://www.flickr.com/photos/132160802@N06/, on Flickr
I've also https://round.me/tour/38637/view/94182/ so that you can get a sense of what it might have been like to be standing there on the surface.
My trick for creating a synthetic sky is to use two horizontal gradients (both with the same color beginning and end points for seamless tone matching) to match what little of the sky we see in the actual data. Then a vertical gradient is applied from the top of the image so there's not any artifacting at the north pole of the projected image on Roundme. Around the horizon I applied a whitish semi-transparent vertical gradient to simulate atmospheric effects. Not quite what you would actually see if you were standing there on Mars, but I tried to stick to the original data as closely as possible to simulate it. I think this technique could be adapted to most lighting conditions.
Posted by: scalbers Apr 8 2016, 10:23 PM
Just a reminder of how I like to show a full sky (cylindrical projection) sky brightness on Mars, based on some scattering calculations for a progression of solar elevation angles.
http://laps.noaa.gov/albers/allsky/mars/allsky_rgb_cyl_mars.gif
Posted by: jccwrt Apr 10 2016, 07:42 PM
http://laps.noaa.gov/albers/allsky/mars/allsky_rgb_cyl_mars.gif
Thanks, I'll keep that in hand for future panoramas!
Here are a couple of RMI observations of dune fields around the base of Mt. Sharp on Sols 507 and 517.
https://flic.kr/p/FC4qtA
https://flic.kr/p/G1BZDu
Also had the opportunity to do another bit of HDR-type photography with a sunset (er, Earthset) picture acquired on Sol 529:
https://flic.kr/p/FXzf4f
For this I used PIA17936 as a base, then added some foreground images of Gale Crater acquired during the afternoon of Sol 530. The brightness has been boosted a bit to subjectively match what I think a dark-adapted human eye would see, but there was some distinction between the foreground ridge (the north wall of Dingo Gap) and the crater rim in the original picture.
If you're having any trouble download these, click on the pictures to go to the gallery page, and then add 'sizes/o' to the end of the url. That should bring up the full-size image, which you can then right-click and save as.
Posted by: jccwrt Apr 15 2016, 04:55 PM
A group of RMI mosaics targeting The Kimberley's "North End Outcrop", showing some of the varied lithologies on display there.
https://flic.kr/p/Gh6Ame
It's really neat to see the variation in grain sizes. The bottom layers have a wide variation in grain size , while the upper layers are much finer overall and almost have a laminated texture to them. Really neat outcrop to study in general.
Posted by: jccwrt Apr 21 2016, 12:12 AM
Phobos setting behind Mt. Sharp.
https://flic.kr/p/FwNyE8
https://flic.kr/p/FwNyE8 by https://www.flickr.com/photos/132160802@N06/, on Flickr
For this one I did some noise reduction on a single frame taken by MastCam (M-34) on the evening of Sol 613. The composition of that image wasn't very balanced, so I added a bit of foreground in using some frames from a 360 mosaic taken on Sol 610. Fortunately, these frames were taken in the anti-solar direction - almost no shadows! I adjusted the color to match the illumination conditions better, and blended them all together. I also boosted the contrast on Phobos a little bit to bring out a couple of surface features. I hope you all enjoy it!
Posted by: neo56 Apr 21 2016, 06:48 AM
Amazing work Justin! Thanks for sharing it with us.
Posted by: Herobrine May 18 2016, 09:33 AM
Not really sure the best place to post this, so I'll post it here.
Since Friday, a friend and I have been working to try to generate a tolerable VR experience chronicling the journey toward Mt. Sharp from Curiosity's landing site.
I don't know if we've reached tolerable yet, but we've decided to stop working on it for now as it consumes a tremendous amount of storage and processing resources that we need for other things, so we've decided to share the two main products that have come out of it.
The first is a 900+ frame 360-degree video (assuming your browser/platform supports playback of 360 YouTube videos) at 4K resolution that combines 58,589 images from MASTCAM, MARDI, and the Left NAVCAM.
https://www.youtube.com/watch?v=qHJemCKbhF4
Each frame represents a distinct drive counter at which imagery was acquired by any of the three cameras included. Each frame of new imagery is drawn over the previous frame and, at times, it may just be a small area that is changing from frame to frame.
The MARDI and MASTCAM imagery is forced to grayscale for consistency with the Left NAVCAM which provides the bulk of the coverage.
We keep all of the imagery oriented based on the site frame (which is aligned to NSEW) rather than the rover nav frame, so Mt. Sharp stays in the same place throughout the entire video.
The second is a headache-inducing (though still fairly immersive) 3-D 360 VR video at 5K resolution, intended to be viewed with a stereoscopic headset (Cardboard and the like). It's kind of like you're riding atop Curiosity as it makes its way toward Mt. Sharp.
https://www.youtube.com/watch?v=jgjse9fGypA
The left eye is seeing imagery from the Left NAVCAM and the Left MASTCAM. The right eye is seeing imagery from the Right NAVCAM and the Right MASTCAM. Somewhere approaching 100,000 (probably in the 75,000-85,000 range) images from these cameras are combined to create this video. Color imagery has been allowed (in fact, preferred) when available, and the rest of the imagery has been tinted by a vertical gradient calculated from the available color imagery to reduce the headache you'll experience as your brain tries to match NAVCAM imagery in one eye to MASTCAM imagery in the other. For this video, rather than present every drive counter with imagery as its own frame, the 900+ frames originally generated by the process were further processed to guarantee that significant changes over at least half of the horizontal range must occur before a new frame is allowed, reducing the frame set to a final length of 361 frames, played here at 2 frames per second.
Posted by: pgrindrod May 19 2016, 08:20 AM
Herobrine - I really admire this attempt, thanks for sharing!
I have to declare an interest, as I recently got a small grant in the UK to trial using VR for giving public engagement talks about Mars. We're going to build a simple app for Google Cardboard, and provide all the viewers for the audience, but the one thing I am lacking at the moment is a good set of image data.
It'll most likely involve a tour through MSL's mission so far, and so I've been trying to collate specific images that might be good for VR. So seeing you put all the images together in a VR video was very impressive! But to keep the size of the app down we're unlikely to run video, and just use a series of images instead.
So I was wondering if you know of any good sources for these VR scenes, or have outputted any particular good VR 'frames' from your videos that could be used by others. Of course, any other tips would be a great help.
Keep up the good work!
Posted by: Herobrine May 19 2016, 06:24 PM
Well, I'll say that I wouldn't recommend using the frames we produced for the video. The video frames were produced by an entirely automated process; no manual work was done on any of the input images or output frames. The resulting frames suffer from a myriad of issues. To name a few: there are extreme NAVCAM frame brightness inconsistencies; nothing is stitched (it's all just projected naively using the camera model defined by the input data product); all sorts of different undesirable imagery is included in the frames (some minimal filtering was incorporated into the automated process, like not including images with negative solar elevations, but images of calibration targets, checkouts of instruments, MASTCAM imaging of the arm/turret, etc. still appear); floating hilltops and rover structure get left behind until new imagery finally covers them; MASTCAM and NAVCAM imagery are blindly included together for each eye, despite MASTCAM having a 24.5 cm stereo baseline while NAVCAM's is 42.4 cm (they're not even close). Some of those issues contribute heavily to the headache-inducing quality of the video, but most are minimized by the motion and constantly changing imagery, so your brain can smooth out some of the flaws and inconsistencies temporally and make some sense of it.
When you're dealing with a single static frame, you're going to want a much more consistent, seamless full-sphere stereo pair, which means careful selection and manual editing.
A typical human has an interpupillary distance of around 6.5 cm, so MASTCAM's 24.5 is more reasonable than NAVCAM's 42.4. Between the two, MASTCAM is also the only one that acquires color imagery, so it has that going for it, which is nice. The HAZCAMs get you much closer to a human stereo baseline but they're just too low to the ground and you're never going to get decent coverage using them. MASTCAM and NAVCAM are at a pretty good height. They're up at the height of a freakishly tall person's eyes, which is fine; the extra height helps a little with the exaggerated stereo baseline.
For the sky, I'd recommend not using MSL imagery at all. scalbers has a nice GIF of simulated Martian sky scattering for different solar elevations somewhere around here.
....Here it is: http://laps.noaa.gov/albers/allsky/mars/allsky_rgb_cyl_mars.gif
I'd pick a solar elevation you like from there and use that as your sky. For the rest, ideally, you'd identify places where Curiosity acquired 360 MASTCAM mosaics and use that for most of the lower half of your sphere. Different MASTCAM mosaics yield different coverage, so identifying the ones with the most imagery would be helpful. One of your biggest challenges is likely to be getting decent right-eye MASTCAM coverage. There are a fair number of left MASTCAM mosaics with decent coverage, but decent right MASTCAM coverage is hard to find.
I would have looked into that early this morning, because I'm interested too, but all of the MSL data volumes in PDS, except for MSLNAV_1XXX, vanished last night and only just reappeared about 5 minutes ago (and have been phasing in and out of some transient existence since then, but mostly seem to be back now).
I'm pretty sure I've seen at least one place where right MASTCAM had pretty good sphere coverage; I'll check later.
Once you have a sky and some decent-though-patchy MASTCAM coverage, you're mostly left with NAVCAM to fill in the rest (MAHLI has good coverage at times, since it does self-portraits, but that's never going to combine with MASTCAM imagery for good stereo). You could just fill in the blanks with NAVCAM and tint it with a hue and saturation similar to the surrounding MASTCAM imagery, but you're going to have depth inconsistency across that boundary due to the difference in stereo baseline. Compared to most VR experiences I've viewed, that probably isn't the worst thing in the world.
It would be possible, however, using the XYZ data products for NAVCAM, to reproject the surface geometry from a right NAVCAM frame into the camera model for the right MASTCAM, which would correct the depth inconsistency. I've actually done that before with good results. The parallax from the right NAVCAM to the right MASTCAM is pretty small, so occlusion doesn't cause much of a problem for reprojection (at least, it won't in most cases). NAVCAM's XYZ data only reaches out to a certain distance, so you won't be reprojecting Mt. Sharp (not that you'd need to) or anything, but it's likely that most of your MASTCAM coverage gap is going to be near the bottom of your sphere anyway, so a lack of geometry data near the horizon isn't likely to be a big issue. For the very bottom of the sphere, you might get lucky and find a MARDI frame at that spot, but I guess that might not even matter, depending on whether you want them to see terrain or rover deck when they look down.
Tonight, if I have time, I'll run a script over the MASTCAM index file and have it spit out places with the best right (and left) MASTCAM coverage. I'll let you know what I find.
Posted by: yogi May 19 2016, 08:26 PM
I have to declare an interest, as I recently got a small grant in the UK to trial using VR for giving public engagement talks about Mars. We're going to build a simple app for Google Cardboard, and provide all the viewers for the audience, but the one thing I am lacking at the moment is a good set of image data.
This sounds a bit like my https://play.google.com/store/apps/details?id=org.codepilot.mars (inspired by Midnight Planets for iOS), and I now live in London. I can't be involved in your grant since I'm otherwise employed, but perhaps we should chat (in person, if you're also in London)?
Posted by: Herobrine May 19 2016, 09:09 PM
I did a scripted check of the MASTCAM index file, filtering out thumbnails (I only allowed letters C and E), additional versions of another image (C00 vs E01 vs E02), anything monochromatic, anything taken when the Sun was below the horizon, anything labeled as a "redo" or "reshoot" (to avoid double counting), anything described as being for calibration, and anything not actually imaging the Martian terrain (instrument assessment, Sun imaging, etc.) and, given those criteria, it looks like Site 6 Drive 0 is the winner for most right MASTCAM coverage, at least in terms of number of images (there may be some overlapping areas of coverage).
The right MASTCAM acquired useful (for your purposes) imagery from that position on Sols 166, 172, 173, 179, 184-186, 188, 189, 192-194, 198, 199, 227, 232-234, and 269-271, for a total of 1,163 images.
Next best were (Site/Drive):
5/104 with 858 images
6/704 with 570 images
5/388 with 537 images
31/1330 with 487 images
6/804 with 338 images
5/1858 with 287 images
30/740 with 275 images
48/1570 with 220 images
There's a pretty big gap where no drive positions have 200 or more right MASTCAM images. The best right MASTCAM image count between Site 7 and Site 29 was at 26/708 with 142 images. Between Site 7 and there, the best I found was at 15/1230 with 109 images.
I checked the rationale descriptions for all of the counted images at each of the drive positions listed above to make sure none of the images that survived the filtering sounded like something that shouldn't be included, so those should be reliable numbers.
Edit:
Performing the same scripted check, but for left MASTCAM, the best (any position with over 200 images) were:
6/0 (again) with 1,135 images
31/1330 with 701 images
5/388 with 626 images
6/704 with 570 images
6/804 with 379 images
5/1858 with 378 images
31/0 with 356 images
30/740 with 302 images
49/1216 with 291 images
27/1124 with 241 images
50/848 with 237 images
48/1570 with 220 images
49/2626 with 213 images
26/1102 with 211 images
The ones I listed separately for right MASTCAM, 26/708 and 15/1230, had 170 and 166 left MASTCAM images, respectively.
5/104, which had 858 for right had only 64 for left, but keep in mind that the left MASTCAM has a larger field of view, so fewer are needed to provide good coverage.
Posted by: elakdawalla May 19 2016, 09:19 PM
Also good would be the MAHLI self-portraits.
The Rocknest and John Klein sites are the best in terms of moderately complete 360-degree coverage in both left and right eyes, but of course Mastcam never imaged the deck until Namib Dune so even relatively complete pans are frustratingly incomplete for VR purposes. I worked with some folks at Google to do some Cardboard VR projects with Mars data and we found it much more satisfying to go back to Spirit data. The Spirit story was highly satisfying as told through Google Cardboard VR.
Posted by: yogi May 19 2016, 10:14 PM
Emily, would you mind telling me through private message (here or via public@tobias-thierer.de) who at Google you worked with? I work at Google myself and would love to connect with like minded co-workers. Alternatively tell them my name (Tobias Thierer) and ask them to contact me internally.
Posted by: Herobrine May 20 2016, 02:35 AM
@pgrindrod
I put together an example of some of the stuff I suggested.
https://www.youtube.com/watch?v=UyviCsjGsfg
You'll probably want to pause it after it starts because it only lasts 10 seconds.
That's all of the Site 6 Drive 0 MASTCAM imagery that survived the filtering criteria I mentioned before.
The left eye is made from 1,133 ML frames and the right eye is made from 1,100-some MR frames.
Still no stitching, and the 360 mosaic was generated automatically by a program I wrote, but I did do some manual combining of a version that averages overlapping imagery and a version that just draws the newer imagery on top of the older imagery. I took a frame from scalbers' GIF and overlaid some extra dust on it to better match the imagery at the horizon and put that behind everything as my sky. I didn't try to add NAVCAM imagery as filler yet; I might later. At least this serves as a reference for what you can get with minimal effort and best-case imagery availability.
Posted by: sittingduck May 25 2016, 06:53 PM
The amazing blender plugin and video by phase4 inspired me to pick up blender and try it out. Here are some results!
A black&white tour skirting around Mount Remarkable back at the Kimberley:
https://www.youtube.com/watch?v=qwrqC3CDukI
A color video near Mount Remarkable, this time over a much more limited area. Here I manually warped mastcam color imagery to the navcam meshes.
https://www.youtube.com/watch?v=pHKYYaswDkA
A combination of MGS HRSC, MRO HiRise, Navcam and Mastcam data to create a large sweeping path over both Mount Sharp all the way back down to the Kimberley again, all in color, this time with a little more movement around Mount Remarkable. This last video had some serious rendering artifacts so the camera movement is a little awkward to pan/crop all those bits out (watch out if you are easily made motion-sick!).
https://www.youtube.com/watch?v=ik-nW1RMzaM&feature=youtu.be
A second version of the first b&w video with the levels unadjusted:
https://www.youtube.com/watch?v=mrZYHkRZ7-g
Enjoy!
Posted by: sittingduck Jun 1 2016, 10:09 AM
Here is one more again using Phase4's plugin, comprising 3 separate sites; one on sol 595, and two on sol 603. All have been colorized using Mastcam images.
https://www.youtube.com/watch?v=WzP3Is700cY
Posted by: Sean Jun 1 2016, 10:42 AM
Many thanks for sharing your incredible work Sittingduck! This is exactly the kind of thing I wanted to see but my Blender-fu was not up to task.
If I can suggest possibly making the videos longer...a lot longer. There is a lot to see!
The transition from Mt Sharp to Remarkable was especially good.
Really looking forward to seeing what you come up with next.
Posted by: Glevesque Jun 1 2016, 03:02 PM
https://www.youtube.com/watch?v=WzP3Is700cY
all simply magnificent sittingduck
Posted by: sittingduck Jun 21 2016, 08:57 AM
Another Mastcam colorized animation using Phase4's plugin, this time of Marias Pass.
Navcam images cover sols 991-995. The background panorama of Mt.Sharp is from Sol 1081, the nearest quality one I could find, edited to match the mid-ground with that of the Sol 99x areas.
https://www.youtube.com/watch?v=7zW9yISB01Y&feature=youtu.be
Posted by: PaulH51 Jun 21 2016, 10:13 AM
Another gem
Posted by: sittingduck Jul 15 2016, 07:02 PM
I have finished another video animation of a location in Gale crater; this time Yellowknife Bay on sol 133-137.
https://www.youtube.com/watch?v=94giGbUAsJw
Posted by: Vanden Jul 15 2016, 08:50 PM
Wow great !
Posted by: Sean Jul 15 2016, 10:08 PM
This is so impressive Sittingduck, thanks for sharing! Would you consider rendering in 3D? ( SBS or OU )
I'd also love some insight into the process of mapping the Mastcam imagery to Navcam meshes...is it a case of manually assigning the Mastcam images to Navcam texture?
Posted by: sittingduck Jul 15 2016, 10:43 PM
I'd also love some insight into the process of mapping the Mastcam imagery to Navcam meshes...is it a case of manually assigning the Mastcam images to Navcam texture?
Thanks. Yes I will try a 3D render, also stereo-anaglyph.
To get the colored terrain I first stitch together the mastcam images that coincide with a navcam mesh. Then I use photoshop to manually warp the mastcam panorama onto the navcam texture that comes along with the mesh. It is a bit tedious. Often there is no color coverage or the color pictures cover only a fraction of the entire mesh. With Yellowknife Bay, color coverage of the meshes was virtually complete.
Posted by: Sean Jul 15 2016, 11:07 PM
Manual warping is a lot of work. I've been down that rabbit hole...but in this case the results are worth it!
Posted by: scalbers Jul 15 2016, 11:14 PM
These are the most impressive 3D animations I've yet seen. I wonder if any associated 3D model data files might be available for VR viewing?
Posted by: scalbers Jul 17 2016, 01:49 PM
Here is a nice interface that eyes.nasa.gov has. This might have potential to also add the ground based images (and photogrammetry) as 3D information.
http://eyes.nasa.gov/curiosity/
Posted by: mhoward Jul 22 2016, 09:37 PM
Amazing work, sittingduck. (And thanks for the thanks.)
Posted by: Vanden Jul 23 2016, 12:33 PM
Hello,
It's possible to create a 3d stereoscopic version ?
In full SBS (3840x1080) @ 48fps or 60fps ?
Posted by: Sean Jul 26 2016, 05:31 PM
Here is a preview of a short film I'm putting together of Curi traversing Naukluft plateau...
https://flic.kr/p/JA1CMF
...building on previous shots, this time blending a spherical 360 Mastcam photomosaic mapped to HiRISE orbital data of the equivalent terrain which enables a model of Curi to be 'driven' through the scene.
This shot uses a panorama from Sol 1282. Final version uses 4 pano's covering the 100 Sol traverse ( 1267 to 1367 )
I took liberties with the route, Curi's method of driving and most obviously the speed limit! I really wanted to see Curi move through the landscape, so this idea is more about appreciating the environment and using Curi as a contextual cue with which to view the scene afresh.
Almost every aspect of this production is subject to change and/or improvement so hopefully the finished article will feel slightly less cartoony.
Posted by: PaulH51 Aug 1 2016, 10:28 PM
Mars Science Laboratory Release 12
The NASA Planetary Data System announces the twelfth release of data from the Mars Science Laboratory (MSL) mission, covering data acquired from Sol 1160 through Sol 1293 (November 10, 2015, to March 27, 2016).
This release consists of raw and derived data sets from the following instruments:
Alpha Particle X-ray Spectrometer (APXS)
Chemistry & Micro-Imaging (ChemCam)
Chemistry and Mineralogy (CheMin)
Dynamic Albedo of Neutrons (DAN)
Hazard Avoidance Cameras (Hazcam)
Mars Hand Lens Imager (MAHLI)
Mars Descent Imager (MARDI)
Mast-mounted Cameras (Mastcam)
Navigation Cameras (Navcam)
Position Localization and Attitude Correction Estimate Storage (PLACES)
Radiation Assessment Detector (RAD)
Rover Environmental Monitoring Station (REMS)
Sample Analysis at Mars (SAM)
Spacecraft, Planet, Instrument, Pointing C-Matrix, and Event kernels (SPICE)
To access the above data for this release:
https://pds.nasa.gov/tools/subscription_service/SS-20160801.shtml
Posted by: PaulH51 Dec 5 2016, 11:42 PM
Mars Science Laboratory Release 13
The NASA Planetary Data System announces the thirteenth release of data from the Mars Science Laboratory (MSL) mission, covering data acquired from Sol 1294 through Sol 1417 (March 27, 2016, to August 1, 2016).
This release consists of raw and derived data sets from the following instruments:
Alpha Particle X-ray Spectrometer (APXS)
Chemistry & Micro-Imaging (ChemCam)
Chemistry and Mineralogy (CheMin)
Dynamic Albedo of Neutrons (DAN)
Hazard Avoidance Cameras (Hazcam)
Mars Hand Lens Imager (MAHLI)
Mars Descent Imager (MARDI)
Mast-mounted Cameras (Mastcam)
Navigation Cameras (Navcam)
Position Localization and Attitude Correction Estimate Storage (PLACES)
Radiation Assessment Detector (RAD)
Rover Environmental Monitoring Station (REMS)
Sample Analysis at Mars (SAM)
Spacecraft, Planet, Instrument, Pointing C-Matrix, and Event kernels (SPICE)
To access the above data for this release: https://pds.nasa.gov/tools/subscription_service/SS-20161205.shtml
Posted by: jccwrt Feb 7 2017, 02:06 AM
A few mosaics I've been putting together from the Zabriskie Plateau/Hidden Valley portion of the traverse. Most of these are just standard mosaics, but with the crater rim and sky patched in to give a fuller sense of what it would have been like to be standing there.
https://flic.kr/p/RNBrxb
https://flic.kr/p/RNBrxb
I particularly like this one. I don't think we ever got a full MastCam view of Hidden Valley once Curiosity was inside, just a couple shots from the entrance/exit point. Fortunately Curiosity took a drive-direction mosaic pointed high enough that I could use the stereo images taken during a survey of the valley rim the next day. After that I could patch in the horizon from a 360 traverse panorama from a few sols earlier.
https://flic.kr/p/RNQDf3
https://flic.kr/p/RNQDf3
Serene view of the crater floor from the rim of Hidden Valley:
https://flic.kr/p/RUxH92
https://flic.kr/p/RUxH92
Posted by: elakdawalla Feb 27 2017, 08:23 PM
For those of you who use MSL PDS data, I had an email conversation with Tom Stein at the Analyst's Notebook last week in which I discussed how I thought it would be better for the default product type on Mastcam images to be DRCX rather than DRCL and they seem to have made that switch. DRCL are "linearized" which means they're corrected for lens distortion but there's so little geometric distortion in Mastcam images that it just introduced a blur without much of any benefit. So now it feeds you DRCX by default instead -- color-calibrated but not linearized.
Posted by: elakdawalla Mar 1 2017, 08:15 PM
Another change has been made to the MSL analyst's notebook at my request. For the MMM cameras, when you download images, you can download them as PDS formatted IMGs, or as JPGs, or PNGs. I had assumed that the PNGs were made from the IMGs until I discovered that they contained JPG artifacts. They confirmed that the PNGs had been made from the JPGs. I asked whether they could make the PNGs from the IMGs instead, and they have now implemented that change. So now if you download a "0% stretch" PNG from the Analyst's Notebook, you will get an image that is identical to the archival IMG. Hooray!
Posted by: PaulH51 Mar 1 2017, 09:42 PM
Great news, huge thanks to Emily and the team running the PDS. Hopefully we will see more folk working with the PDS data
Posted by: elakdawalla Mar 1 2017, 10:30 PM
Just to be clear, some (in fact, most) of the data was originally downlinked from the rover with JPEG compression, so you'll still see those artifacts in images. You just won't be dealing with a second round of JPEG compression imposed upon the first.
Posted by: nogal Mar 17 2017, 12:04 AM
Mars Science Laboratory Release 14
The NASA Planetary Data System announces the fourteenth release of data from
the Mars Science Laboratory (MSL) mission, covering data acquired from
Sol 1418 through Sol 1514 (August 1, 2016 to November 9, 2016).
This release consists of raw and derived data sets from the following
instruments:
Alpha Particle X-ray Spectrometer (APXS)
Chemistry & Micro-Imaging (ChemCam)
Chemistry and Mineralogy (CheMin)
Dynamic Albedo of Neutrons (DAN)
Hazard Avoidance Cameras (Hazcam)
Mars Hand Lens Imager (MAHLI)
Mars Descent Imager (MARDI)
Mast-mounted Cameras (Mastcam)
Navigation Cameras (Navcam)
Position Localization and Attitude Correction Estimate Storage (PLACES)
Radiation Assessment Detector (RAD)
Rover Environmental Monitoring Station (REMS)
Sample Analysis at Mars (SAM)
Spacecraft, Planet, Instrument, Pointing C-Matrix, and Event kernels (SPICE)
To access the above data for this release:
https://pds.nasa.gov/tools/subscription_service/SS-20170316.shtml
Posted by: nogal Aug 1 2017, 10:16 PM
Mars Science Laboratory Release 15
The NASA Planetary Data System announces the fifteenth release of data from
the Mars Science Laboratory (MSL) mission, covering data acquired from
Sol 1515 through Sol 1648 (November 9, 2016, to March 26, 2017).
This release consists of raw and derived data sets from the following
instruments:
Alpha Particle X-ray Spectrometer (APXS)
Chemistry & Micro-Imaging (ChemCam)
Chemistry and Mineralogy (CheMin)
Dynamic Albedo of Neutrons (DAN)
Hazard Avoidance Cameras (Hazcam)
Mars Hand Lens Imager (MAHLI)
Mars Descent Imager (MARDI)
Mast-mounted Cameras (Mastcam)
Navigation Cameras (Navcam)
Position Localization and Attitude Correction Estimate Storage (PLACES)
Radiation Assessment Detector (RAD)
Rover Environmental Monitoring Station (REMS)
Sample Analysis at Mars (SAM)
Spacecraft, Planet, Instrument, Pointing C-Matrix, and Event kernels (SPICE)
To access the above data for this release:
https://pds.nasa.gov/tools/subscription_service/SS-20170801.shtml
Posted by: neo56 Aug 9 2017, 07:17 PM
On that day 5 years ago, Curiosity took its first color panorama. I stitched together this pano from the PDS PNG pics of sol 3 (+sol 13 for Mt Sharp).
Here it is https://roundme.com/tour/178748/view/460654/.
Posted by: nogal Dec 5 2017, 11:54 PM
Mars Science Laboratory Release 16
The NASA Planetary Data System announces the sixteenth release of data from
the Mars Science Laboratory (MSL) mission, covering data acquired from
Sol 1649 through Sol 1772 (March 26 to August 1, 2017).
This release consists of raw and derived data sets from the following
instruments:
Alpha Particle X-ray Spectrometer (APXS)
Chemistry & Micro-Imaging (ChemCam)
Chemistry and Mineralogy (CheMin)
Dynamic Albedo of Neutrons (DAN)
Hazard Avoidance Cameras (Hazcam)
Mars Hand Lens Imager (MAHLI)
Mars Descent Imager (MARDI)
Mast-mounted Cameras (Mastcam)
Navigation Cameras (Navcam)
Position Localization and Attitude Correction Estimate Storage (PLACES)
Radiation Assessment Detector (RAD)
Rover Environmental Monitoring Station (REMS)
Sample Analysis at Mars (SAM)
Spacecraft, Planet, Instrument, Pointing C-Matrix, and Event kernels (SPICE)
The Mastcam and MARDI releases include newly published technical papers, which are included in the Documents directory.
To access the above data for this release:
https://pds.nasa.gov/tools/subscription_service/SS-20171205.shtml
Posted by: Ant103 Dec 8 2017, 11:56 PM
Hi ![]()
Today I've been working on a previous pan I worked with, in March. But with the difference it was made with pds datas. And the result is way beyond expectations.
See bellow :
http://www.db-prods.net/blog/2017/12/08/curiosity-at-bagnold-dunes-remastered/
And for comparizon, the first version, made with bayererd-jpegized-unbayered pics :
http://www.db-prods.net/marsroversimages/curiosity-2017.php#8
Posted by: nprev Dec 9 2017, 01:22 AM
![]() ....that's just ridiculous. Astounding work, Damia.
....that's just ridiculous. Astounding work, Damia.
Posted by: PaulH51 Jan 6 2018, 10:22 AM
I realize that this is in the wrong thread but I dont know where to put it and I think it may be extremely useful to followers of MSL and MER missions.
The Analyst's Notebook has a wonderful measuring tool built into the drawing tool for stereo paired images. I accidentally discovered the tool while browsing the community forum.
Link to its Image Viewer help page https://an.rsl.wustl.edu/msl/mslbrowser/help/Content/Using%20the%20Notebook/Detail%20pages/Data/Image%20viewer.htm?tocpath=Using%20the%20Notebook%7CDetail%20pages%7CData%7CImage%20viewer
Link to the Measurement Tool help page https://an.rsl.wustl.edu/msl/mslbrowser/help/Content/Using%20the%20Notebook/Detail%20pages/Data/Image%20viewer%20measurement%20tools.htm
This https://geoweb.rsl.wustl.edu/community/index.php?/topic/686-msl-curiosity/ walks you through opening an example image and provides several screen shots on using the menus etc.
It's worth spending some time looking at this as it is really feature rich. I have tested it on MSL NavCams in the and James Sorenson tested on a selection of MER images also in the Analyst's Notebook
Example annotated NavCam frame from sol 1001:
Mods: Apologies if this was already covered by an earlier post. I will leave it to you to decide where this should be placed to get maximum attention. Moved! --Mod.
Posted by: jccwrt Jan 19 2018, 07:41 PM
Late dawn observation on Sol 782 (October 18, 2014), presumably attempting to image Comet Siding Spring in twilight. I didn't catch sight of the comet in the raw data (too faint and the sky too dusty) but it is a pretty spectacular scene.
https://flic.kr/p/22vWCq5
Posted by: fredk Jan 19 2018, 09:12 PM
Yeah, the comet was far from closest approach that morning, and I think was only spotted the next night on 783. Check out the http://www.unmannedspaceflight.com/index.php?showtopic=7866&st=45&p=214005&#entry214005 for more details.
Posted by: jccwrt Jan 22 2018, 04:01 AM
Curiosity took a kernel of a great MastCam mosaic on Sol 959 as it exited Artist's Drive. I've filled in a few gaps with a fortuitous MAHLI mosaic that was taken on the previous sol, and from a MastCam pan that was taken on Sol 931.
https://flic.kr/p/E29CTk
Posted by: nogal Mar 17 2018, 02:35 PM
Mars Science Laboratory Release 17
The NASA Planetary Data System announces the seventeenth release of data from
the Mars Science Laboratory (MSL) mission, covering data acquired from
Sol 1773 through Sol 1869 (August 1 to November 8, 2017).
This release consists of raw and derived data sets from the following
instruments:
Alpha Particle X-ray Spectrometer (APXS)
Chemistry & Micro-Imaging (ChemCam)
Chemistry and Mineralogy (CheMin)
Dynamic Albedo of Neutrons (DAN)
Hazard Avoidance Cameras (Hazcam)
Mars Hand Lens Imager (MAHLI)
Mars Descent Imager (MARDI)
Mast-mounted Cameras (Mastcam)
Navigation Cameras (Navcam)
Position Localization and Attitude Correction Estimate Storage (PLACES)
Radiation Assessment Detector (RAD)
Rover Environmental Monitoring Station (REMS)
Sample Analysis at Mars (SAM)
Spacecraft, Planet, Instrument, Pointing C-Matrix, and Event kernels (SPICE)
To access the above data for this release:
https://pds.nasa.gov/tools/subscription_service/SS-20180316.shtml
Links to all MSL data sets may be found on the PDS Geosciences Node web
site http://pds-geosciences.wustl.edu/missions/msl/. The data may also
be reached from the main PDS home page, https://pds.nasa.gov/. MSL data
are archived at the PDS Atmospheres, Planetary Plasma Interactions
(PPI), Geosciences, Imaging, and Navigation and Ancillary Information
Facility (NAIF) Nodes.
Posted by: Blue Sky Apr 30 2018, 06:09 PM
Where can I find reports and papers that actually draw conclusions from MSL data? I have seen many reports of the form "We are going to go over there to look at possible Hematite etc" but not a lot of "Here is what we found and here are the implications."
Within a year of landing MSL did confirm one thing it was sent to find, which is "There was a lot of water on Mars a long time ago." Ohhhkay. But that was over 5 years ago. I have seen all the pretty pictures, which tell me that most of the parts of Mars we have visited look to the non-geologist a whole lot like all the other parts of Mars we have visited. I have more variety of rocks in my back yard. Maybe a future mission to more volcanic areas will provide something different.
But in the meantime, where are the papers on what has ben learned since starting up Mt Sharp?
Posted by: djellison Apr 30 2018, 07:15 PM
This PDF
https://mars.nasa.gov/files/mep/msl_sci_team_key_papers.pdf
Has links out to a LOT of MSL science results.
Posted by: nogal Aug 1 2018, 11:26 PM
Mars Science Laboratory Release 18
The NASA Planetary Data System announces the 18th release of data from
the Mars Science Laboratory (MSL) mission, covering data acquired from
Sol 1870 through Sol 2003 (November 8, 2017, to March 26, 2018).
This release consists of raw and derived data sets from the following
instruments:
Alpha Particle X-ray Spectrometer (APXS)
Chemistry & Micro-Imaging (ChemCam)
Chemistry and Mineralogy (CheMin)
Dynamic Albedo of Neutrons (DAN)
Hazard Avoidance Cameras (Hazcam)
Mars Hand Lens Imager (MAHLI)
Mars Descent Imager (MARDI)
Mast-mounted Cameras (Mastcam)
Navigation Cameras (Navcam)
Position Localization and Attitude Correction Estimate Storage (PLACES)
Radiation Assessment Detector (RAD)
Rover Environmental Monitoring Station (REMS)
Sample Analysis at Mars (SAM)
Spacecraft, Planet, Instrument, Pointing C-Matrix, and Event kernels (SPICE)
To access the above data, please visit the following link:
https://pds.nasa.gov/datasearch/subscription-service/SS-20180801.shtml
Links to all MSL data sets may be found on the PDS Geosciences Node web
site http://pds-geosciences.wustl.edu/missions/msl/. The data may also
be reached from the main PDS home page, https://pds.nasa.gov/. MSL data
are archived at the PDS Atmospheres, Planetary Plasma Interactions
(PPI), Geosciences, Imaging, and Navigation and Ancillary Information
Facility (NAIF) Nodes.
PDS offers two services for searching the MSL archives:
The Planetary Image Atlas at the Imaging Node allows selection of MSL
image data by specific search criteria.
http://pds-imaging.jpl.nasa.gov/search/
The MSL Analyst's Notebook at the Geosciences Node allows searching and
downloading of all MSL data in the context of mission events.
http://an.rsl.wustl.edu/msl
The PDS Team
Mailto: pds_operator@jpl.nasa.gov
Phone: (818) 393-7165
Posted by: PaulH51 Aug 2 2018, 01:28 AM
....covering data acquired from Sol 1870 through Sol 2003 (November 8, 2017, to March 26, 2018).
You know Curi's been on a good walkabout when you find 'Sgurr of Eigg' images in the PDS
Posted by: jccwrt Nov 24 2018, 09:46 PM
Early morning mosaic of Mt. Sharp on Sol 1100
https://flic.kr/p/PmpPwi
https://flic.kr/p/PmpPwi
Posted by: PaulH51 Nov 26 2018, 01:32 AM
Lovely processing...
Posted by: nogal Dec 5 2018, 11:51 PM
Mars Science Laboratory Release 19
The NASA Planetary Data System announces the 19th release of data from the Mars Science Laboratory (MSL) mission, covering data acquired from
Sol 2004 through Sol 2127 (March 26, 2018, to August 1, 2018).
This release consists of raw and derived data sets from the following
instruments:
Alpha Particle X-ray Spectrometer (APXS)
Chemistry & Micro-Imaging (ChemCam)
Chemistry and Mineralogy (CheMin)
Dynamic Albedo of Neutrons (DAN)
Hazard Avoidance Cameras (Hazcam)
Mars Hand Lens Imager (MAHLI)
Mars Descent Imager (MARDI)
Mast-mounted Cameras (Mastcam)
Navigation Cameras (Navcam)
Position Localization and Attitude Correction Estimate Storage (PLACES)
Radiation Assessment Detector (RAD)
Rover Environmental Monitoring Station (REMS)
Sample Analysis at Mars (SAM)
Spacecraft, Planet, Instrument, Pointing C-Matrix, and Event kernels (SPICE)
To access the above data, please visit the following link:
https://pds.nasa.gov/datasearch/subscription-service/SS-20181205.shtml
Links to all MSL data sets may be found on the PDS Geosciences Node web
site http://pds-geosciences.wustl.edu/missions/msl/. The data may also
be reached from the main PDS home page, https://pds.nasa.gov/. MSL data
are archived at the PDS Atmospheres, Planetary Plasma Interactions
(PPI), Geosciences, Imaging, and Navigation and Ancillary Information
Facility (NAIF) Nodes.
PDS offers two services for searching the MSL archives:
The Planetary Image Atlas at the Imaging Node allows selection of MSL
image data by specific search criteria.
http://pds-imaging.jpl.nasa.gov/search/
The MSL Analyst's Notebook at the Geosciences Node allows searching and
downloading of all MSL data in the context of mission events.
http://an.rsl.wustl.edu/msl
The PDS Team
Mailto: pds_operator@jpl.nasa.gov
Phone: (818) 393-7165
Posted by: jccwrt Dec 15 2018, 12:51 AM
New release has the arrival of the MY34 global dust storm and the first half of its decay. Been experimenting with different ways to show the variation in atmospheric opacity. Best I've been able to do so far is a panoramic view of the Gale Crater rim, but I think it's something I need to revisit after the next release.
There were also some left MastCam color images of the Sun on days with dramatically different taus, but I don't know the exact tau values to attach to to them.
Posted by: phase4 Dec 17 2018, 01:40 PM
I’m trying to update my Blender script and unfortunately I’m having some troubles locating images on PDS.
The script needs the XYZ and RAS image products, they were available from these directories;
XYZ: https://pdsimg.jpl.nasa.gov/data/msl/MSLNAV_1XXX/DATA/
RAS: https://pdsimg.jpl.nasa.gov/data/msl/MSLNAV_1XXX/EXTRAS/FULL/
I noticed that data from before sol 1870 has been moved elsewhere or has been erased.
Are these images still available somewhere?
Posted by: djellison Dec 20 2018, 11:03 PM
I got a note from MSL Dept.Proj. Scientist Joy Crisp on this.....
https://pdsimg.jpl.nasa.gov/data/msl/MSLNAV_1XXX/DATA_V1/
https://pdsimg.jpl.nasa.gov/data/msl/MSLNAV_1XXX/EXTRAS_V1/FULL/
You can always start at the top of the directory structure here for archived MSL images: https://pds-imaging.jpl.nasa.gov/volumes/msl.html, click on a green server icon and drill down through the directories.
Posted by: neo56 Dec 26 2018, 05:47 PM
There were also some left MastCam color images of the Sun on days with dramatically different taus, but I don't know the exact tau values to attach to to them.
Nicely done Justin! It's very interesting to see the evolution of tau that way. For the panoramic photomontage, are you sure the exposure time is the same for each photo ? (to know if the variation in hue is due to varying opacity or something else).
Posted by: jccwrt Dec 26 2018, 10:50 PM
Hmm, i had just assumed that the exposure would have a set value since it's part of a standardized measurement. I will double check in the .lbl files when I get a chance. That said I think the darkest days correspond well to what I've been able to glean from the mission team (Sol 2084 was the darkest day from overhead Sol measurements; Sol 2087 was the highest opacity from crater rim measurements).
Posted by: Deimos Dec 27 2018, 03:52 AM
That set of images uses auto-exposure. The tau images are manually exposed, but the exposures are tailored to the circumstance as of the commanding time. For the horizon set, one thing to note is that the low-Sun ones will not look like the same trend as the high Sun ones without special care.
Here's my current desktop background, made using early sols and excluding low-Sun observations (with opacity based on Lemmon et al. AGU poster... ![]() ).
).
Posted by: jccwrt Dec 27 2018, 05:18 AM
Good to know. I did take care to separate the high Sun images from the low Sun images; my panoramic view uses the latter.
Posted by: nogal Mar 15 2019, 06:17 PM
Mars Science Laboratory Release 20
The NASA Planetary Data System announces the 20th release of data from
the Mars Science Laboratory (MSL) mission, covering data acquired from
Sol 2128 through Sol 2224 (August 1, 2018, to November 8, 2018).
This release consists of raw and derived data sets from the following
instruments:
Alpha Particle X-ray Spectrometer (APXS)
Chemistry & Micro-Imaging (ChemCam)
Chemistry and Mineralogy (CheMin)
Dynamic Albedo of Neutrons (DAN)
Hazard Avoidance Cameras (Hazcam)
Mars Hand Lens Imager (MAHLI)
Mars Descent Imager (MARDI)
Mast-mounted Cameras (Mastcam)
Navigation Cameras (Navcam)
Position Localization and Attitude Correction Estimate Storage (PLACES)
Radiation Assessment Detector (RAD)
Rover Environmental Monitoring Station (REMS)
Sample Analysis at Mars (SAM)
Spacecraft, Planet, Instrument, Pointing C-Matrix, and Event kernels (SPICE)
To access the above data, please visit the following link:
https://pds.nasa.gov/datasearch/subscription-service/SS-20190316.shtml
Links to all MSL data sets may be found on the PDS Geosciences Node web
site http://pds-geosciences.wustl.edu/missions/msl/. The data may also
be reached from the main PDS home page, https://pds.nasa.gov/. MSL data
are archived at the PDS Atmospheres, Planetary Plasma Interactions
(PPI), Geosciences, Imaging, and Navigation and Ancillary Information
Facility (NAIF) Nodes.
PDS offers two services for searching the MSL archives:
The Planetary Image Atlas at the Imaging Node allows selection of MSL
image data by specific search criteria.
http://pds-imaging.jpl.nasa.gov/search/
The MSL Analyst's Notebook at the Geosciences Node allows searching and
downloading of all MSL data in the context of mission events.
http://an.rsl.wustl.edu/msl
The PDS Team
Mailto: pds_operator@jpl.nasa.gov
Phone: (818) 393-7165
Posted by: nogal Aug 1 2019, 07:55 PM
Mars Science Laboratory Release 21
The NASA Planetary Data System announces the 21st release of data from the Mars Science Laboratory (MSL) mission, covering data acquired from
Sol 2225 through Sol 2358 (November 8, 2018, to March 26, 2019).
This release consists of raw and derived data sets from the following
instruments:
Alpha Particle X-ray Spectrometer (APXS)
Chemistry & Micro-Imaging (ChemCam)
Chemistry and Mineralogy (CheMin)
Dynamic Albedo of Neutrons (DAN)
Hazard Avoidance Cameras (Hazcam)
Mars Hand Lens Imager (MAHLI)
Mars Descent Imager (MARDI)
Mast-mounted Cameras (Mastcam)
Navigation Cameras (Navcam)
Position Localization and Attitude Correction Estimate Storage (PLACES)
Radiation Assessment Detector (RAD)
Rover Environmental Monitoring Station (REMS)
Sample Analysis at Mars (SAM)
Spacecraft, Planet, Instrument, Pointing C-Matrix, and Event kernels (SPICE)
To access the above data, please visit the following link:
https://pds.nasa.gov/datasearch/subscription-service/SS-20190801.shtml
Links to all MSL data sets may be found on the PDS Geosciences Node web
site http://pds-geosciences.wustl.edu/missions/msl/. The data may also
be reached from the main PDS home page, https://pds.nasa.gov/. MSL data
are archived at the PDS Atmospheres, Planetary Plasma Interactions
(PPI), Geosciences, Imaging, and Navigation and Ancillary Information
Facility (NAIF) Nodes.
PDS offers two services for searching the MSL archives:
The Planetary Image Atlas at the Imaging Node allows selection of MSL
image data by specific search criteria.
http://pds-imaging.jpl.nasa.gov/search/
The MSL Analyst's Notebook at the Geosciences Node allows searching and
downloading of all MSL data in the context of mission events.
http://an.rsl.wustl.edu/msl
The PDS Team
Mailto: pds_operator@jpl.nasa.gov
Phone: (818) 393-7165
Posted by: PaulH51 Dec 6 2019, 02:17 AM
The NASA Planetary Data System announces the 22nd release of data from the Mars Science Laboratory (MSL) mission, covering data acquired from Sol 2359 through Sol 2482 (March 26, 2019, to July 31, 2019).
This release consists of raw and derived data sets from the following instruments:
Alpha Particle X-ray Spectrometer (APXS)
Chemistry & Micro-Imaging (ChemCam)
Chemistry and Mineralogy (CheMin)
Dynamic Albedo of Neutrons (DAN)
Hazard Avoidance Cameras (Hazcam)
Mars Hand Lens Imager (MAHLI)
Mars Descent Imager (MARDI)
Mast-mounted Cameras (Mastcam)
Navigation Cameras (Navcam)
Position Localization and Attitude Correction Estimate Storage (PLACES)
Radiation Assessment Detector (RAD)
Rover Environmental Monitoring Station (REMS)
Sample Analysis at Mars (SAM)
Spacecraft, Planet, Instrument, Pointing C-Matrix, and Event kernels (SPICE)
REMS includes a new dataset, MSL-M-REMS-5-UVRDR-V1.0, Environmental Monitoring Station UV fluxes.
To access the above data, please visit the following link: https://pds.nasa.gov/datasearch/subscription-service/SS-20191205.shtml
Links to all MSL data sets may be found on the PDS Geosciences Node web site http://pds-geosciences.wustl.edu/missions/msl/. The data may also be reached from the main PDS home page, https://pds.nasa.gov/. MSL data are archived at the PDS Atmospheres, Planetary Plasma Interactions (PPI), Geosciences, Imaging, and Navigation and Ancillary Information
Facility (NAIF) Nodes.
PDS offers two services for searching the MSL archives:
The Planetary Image Atlas at the Imaging Node allows selection of MSL image data by specific search criteria. http://pds-imaging.jpl.nasa.gov/search/
The MSL Analyst's Notebook at the Geosciences Node allows searching and downloading of all MSL data in the context of mission events. http://an.rsl.wustl.edu/msl
The PDS Team
Posted by: jccwrt Jan 11 2020, 12:43 AM
Curiosity's noctilucent cloud observations are in the most current release of science data.
Tried my hand at improving on my colorized NavCam mosaic from the Sol 2410 imaging set. Color for the sky and clouds was grabbed from a NavCam mosaic from Sol 2425. Post-sunset imaging of the nearby terrain is pretty spotty so I improvised by just darkening a MastCam image a lot and making the color temperature slightly cooler. My rationale for this is that a significant amount of the remaining light is coming from the "blue halo" and noctilucent clouds, which should counter the pinkish color of dust-scattered light. Most of the sky color was added by brightness-based opacity masking - I had to figure out how to do it for this set and I'm really pleased with the results!
https://flic.kr/p/2idbNrh
https://flic.kr/p/2idbNrh
Here's a subset of the Sol 2425 MastCam mosaic of the noctilucent clouds, the 9 frames here cover ~90 degrees of sky. There were a few other frames on either side of this, but I was having difficulty when I was manually mosaicking the frames.
https://flic.kr/p/2idaHCW
https://flic.kr/p/2idaHCW
Posted by: djellison Jan 11 2020, 04:58 AM
Ooooo - do the NavCams from the evening of Sol 2417 ![]()
Posted by: jccwrt Jan 11 2020, 05:26 PM
Unfortunately I'm gonna have to find some time to learn how to use Hugin effectively for that one...even with the improved bit depth there's just not enough detail for Photoshop or Hugin to find control points automatically.
Posted by: djellison Jan 12 2020, 03:00 AM
What you can try is seeding Hugin with pointing info from the PDS labels.
Posted by: jccwrt Jan 16 2020, 02:26 PM
Oh right, I forgot that was an option. I'll try it out this weekend.
Anyway, here's a link to the MastCam site documentation pano of "Sandside Harbor", which I gather was interpreted as a heavily eroded small impact crater.
https://roundme.com/tour/536477/view/1771917/
Posted by: PaulH51 Mar 19 2020, 07:35 AM
Subject: Mars Science Laboratory Release 23
The NASA Planetary Data System announces the 23rd release of data from the Mars Science Laboratory (MSL) mission, covering data acquired from Sol 2483 through Sol 2579 (July 31, 2019, to November 8, 2019).
This release consists of raw and derived data sets from the following
instruments:
Alpha Particle X-ray Spectrometer (APXS)
Chemistry & Micro-Imaging (ChemCam)
Chemistry and Mineralogy (CheMin)
Dynamic Albedo of Neutrons (DAN)
Hazard Avoidance Cameras (Hazcam)
Mars Hand Lens Imager (MAHLI)
Mars Descent Imager (MARDI)
Mast-mounted Cameras (Mastcam)
Navigation Cameras (Navcam)
Position Localization and Attitude Correction Estimate Storage (PLACES)
Radiation Assessment Detector (RAD)
Rover Environmental Monitoring Station (REMS)
Sample Analysis at Mars (SAM)
Spacecraft, Planet, Instrument, Pointing C-Matrix, and Event kernels (SPICE)
To access the above data, please visit the following link: https://pds.nasa.gov/datasearch/subscription-service/SS-20200316.shtml
Links to all MSL data sets may be found on the PDS Geosciences Node web site http://pds-geosciences.wustl.edu/missions/msl/. The data may also be reached from the main PDS home page, https://pds.nasa.gov/. MSL data are archived at the PDS Atmospheres, Planetary Plasma Interactions (PPI), Geosciences, Imaging, and Navigation and Ancillary Information Facility (NAIF) Nodes.
PDS offers two services for searching the MSL archives:
The Planetary Image Atlas at the Imaging Node allows selection of MSL image data by specific search criteria.
http://pds-imaging.jpl.nasa.gov/search/
The MSL Analyst's Notebook at the Geosciences Node allows searching and downloading of all MSL data in the context of mission events.
http://an.rsl.wustl.edu/msl
The PDS Team
Mailto: pds_operator@jpl.nasa.gov
Phone: (818) 393-7165
Posted by: Ant103 Mar 19 2020, 03:07 PM
It's done
http://www.db-prods.net/marsroversimages/Curiosity/2019/Sol2417_pano_PDS.jpg
Posted by: elakdawalla Mar 23 2020, 04:21 PM
http://www.unmannedspaceflight.com/index.php?showtopic=8385&view=findpost&p=246990 Help shape the future of the PDS!
Damia, that's gorgeous as ever.
Posted by: nogal Aug 1 2020, 01:20 PM
Mars Science Laboratory Release 24
The NASA Planetary Data System announces the 24th release of data from the Mars Science Laboratory (MSL) mission, covering data acquired from Sol 2580 through Sol 2713 (November 8, 2019, to March 25, 2020).
This release consists of raw and derived data sets from the following instruments:
Alpha Particle X-ray Spectrometer (APXS)
Chemistry & Micro-Imaging (ChemCam)
Chemistry and Mineralogy (CheMin)
Dynamic Albedo of Neutrons (DAN)
Hazard Avoidance Cameras (Hazcam)
Mars Hand Lens Imager (MAHLI)
Mars Descent Imager (MARDI)
Mast-mounted Cameras (Mastcam)
Navigation Cameras (Navcam)
Position Localization and Attitude Correction Estimate Storage (PLACES)
Radiation Assessment Detector (RAD)
Rover Environmental Monitoring Station (REMS)
Sample Analysis at Mars (SAM)
Spacecraft, Planet, Instrument, Pointing C-Matrix, and Event kernels (SPICE)
To access the above data, please visit the following link:
https://pds.nasa.gov/datasearch/subscription-service/SS-20200801.shtml
Links to all MSL data sets may be found on the PDS Geosciences Node web site http://pds-geosciences.wustl.edu/missions/msl/. The data may also be reached from the main PDS home page, https://pds.nasa.gov/. MSL data are archived at the PDS Atmospheres, Planetary Plasma Interactions (PPI), Geosciences, Imaging, and Navigation and Ancillary Information Facility (NAIF) Nodes.
PDS offers two services for searching the MSL archives:
The Planetary Image Atlas at the Imaging Node allows selection of MSL image data by specific search criteria.
https://pds-imaging.jpl.nasa.gov/search/
The MSL Analyst's Notebook at the Geosciences Node allows searching and downloading of all MSL data in the context of mission events.
http://an.rsl.wustl.edu/msl
The PDS Team
Mailto: pds_operator@jpl.nasa.gov
Phone: (818) 393-7165
Posted by: palebutdot Aug 2 2020, 07:50 AM
The NASA Planetary Data System announces the 24th release of data from the Mars Science Laboratory (MSL) mission, covering data acquired from Sol 2580 through Sol 2713 (November 8, 2019, to March 25, 2020).
This release consists of raw and derived data sets from the following instruments:
Alpha Particle X-ray Spectrometer (APXS)
Chemistry & Micro-Imaging (ChemCam)
Chemistry and Mineralogy (CheMin)
Dynamic Albedo of Neutrons (DAN)
Hazard Avoidance Cameras (Hazcam)
Mars Hand Lens Imager (MAHLI)
Mars Descent Imager (MARDI)
Mast-mounted Cameras (Mastcam)
Navigation Cameras (Navcam)
Position Localization and Attitude Correction Estimate Storage (PLACES)
Radiation Assessment Detector (RAD)
Rover Environmental Monitoring Station (REMS)
Sample Analysis at Mars (SAM)
Spacecraft, Planet, Instrument, Pointing C-Matrix, and Event kernels (SPICE)
To access the above data, please visit the following link:
https://pds.nasa.gov/datasearch/subscription-service/SS-20200801.shtml
Links to all MSL data sets may be found on the PDS Geosciences Node web site http://pds-geosciences.wustl.edu/missions/msl/. The data may also be reached from the main PDS home page, https://pds.nasa.gov/. MSL data are archived at the PDS Atmospheres, Planetary Plasma Interactions (PPI), Geosciences, Imaging, and Navigation and Ancillary Information Facility (NAIF) Nodes.
PDS offers two services for searching the MSL archives:
The Planetary Image Atlas at the Imaging Node allows selection of MSL image data by specific search criteria.
https://pds-imaging.jpl.nasa.gov/search/
The MSL Analyst's Notebook at the Geosciences Node allows searching and downloading of all MSL data in the context of mission events.
http://an.rsl.wustl.edu/msl
The PDS Team
Mailto: pds_operator@jpl.nasa.gov
Phone: (818) 393-7165
THANK YOU SO MUCH!!!
It's great to revisit the initial releases like this https://www.jpl.nasa.gov/spaceimages/details.php?id=pia17936.
Posted by: neo56 Aug 16 2020, 08:11 AM
As I'm working on a Mac, I can't use the powerful IMG2PNG tool of Björn Johnsson. Fortunately, the MSL Notebook provides PNG data along with IMG data (named *drcl_0pct.png for instance).
However, I noticed that these PNG have artifacts that are not present when the IMG are opened with ENVI/IDL and saved as PNG (see below, image 0467mr0018630740302833e01_drcl zoomed and highly contrasted. Left: PNG coming along IMG on the PDS. Right: PNG obtained by opening IMG on ENVI).
So I wrote a code on IDL to batch process IMG MastCam pictures from the PDS into PNG. I also improved my codes to correct the artifacts such as specks of dust and hot pixels.
Here is the result with a panorama taken on sol 467. I'm pretty happy with it!
https://flic.kr/p/2jweC27
https://flic.kr/p/2jweNPQ
Posted by: JohnVV Aug 16 2020, 08:28 AM
yup those are jpeg artifacts in the png images
that is why i use the img images in ISIS4
nice panorama
Posted by: neo56 Aug 16 2020, 10:21 AM
that is why i use the img images in ISIS4
nice panorama
That's what I thought, they really looked like jpeg artifacts.
I guess that ISIS4 does the same as IDL (open IMG as a byte array using a header I generate from the label file then save it as a PNG).
Posted by: neo56 Sep 18 2020, 08:16 PM
I processed PDS data of a MastCam Right mosaic of Namib dune taken on sol 1192 (8:00 am martian local time).
It comes with a version including Matt Damon for scale ![]()
https://flic.kr/p/2jHR7Xh
https://flic.kr/p/2jHQbms
Posted by: nogal Dec 5 2020, 10:19 PM
Mars Science Laboratory Release 25
The NASA Planetary Data System announces Release 25 of data from the Mars Science Laboratory (Curiosity) mission. This release contains raw and calibrated
data products covering the time period from March 25 through July 30, 2020 (sols
2714-2837). The data are archived at various PDS nodes.
APXS (Alpha Particle X-ray Spectrometer) at the Geosciences Node
ChemCam at the Geosciences Node
CheMin at the Geosciences Node
DAN at the Geosciences Node
Engineering Cameras at the Cartography and Imaging Sciences Node
MAHLI (Mars Hand Lens Imager) at the Cartography and Imaging Sciences Node
MARDI (Mars Descent Imager) at the Cartography and Imaging Sciences Node
Mastcam at the Cartography and Imaging Sciences Node
PLACES Database at the Cartography and Imaging Sciences Node
RAD (Radiation Assessment Detector) at the PPI Node
REMS (Rover Environmental Monitoring Station) at the Atmospheres Node
SAM (Sample Analysis at Mars) at the Geosciences Node
SPICE at the NAIF Node
The data may be accessed from
https://pds-geosciences.wustl.edu/missions/msl/.
or for a dataset-oriented perspective:
https://pds.nasa.gov/datasearch/subscription-service/SS-20210802.shtml
The next MSL release is scheduled for March 16, 2021.
The PDS Team
Mailto: pds_operator@jpl.nasa.gov
Phone: (818) 393-7165
Posted by: nogal Mar 16 2021, 11:24 PM
Mars Science Laboratory Release 26
The NASA Planetary Data System announces Release 26 of data from the Mars Science Laboratory (Curiosity) mission. This release contains raw and calibrated data products covering the time period from July 30 through November 7, 2020 (sols 2838-2934). The data are archived at various PDS nodes.
APXS (Alpha Particle X-ray Spectrometer) at the Geosciences Node
ChemCam at the Geosciences Node
CheMin at the Geosciences Node
DAN at the Geosciences Node
Engineering Cameras at the Cartography and Imaging Sciences Node
MAHLI (Mars Hand Lens Imager) at the Cartography and Imaging Sciences Node
Mastcam at the Cartography and Imaging Sciences Node
PLACES Database at the Cartography and Imaging Sciences Node
RAD (Radiation Assessment Detector) at the PPI Node
REMS (Rover Environmental Monitoring Station) at the Atmospheres Node
SAM (Sample Analysis at Mars) at the Geosciences Node
SPICE at the NAIF Node
The data may be accessed from
https://pds-geosciences.wustl.edu/missions/msl/.
or for a dataset-oriented perspective:
https://pds.nasa.gov/datasearch/subscription-service/SS-20210316.shtml
The next MSL release is scheduled for August 2, 2021.
The PDS Team
Mailto: pds_operator@jpl.nasa.gov
Phone: (818) 393-7165
Posted by: neo56 Jul 8 2021, 06:38 PM
Dingo Gap, sol 538, 1:25 pm Martian local time. Processing of calibrated DRCL pictures from PDS.
https://flic.kr/p/2ma832P
https://flic.kr/p/2ma17Xb
Posted by: nogal Aug 3 2021, 01:48 PM
Mars Science Laboratory Release 27
The NASA Planetary Data System announces Release 27 of data from the Mars Science Laboratory (Curiosity) mission. This release contains raw and calibrated data
products covering the time period from November 7, 2020, through March 24, 2021
(sols 2935-3068). The data are archived at various PDS nodes:
APXS (Alpha Particle X-ray Spectrometer) at the Geosciences Node
ChemCam at the Geosciences Node
CheMin at the Geosciences Node
DAN at the Geosciences Node
Engineering Cameras at the Cartography and Imaging Sciences Node
MAHLI (Mars Hand Lens Imager) at the Cartography and Imaging Sciences Node
Mastcam at the Cartography and Imaging Sciences Node
PLACES Database at the Cartography and Imaging Sciences Node
RAD (Radiation Assessment Detector) at the PPI Node
REMS (Rover Environmental Monitoring Station) at the Atmospheres Node
SAM (Sample Analysis at Mars) at the Geosciences Node
SPICE at the NAIF Node
The data may be accessed from
https://pds-geosciences.wustl.edu/missions/msl/
or for a dataset-oriented perspective:
https://pds.nasa.gov/datasearch/subscription-service/SS-20210802.shtml
The next MSL release is scheduled for December 6, 2021.
The PDS Team
Mailto: pds_operator@jpl.nasa.gov
Phone: (818) 393-7165
Posted by: nogal Dec 7 2021, 01:12 PM
Mars Science Laboratory Release 28
The NASA Planetary Data System announces Release 28 of data from the Mars Science
Laboratory (Curiosity) mission. This release contains raw and calibrated data
products covering the time period from March 24 through July 30, 2021
(sols 3069-3192). The data are archived at various PDS nodes:
APXS (Alpha Particle X-ray Spectrometer) at the Geosciences Node
ChemCam at the Geosciences Node
CheMin at the Geosciences Node
DAN at the Geosciences Node
Engineering Cameras at the Cartography and Imaging Sciences Node
MAHLI (Mars Hand Lens Imager) at the Cartography and Imaging Sciences Node
Mastcam at the Cartography and Imaging Sciences Node
PLACES Database at the Cartography and Imaging Sciences Node
RAD (Radiation Assessment Detector) at the PPI Node
REMS (Rover Environmental Monitoring Station) at the Atmospheres Node
SAM (Sample Analysis at Mars) at the Geosciences Node
SPICE at the NAIF Node
The data may be accessed from
https://pds-geosciences.wustl.edu/missions/msl/
or for a dataset-oriented perspective:
https://pds.nasa.gov/datasearch/subscription-service/SS-20211206.shtml
The next MSL release is scheduled for March 16, 2022.
The PDS Team
Mailto: pds_operator@jpl.nasa.gov
Phone: (818) 393-7165
Posted by: nogal Mar 16 2022, 11:24 PM
Mars Science Laboratory Release 29
The NASA Planetary Data System announces Release 29 of data from the Mars Science Laboratory (Curiosity) mission. This release contains raw and derived data products covering the time period from July 30 through November 7, 2021 (sols 3193-3289). The data are archived at various PDS nodes:
APXS (Alpha Particle X-ray Spectrometer) at the Geosciences Node
ChemCam at the Geosciences Node
CheMin at the Geosciences Node
DAN at the Geosciences Node
Engineering Cameras at the Cartography and Imaging Sciences Node
MAHLI (Mars Hand Lens Imager) at the Cartography and Imaging Sciences Node
Mastcam at the Cartography and Imaging Sciences Node
PLACES Database at the Cartography and Imaging Sciences Node
RAD (Radiation Assessment Detector) at the PPI Node
REMS (Rover Environmental Monitoring Station) at the Atmospheres Node
SAM (Sample Analysis at Mars) at the Geosciences Node
SPICE at the NAIF Node
The data may be accessed from
https://pds-geosciences.wustl.edu/missions/msl/
or for a dataset-oriented perspective:
https://pds.nasa.gov/datasearch/subscription-service/SS-20220316.shtml
The next MSL release is scheduled for August 1, 2022.
The PDS Team
Mailto: pds_operator@jpl.nasa.gov
Phone: (818) 393-7165
Posted by: nogal Aug 3 2022, 04:55 PM
Mars Science Laboratory Release 30
The NASA Planetary Data System announces Release 30 of data from the Mars Science Laboratory (Curiosity) mission.
This release contains raw and derived data products covering the time period from November 7, 2021, through March 24, 2022 (sols 3290-3423).
The data are archived at various PDS nodes:
APXS (Alpha Particle X-ray Spectrometer) at the Geosciences Node
ChemCam at the Geosciences Node
CheMin at the Geosciences Node
DAN at the Geosciences Node
Engineering Cameras at the Cartography and Imaging Sciences Node
MAHLI (Mars Hand Lens Imager) at the Cartography and Imaging Sciences Node
Mastcam at the Cartography and Imaging Sciences Node
PLACES Database at the Cartography and Imaging Sciences Node
RAD (Radiation Assessment Detector) at the PPI Node
REMS (Rover Environmental Monitoring Station) at the Atmospheres Node
SAM (Sample Analysis at Mars) at the Geosciences Node
SPICE at the NAIF Node
The data may be accessed from
https://pds-geosciences.wustl.edu/missions/msl/
or for a dataset-oriented perspective:
https://pds.nasa.gov/datasearch/subscription-service/SS-20220801.shtml
The next MSL release is scheduled for December 5, 2022.
The PDS Team
Mailto: pds_operator@jpl.nasa.gov
Phone: (818) 393-7165
Posted by: nogal Dec 6 2022, 01:27 AM
Mars Science Laboratory Release 31
The NASA Planetary Data System announces Release 31 of data from the Mars Science Laboratory (Curiosity) mission. This release contains raw and derived data products covering the time period from March 24 through July 30, 2022 (sols 3424-3547).The data are archived at various PDS nodes:
APXS (Alpha Particle X-ray Spectrometer) at the Geosciences Node
ChemCam at the Geosciences Node
CheMin at the Geosciences Node
DAN at the Geosciences Node
Engineering Cameras at the Cartography and Imaging Sciences Node
MAHLI (Mars Hand Lens Imager) at the Cartography and Imaging Sciences Node
Mastcam at the Cartography and Imaging Sciences Node
PLACES Database at the Cartography and Imaging Sciences Node
RAD (Radiation Assessment Detector) at the PPI Node
REMS (Rover Environmental Monitoring Station) at the Atmospheres Node
SAM (Sample Analysis at Mars) at the Geosciences Node
SPICE at the NAIF Node
The data may be accessed from
https://pds-geosciences.wustl.edu/missions/msl/
or for a dataset-oriented perspective:
https://pds.nasa.gov/datasearch/subscription-service/SS-20221205.shtml
The next MSL release is scheduled for March 16, 2023.
The PDS Team
Mailto: pds_operator@jpl.nasa.gov
Phone: (818) 393-7165
Posted by: nogal Mar 17 2023, 04:35 PM
Mars Science Laboratory Release 32
The NASA Planetary Data System announces Release 32 of data from the Mars Science Laboratory (Curiosity) mission. This release contains raw and derived data products covering the time period from July 30 through November 6, 2022 (sols 3548-3644). The data are archived at various PDS nodes.
APXS (Alpha Particle X-ray Spectrometer) at the Geosciences Node
ChemCam at the Geosciences Node
CheMin at the Geosciences Node
DAN at the Geosciences Node
Engineering Cameras at the Cartography and Imaging Sciences Node
MAHLI (Mars Hand Lens Imager) at the Cartography and Imaging Sciences Node
Mastcam at the Cartography and Imaging Sciences Node
PLACES Database at the Cartography and Imaging Sciences Node
RAD (Radiation Assessment Detector) at the PPI Node
REMS (Rover Environmental Monitoring Station) at the Atmospheres Node
SAM (Sample Analysis at Mars) at the Geosciences Node
SPICE at the NAIF Node
The data may be accessed from
https://pds-geosciences.wustl.edu/missions/msl/
or for a dataset-oriented perspective:
https://pds.nasa.gov/datasearch/subscription-service/SS-20230316.shtml
The next MSL release is scheduled for August 1, 2023.
The PDS Team
Mailto: pds_operator@jpl.nasa.gov
Phone: (818) 393-7165
Posted by: nogal Aug 2 2023, 11:05 PM
Mars Science Laboratory Release 33
The NASA Planetary Data System announces Release 33 of data from the Mars Science Laboratory (Curiosity) mission. This release contains raw and derived data products covering the time period from November 6, 2022, through March 24, 2023 (sols 3645-3778). Several instruments have begun archiving their data in accordance with the PDS4 standard. The data are archived at various PDS nodes.
APXS (Alpha Particle X-ray Spectrometer) at the Geosciences Node
ChemCam at the Geosciences Node
CheMin at the Geosciences Node
DAN at the Geosciences Node
Engineering Cameras at the Cartography and Imaging Sciences Node
MAHLI (Mars Hand Lens Imager) at the Cartography and Imaging Sciences Node
Mastcam at the Cartography and Imaging Sciences Node
PLACES Database at the Cartography and Imaging Sciences Node
RAD (Radiation Assessment Detector) at the PPI Node
REMS (Rover Environmental Monitoring Station) at the Atmospheres Node
SAM (Sample Analysis at Mars) at the Geosciences Node
SPICE at the NAIF Node
The data may be accessed from
https://pds-geosciences.wustl.edu/missions/msl/
or for a dataset-oriented perspective:
https://pds.nasa.gov/datasearch/subscription-service/SS-20230801.shtml
The next MSL release is scheduled for December 5, 2023.
The PDS Team
Mailto: pds_operator@jpl.nasa.gov
Phone: (818) 393-7165
Posted by: nogal Dec 6 2023, 07:38 PM
Mars Science Laboratory Release 34
The NASA Planetary Data System announces Release 34 of data from the Mars Science Laboratory (Curiosity) mission.
This release contains raw and derived data products covering the time period from March 24 through July 29, 2023 sols 3779-3902).
Several instruments have begun archiving their data in accordance with the PDS4 standard. The data are archived at various PDS nodes.
APXS (Alpha Particle X-ray Spectrometer) at the Geosciences Node
ChemCam at the Geosciences Node
CheMin at the Geosciences Node
DAN at the Geosciences Node
Engineering Cameras at the Cartography and Imaging Sciences Node
MAHLI (Mars Hand Lens Imager) at the Cartography and Imaging Sciences Node
Mastcam at the Cartography and Imaging Sciences Node
PLACES Database at the Cartography and Imaging Sciences Node
RAD (Radiation Assessment Detector) at the PPI Node
REMS (Rover Environmental Monitoring Station) at the Atmospheres Node
SAM (Sample Analysis at Mars) at the Geosciences Node
SPICE at the NAIF Node
The data may be accessed from
https://pds-geosciences.wustl.edu/missions/msl/
or for a dataset-oriented perspective:
https://pds.nasa.gov/datasearch/subscription-service/SS-20231205.shtml
The next MSL release is scheduled for March 15, 2024.
The PDS Team
Mailto: pds_operator@jpl.nasa.gov
Phone: (818) 393-7165
Posted by: nogal Mar 17 2024, 09:45 PM
Mars Science Laboratory Release 35
The NASA Planetary Data System announces Release 35 of data from the Mars
Science Laboratory (Curiosity) mission. This release contains raw and derived
data products covering the time period July 29 through November 6, 2023 (sols
3903-3999). Several instruments have begun archiving their data in accordance
with the PDS4 standard. The data are archived at various PDS nodes.
APXS (Alpha Particle X-ray Spectrometer) at the Geosciences Node
ChemCam at the Geosciences Node
CheMin at the Geosciences Node
DAN at the Geosciences Node
Engineering Cameras at the Cartography and Imaging Sciences Node
MAHLI (Mars Hand Lens Imager) at the Cartography and Imaging Sciences Node
Mastcam at the Cartography and Imaging Sciences Node
PLACES Database at the Cartography and Imaging Sciences Node
RAD (Radiation Assessment Detector) at the PPI Node
REMS (Rover Environmental Monitoring Station) at the Atmospheres Node
SAM (Sample Analysis at Mars) at the Geosciences Node
SPICE at the NAIF Node
The data may be accessed from
https://pds-geosciences.wustl.edu/missions/msl/
or for a dataset-oriented perspective:
https://pds.nasa.gov/datasearch/subscription-service/SS-20240315.shtml
The next MSL release is scheduled for August 2, 2024.
The PDS Team
Mailto: pds_operator@jpl.nasa.gov
Phone: (818) 393-7165
Posted by: nogal Aug 5 2024, 06:40 PM
Mars Science Laboratory Release 36
The NASA Planetary Data System announces Release 36 of data from the Mars Science Laboratory (Curiosity) mission. This release contains raw and derived
data products covering the time period November 6, 2023, to March 23, 2024
(sols 4000-4133). Several instruments have begun archiving their data in
accordance with the PDS4 standard. The data are archived at various PDS nodes.
APXS (Alpha Particle X-ray Spectrometer) at the Geosciences Node
ChemCam at the Geosciences Node
CheMin at the Geosciences Node
DAN at the Geosciences Node
Engineering Cameras at the Cartography and Imaging Sciences Node
MAHLI (Mars Hand Lens Imager) at the Cartography and Imaging Sciences Node
Mastcam at the Cartography and Imaging Sciences Node
PLACES Database at the Cartography and Imaging Sciences Node
RAD (Radiation Assessment Detector) at the PPI Node
REMS (Rover Environmental Monitoring Station) at the Atmospheres Node
SAM (Sample Analysis at Mars) at the Geosciences Node
SPICE at the NAIF Node
The data may be accessed from
https://pds-geosciences.wustl.edu/missions/msl/
or for a dataset-oriented perspective:
https://pds.nasa.gov/datasearch/subscription-service/SS-20240802.shtml
The next MSL release is scheduled for December 6, 2024.
The PDS Team
Mailto: pds_operator@jpl.nasa.gov
Phone: (818) 393-7165
Powered by Invision Power Board (http://www.invisionboard.com)
© Invision Power Services (http://www.invisionpower.com)
