Endeavour Drive - Drivability analysis |

  |
Endeavour Drive - Drivability analysis |
 Sep 26 2008, 05:48 AM Sep 26 2008, 05:48 AM
Post
#316
|
|
 Senior Member  Group: Members Posts: 1229 Joined: 24-December 05 From: The blue one in between the yellow and red ones. Member No.: 618 |
It may be self-evident, but big ripples have big troughs between them. The former present formidable (RED) barriers when they lie transverse to the desired path, but the latter provide splendid highways (GREEN) when parallel to it. So I suspect that the software had better take into account the divergence between the prevailing big ripple axis and desired axis of travel, if we are to avoid confusing color schemes.

-------------------- My Grandpa goes to Mars every day and all I get are these lousy T-shirts!
|
 |
 
|
|
Sep 26 2008, 06:02 AM
Post
#317
|
|
|
Member Group: Admin Posts: 976 Joined: 29-September 06 From: Pasadena, CA - USA Member No.: 1200 |
QUOTE (Juramike @ Sep 25 2008, 08:22 PM)  ... Here's the image indicated above of Purgatory. Note that even the big dunes here are NOT indicated as scary when this method was applied. [attachment=15778:purgator...velength.jpg] *sigh* This seems appropriate about now: [attachment=15779:Marvin_M..._drawing.wav] -Mike Purgatory was a different type of ripple. The ridge of the ripple curves while the other ripples ridge is straight. If you look S, SE and E of VC there are many of these curved ripples. The reason why this algorithm does not find them is because it assumes a straight ripple. Since these are probably the major threats to the rover, very likely one would need to convolve the image with a reference to detect them. Fortunately these purgatory-style ripples are very easily seen in the HiRISE image and it will be very easy to correlate the position of the rover as seen from the ground with the orbital imagery. I can't believe the amount of work you guys have put into this! I can't wait to see the next HiRISE image. Paolo -------------------- Disclaimer: all opinions, ideas and information included here are my own,and should not be intended to represent opinion or policy of my employer.
|
|
|
|
|
Sep 26 2008, 06:05 AM
Post
#318
|
|
|
Member Group: Members Posts: 530 Joined: 21-March 06 From: Canada Member No.: 721 |
The message I am getting from all this amazing analysis is that the worst is behind Oppy, and that no seriously impassable barriers present themselves going forward. The overall driveability of the surface should not change ahead. Imaging taken en route and rover self-protection software should be sufficient to deal with any tricky ripples that will be encountered along the way. At worst, perhaps a couple of days delay to disentangle and shift around.
 without without 
|
|
|
|
|
Sep 26 2008, 07:07 AM
Post
#319
|
|
 Senior Member Group: Members Posts: 2228 Joined: 1-December 04 From: Marble Falls, Texas, USA Member No.: 116 |
QUOTE (Ant103 @ Sep 25 2008, 10:51 AM) A view toward the flatlands of Meridiani Wow, Ant103! I didn't expect to see that. That is amazing! In some ways it reminds me of the effects of a recent hurricane near here. That is an image to highlight. 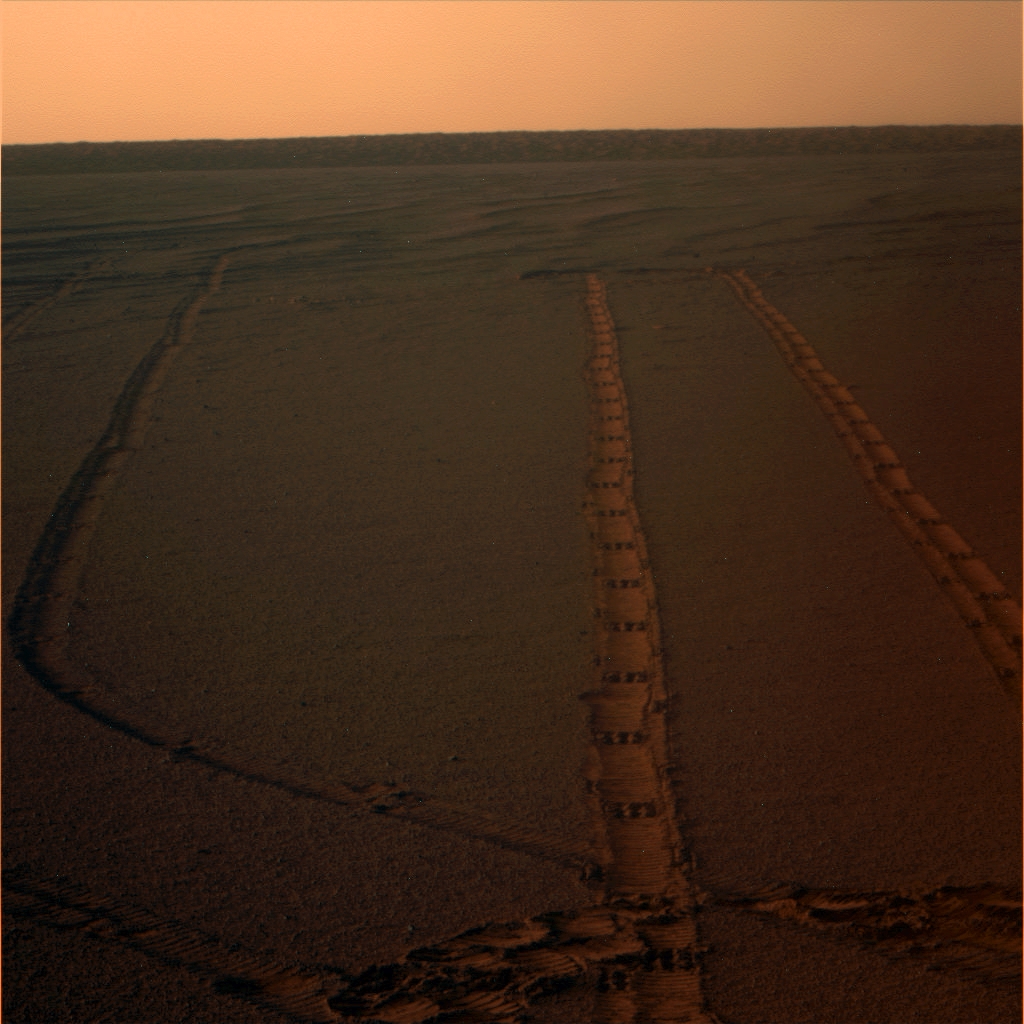 I am wondering that when have been created the right tracks. QUOTE (Shaka @ Sep 26 2008, 12:48 AM) It may be self-evident, but big ripples have big troughs between them. The former present formidable (RED) barriers when they lie transverse to the desired path, but the latter provide splendid highways (GREEN) when parallel to it. So I suspect that the software had better take into account the divergence between the prevailing big ripple axis and desired axis of travel, if we are to avoid confusing color schemes. Yep. I was thinking about that last night. There is geometry here that is not simple to capture and analyze. I am blown away by the recent maps. There is some very good work going on. Keep it up, people.
-------------------- ...Tom
I'm not a Space Fan, I'm a Space Exploration Enthusiast. |
|
|
|
|
Sep 26 2008, 07:58 AM
Post
#320
|
|
 Senior Member Group: Moderator Posts: 2262 Joined: 9-February 04 From: Melbourne - Oz Member No.: 16 |
QUOTE (fredk @ Sep 26 2008, 12:15 AM) James, that's looking fantastic! Just a couple of remarks: could we see a higher-resolution crop of an area that contains extensive bedrock (eg Erebus highway) so we can see how the FT does there? I'll try and make those 1/4 resolution plots for the whole of image this evening. Needed an early night last night so I just did a couple to show that it works. QUOTE (fredk @ Sep 26 2008, 12:15 AM) Also, there are lots of areas that are almost saturated red - perhaps the colour table could be tweaked to give more gradations of red so we can see more easily what's the worst of the worst and what's the best of the worst etc? Yes, I had no real idea how big the numbers would get as it worked across the image so a lot of those in the etched terrain ended up saturated red. I'll rerun it with different scaling before making the maps tonight. QUOTE (Juramike @ Sep 26 2008, 05:42 AM) I was really hoping the Fourier transform method would solve all the problems: big dune detection, funky dune detection, finding safe bedrock zones. Well at this stage that was never going to happen - my analysis explicitly looks for repeating E-W patterns at 8 - 28 pixel wavelengths - then plots the 'power' at that wavelength. I think it's a reasonable assumption that big/funky dunes are more likely in 'big ripple areas'. In those areas it's also harder to navigate around obstacles and to navigate through in general. More elaborate schemes are probably possible but I'm not sure it's needed. Purgatory was one isolated bump, not only that but it is surrounded by ripples that are small compared to some of the monsters found elsewhere, so the orange classification is what I would have expected (orange -> use caution, no blind drives like at Purgatory!). As I said before, this method with give you the areas that are generally more favourable for driving - but it doesn't mean Paolo can take his eyes off the road! Any map that had the resolution to have every 'Purgatory' and dead end marked would end up being on a similar scale to the HiRISE image, so you might as well just use it as is! My map should help to decide the general direction to minimise the chance of tripping over something nasty - then the HiRISE images themselves can be used to further refine the route - then the previous sols nav/pancams can be used to plot the actual drive. Simple!  James -------------------- |
|
|
|
|
Sep 26 2008, 08:09 AM
Post
#321
|
|
|
Junior Member Group: Members Posts: 63 Joined: 20-April 05 Member No.: 312 |
QUOTE (Shaka @ Sep 26 2008, 07:02 AM) It may be self-evident, but big ripples have big troughs between them. The former present formidable (RED) barriers when they lie transverse to the desired path, but the latter provide splendid highways (GREEN) when parallel to it. So I suspect that the software had better take into account the divergence between the prevailing big ripple axis and desired axis of travel, if we are to avoid confusing color schemes. Is the way forward now for Paolo and his team to begin choosing say 4 or 5 possible routes to take in things of scientific interest using the map(s) produced so far - sticking to Green / Yellow areas where possible. Once these routes are selected - we can then zoom into the image and overlay some lines to show actual paths between the dunes (particlularly in any RED areas that need crossong) and taking advantage of the North-South trenches for easy driving - I suspect that way you will end up with a few very detailed routes for the MER guys to choose from. It's the sort of 80 - 20 rule - I think you guys are 80% there - why not spend 20% doing some in-depth visual work on some routes selected from the (Fourier ?) mapping done so far Just a thought - I'm no academic - but I'm all for taking short cuts where appropriate Brianc |
|
|
|
|
Sep 26 2008, 08:19 AM
Post
#322
|
|
|
Senior Member Group: Moderator Posts: 2262 Joined: 9-February 04 From: Melbourne - Oz Member No.: 16 |
QUOTE (brianc @ Sep 26 2008, 09:09 AM) Once these routes are selected - we can then zoom into the image and overlay some lines to show actual paths between the dunes (particlularly in any RED areas that need crossong) and taking advantage of the North-South trenches for easy driving - I suspect that way you will end up with a few very detailed routes for the MER guys to choose from. I don't think that is worth doing in too much detail very far in advance. We could map out a great route through the maze - then they'll want to nip across a couple of ripples to get to an interesting cobble and the whole route may change. -------------------- |
|
|
|
|
Sep 26 2008, 08:29 AM
Post
#323
|
|
 Special Cookie Group: Members Posts: 2168 Joined: 6-April 05 From: Sintra | Portugal Member No.: 228 |
So...does this mean that can we hit the road? Got my sick pills and the bags are already in the trunk...
You guys are just A-W-E-S-O-M-E... 
-------------------- "Ride, boldly ride," The shade replied, "If you seek for Eldorado!"
Edgar Alan Poe |
|
|
|
|
Sep 26 2008, 11:01 AM
Post
#324
|
|
 Member Group: Members Posts: 236 Joined: 5-June 08 From: Udon Thani Member No.: 4185 |
I have been playing a bit with various techniques to calculate terrain, based on HiRISE images.
For those of you with Windows XP/Vista OS you can download a free software tool 'roverrouter' from http://www.navtools.nl/roverrouter.htm this tool requires the Microsoft .NET environment 3.5 SP 1 (will be automatically downloaded if you don't have it already). Written 'quick and dirty' in VC# the tool basically is able to calculate the standard deviation of the brightness of the terrain in a complete circle around each position, size of this circle, sampling-rate, etc, can be configured from the options menu, as well as the various colors to use. After a bit of experimenting it looks like this trick gives results very much similar to the Fourier analysis mentioned earlier, however it is more easy to use on machines which do not have such software available.  Most of all, the 'rover router' can calculate a route, you can enter a track across the image, and the software will analyze this route and not only state the total distance but also the estimated surface roughness along the route (both average values and maximum values), and it can produce a graph of this.  As yet this tool is far from completed, if I can find the time I'll fiddle some more with it, trying to improve further on the techniques used, any comments are welcome offcourse, although unfortunately my spare time is always very limited. But maybe this will just be a small help for those of us who do not have access to the big mainframes and still like to give it a try to find a route for oppy. Don't use it for operational work though, I'm not giving any guarantees  Regards, Geert |
|
|
|
|
Sep 26 2008, 12:23 PM
Post
#325
|
|
 Senior Member Group: Moderator Posts: 2785 Joined: 10-November 06 From: Pasadena, CA Member No.: 1345 |
WOW! Geert, that looks absolutely fantastic!!!!!
 On y go! -Mike -------------------- Some higher resolution images available at my photostream: http://www.flickr.com/photos/31678681@N07/
|
|
|
|
|
Sep 26 2008, 12:51 PM
Post
#326
|
|
|
Senior Member Group: Moderator Posts: 2785 Joined: 10-November 06 From: Pasadena, CA Member No.: 1345 |
QUOTE (jamescanvin @ Sep 26 2008, 03:58 AM) ....my analysis explicitly looks for repeating E-W patterns at 8 - 28 pixel wavelengths - then plots the 'power' at that wavelength. I think it's a reasonable assumption that big/funky dunes are more likely in 'big ripple areas'. In those areas it's also harder to navigate around obstacles and to navigate through in general. Looking at a couple images, it looks like there is a trend for funky/scary dunes seem to be orthogonal to a 300 degrees to N vector. (So the small funky-scary sections of dunes themselves seem to bend to a NE-SW parallel orientation.) The zoom in plot near Purgatory shows a couple of these, as does the image of Erebus (look in the SE portion of Erebus crater near the really big dunes). There are very small sections of a few parallel dunes that might get picked up in a Fourier analysis as a repeating wavelength. (like two or three neighboring parallel dunes orthogonal to 300 degrees - is this enough?) So if it was possible to do another Fourier analysis using exactly the same method (same wavelengths) but at a 300 degree orientation, you might be able to pick out all the extra funky/scary parts and add those to your original EW Fourier map. -Mike -------------------- Some higher resolution images available at my photostream: http://www.flickr.com/photos/31678681@N07/
|
|
|
|
|
Sep 26 2008, 01:28 PM
Post
#327
|
|
|
Newbie Group: Members Posts: 12 Joined: 29-September 05 Member No.: 517 |
QUOTE (Juramike @ Sep 26 2008, 12:22 AM) Any bedrock that is less than 1 dune wavelength wide will get indicated as "scary" due to the margin shift. I thought I could get it to cancel out but to no avail. The big scary dunes AND the bedrock zones get indicated as "no go". Is it possible to identify bedrock zones with specificity? It seems to me -- without knowing anything at all about it all -- that it should be possible to use some sort of masking technique to more-or-less automatically 'trump' dune colorization with identified bedrock, if that would really be so desirable. |
|
|
|
|
Sep 26 2008, 01:54 PM
Post
#328
|
|
 Member Group: Members Posts: 700 Joined: 3-December 04 From: Boulder, Colorado, USA Member No.: 117 |
QUOTE (jamescanvin @ Sep 26 2008, 07:58 AM) Purgatory was one isolated bump, not only that but it is surrounded by ripples that are small compared to some of the monsters found elsewhere, so the orange classification is what I would have expected (orange -> use caution, no blind drives like at Purgatory!). As I said before, this method with give you the areas that are generally more favourable for driving - but it doesn't mean Paolo can take his eyes off the road! Just to second what James said here- I think his broad-brush analysis is just what's needed right now, rather than trying to locate every individual sand-trap. And Purgatory was not the most dangerous place we passed through, by any means, so it makes sense that it should be orange rather than red. I had one suggested improvement, thought it might be computationally too expensive- rather than dividing the image into tiles, maybe you could calculate the power for a NxN box centered on every pixel, giving a continuous map rather than a blocky one. Great stuff, John. |
|
|
|
|
Sep 26 2008, 02:09 PM
Post
#329
|
|||
|
Member Group: Members Posts: 293 Joined: 22-September 08 From: Spain Member No.: 4350 |
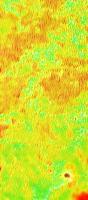
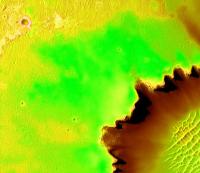
Softness map for Etched terrain to Beagle.
The lower right corner is flat terrain, actually. It stole the reddest level to the big dunes. This was the recipe: Duplicate layer x 2. Gauss 5px on the top image. Set blend mode to Difference and combine. Brightness and contrast to 120. Gauss 80px. Normalize. Color | Map | Gradient map, using a red-yellow-green gradient. Set blend mode to Color, save. But I made it work for Victoria with an additional trick.
Assuming that flat dusty terrain has a middle gray tone, before the Normalize step I created a map where gray areas (flat) are bright and bright/dark areas (dunes) are dark. Duplicate layer x 2. Invert the top image. Set blend mode to Difference, combine. Gauss 80px. Normalize. Move the layer on top of the softness map, set blending mode to Lighten only. Combine. But as I said, that's tricky and still won't work for flat, dark exposed bedrock... |
||
|
|
|
||
|
Sep 26 2008, 02:12 PM
Post
#330
|
|
 Member Group: Members Posts: 198 Joined: 2-March 05 From: Richmond, VA USA Member No.: 181 |
Hi Paolo! Thank you for allowing us to participate in even a 'small' way with the drives yet to come.
James: Great work! I don't have have the tools but was excited to see the results of your work. Thank you again for your great work - it makes rather clear at a glance areas of fast easy driving vs areas of slow more meticulous driving. A crazy thought has been nagging at me for the past couple of days that Mike's most recent post just helped to crystallize: would it be feasible to run the same analysis but for N-S, NE-SW, E-W, and NW-SE? (Not like you have anything else to do! ) The final results could be displayed in a single image by using something akin to an Evans Plot (http://www.ncl.ucar.edu/Applications/evans.shtml). Hue could be derived by the dominate dune crest orientation [maybe with green indicating crests parallel to the drive direction and red where crests are perpendicular to the dominate driving direction of interest] and saturation being derived from the magnitude of the FA (grey / low saturation for flat areas, colorful / high saturation for large dunes).Great thread! -- Pertinax (PS: Geert, that tool looks very interesting. Thank you for sharing.) |
|
|
|
|

|
Lo-Fi Version | Time is now: 29th May 2024 - 05:36 PM |
|
RULES AND GUIDELINES Please read the Forum Rules and Guidelines before posting. IMAGE COPYRIGHT |
OPINIONS AND MODERATION Opinions expressed on UnmannedSpaceflight.com are those of the individual posters and do not necessarily reflect the opinions of UnmannedSpaceflight.com or The Planetary Society. The all-volunteer UnmannedSpaceflight.com moderation team is wholly independent of The Planetary Society. The Planetary Society has no influence over decisions made by the UnmannedSpaceflight.com moderators. |
SUPPORT THE FORUM Unmannedspaceflight.com is funded by the Planetary Society. Please consider supporting our work and many other projects by donating to the Society or becoming a member. |
|