Endeavour Drive - Drivability analysis |

  |
Endeavour Drive - Drivability analysis |
 Jan 30 2009, 07:30 PM Jan 30 2009, 07:30 PM
Post
#781
|
||
|
Member  Group: Members Posts: 713 Joined: 30-March 05 Member No.: 223 |
I played a bit with 2D-Fourier-Transforms ...
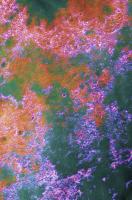
For the following map I used as texture feature vector the 2D-Fourier-Transform of a 16x16-pixel local window (subdivided in 4x4 bins of the normalized power spectrum ) In order to capture transitions, the whole 16x16 pixel window calculation was done centered at each individual pixel in the original image. The resulting 16 features are projected via PCA to an (arbitrary) 2D-color space (*) Interestingly, the second largest Eigenvalue is already ten times smaller than the largest indicating that the intrinsic dimension of the whole feature space is essentially only one. Processing time was 80 Seconds for 2 Million Pixels.
The result (so far) looks quite similar to that obtained by the other texture filters .... Next I'm going to add other features derived from the local power spectrum and combine them with the other texture filters in my toolbox (Mini-Gabor, Gaussian Markov, Co-occurence ....) Furthermore, I should apply the calculations for higher resolution HiRISE maps as well  (*) As usually I did not (yet) attempt to assign any "meaning" to the colors such as "greeen more easy than red". Instead the colors are just arbitrary as output by the mapping algorithm. |
|
 |
 
|
|
|
Jan 30 2009, 07:42 PM
Post
#782
|
||
|
Member Group: Members Posts: 713 Joined: 30-March 05 Member No.: 223 |
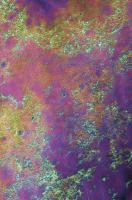
And here is the close relative to the Fourier Transform: the Autocorrelation function (ACF) wich shows a similar structure:
|
|
|
|
|
|
|
Jan 31 2009, 06:01 AM
Post
#783
|
||
 Member Group: Members Posts: 236 Joined: 5-June 08 From: Udon Thani Member No.: 4185 |
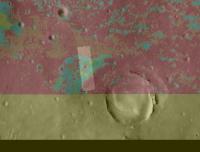
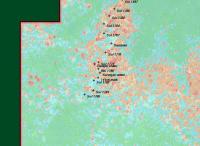
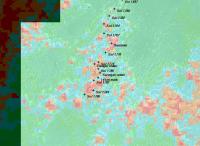
THEMIS Night IR data projected on map of victoria - endeavour range. Colors are bound to relative value's and range from yellow ('darkest') to green to blue to orange to red (lightest). It looks like the boundary from the blue/green area to the 'red' area enroute to endeavour corresponds quite exactly to the change from 'dune' terrain to mostly flat planes. If this is correct we might indeed have a tool on hand to predict terrain value's independent from HiRISE coverage. |
|
|
|
|
|
|
Jan 31 2009, 06:18 AM
Post
#784
|
||
|
Member Group: Members Posts: 236 Joined: 5-June 08 From: Udon Thani Member No.: 4185 |
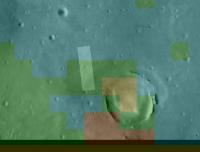
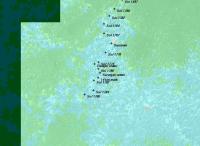
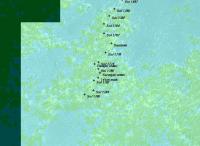
Surface dust levels as measured by TES projected on map of the victoria - endeavour range (100 mtr res). Unfortunately resolution of most TES measurements is too low to be of much help in this, although there do seem to be some trends visible. Colors are once again relative to this area, with same range as previous message. (The lighter colored square in both images represents the HiRISE coverage of Victoria, just as a position marker) Regards, Geert. |
|
|
|
|
|
|
Feb 3 2009, 02:43 AM
Post
#785
|
||
 Senior Member Group: Moderator Posts: 2785 Joined: 10-November 06 From: Pasadena, CA Member No.: 1345 |
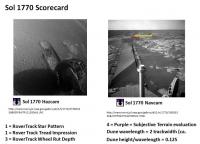
Scorecard for Sol 1770:
For the UMSF Terrain Models, here are 10 m x 10 m normalized grayscale pixel averages for Oppy's 1770 position: HiRise (raw): 126.28 HiRise (normalized): 180.86 Malaska 20081003 normalized grayscale Terrain Model: 180.2 Canvin 20081001 normalized grayscale Terrain Model: 181.94 Ontanaya 20081001 normalized grayscale Terrain Model: 110.92 Butler 20081006 normalized grayscale Terrain Model: 132.84 Sassen 20081031 normalized grayscale Terrain Model: 164.17 -------------------- Some higher resolution images available at my photostream: http://www.flickr.com/photos/31678681@N07/
|
|
|
|
|
|
|
Feb 3 2009, 02:47 AM
Post
#786
|
||
|
Senior Member Group: Moderator Posts: 2785 Joined: 10-November 06 From: Pasadena, CA Member No.: 1345 |
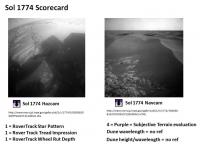
Scorecard for Sol 1774:
For the UMSF Terrain Models, here are 10 m x 10 m normalized grayscale pixel averages for Oppy's 1774 position: HiRise (raw): 130.78 HiRise (normalized): 202.38 Malaska 20081003 normalized grayscale Terrain Model: 195.59 Canvin 20081001 normalized grayscale Terrain Model: 172.45 Ontanaya 20081001 normalized grayscale Terrain Model: 162.66 Butler 20081006 normalized grayscale Terrain Model: 143.89 Sassen 20081031 normalized grayscale Terrain Model: 199.48 -------------------- Some higher resolution images available at my photostream: http://www.flickr.com/photos/31678681@N07/
|
|
|
|
|
|
|
Feb 3 2009, 02:50 AM
Post
#787
|
||
|
Senior Member Group: Moderator Posts: 2785 Joined: 10-November 06 From: Pasadena, CA Member No.: 1345 |
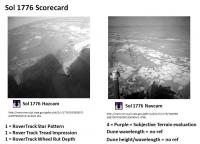
Scorecard for Sol 1776:
For the UMSF Terrain Models, here are 10 m x 10 m normalized grayscale pixel averages for Oppy's 1776 position: HiRise (raw): 130.06 HiRise (normalized): 209.19 Malaska 20081003 normalized grayscale Terrain Model: 185.25 Canvin 20081001 normalized grayscale Terrain Model: 126.66 Ontanaya 20081001 normalized grayscale Terrain Model: 197.64 Butler 20081006 normalized grayscale Terrain Model: 140.59 Sassen 20081031 normalized grayscale Terrain Model: 202.84 -------------------- Some higher resolution images available at my photostream: http://www.flickr.com/photos/31678681@N07/
|
|
|
|
|
|
|
Feb 3 2009, 02:53 AM
Post
#788
|
||
|
Senior Member Group: Moderator Posts: 2785 Joined: 10-November 06 From: Pasadena, CA Member No.: 1345 |
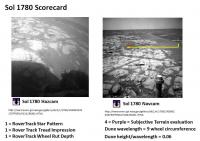
Scorecard for Sol 1780:
For the UMSF Terrain Models, here are 10 m x 10 m normalized grayscale pixel averages for Oppy's 1780 position: HiRise (raw): 134.27 HiRise (normalized): 220 Malaska 20081003 normalized grayscale Terrain Model: 174.92 Canvin 20081001 normalized grayscale Terrain Model: 133.25 Ontanaya 20081001 normalized grayscale Terrain Model: 131.69 Butler 20081006 normalized grayscale Terrain Model: 132.78 Sassen 20081031 normalized grayscale Terrain Model: 173.59 -------------------- Some higher resolution images available at my photostream: http://www.flickr.com/photos/31678681@N07/
|
|
|
|
|
|
|
Feb 3 2009, 02:58 AM
Post
#789
|
||
|
Senior Member Group: Moderator Posts: 2785 Joined: 10-November 06 From: Pasadena, CA Member No.: 1345 |
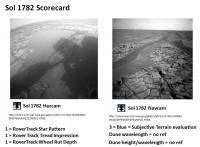
Scorecard for Sol 1782:
For the UMSF Terrain Models, here are 10 m x 10 m normalized grayscale pixel averages for Oppy's 1782 position: HiRise (raw): 133.41 HiRise (normalized): 214.88 Malaska 20081003 normalized grayscale Terrain Model: 173.7 Canvin 20081001 normalized grayscale Terrain Model: 143.95 Ontanaya 20081001 normalized grayscale Terrain Model: 134.86 Butler 20081006 normalized grayscale Terrain Model: 149.28 Sassen 20081031 normalized grayscale Terrain Model: 142.69 -------------------- Some higher resolution images available at my photostream: http://www.flickr.com/photos/31678681@N07/
|
|
|
|
|
|
|
Feb 3 2009, 03:01 AM
Post
#790
|
||
|
Senior Member Group: Moderator Posts: 2785 Joined: 10-November 06 From: Pasadena, CA Member No.: 1345 |
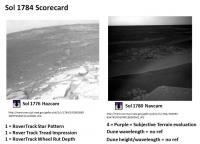
Scorecard for Sol 1784:
For the UMSF Terrain Models, here are 10 m x 10 m normalized grayscale pixel averages for Oppy's 1784 position: HiRise (raw): 128.06 HiRise (normalized): 182.83 Malaska 20081003 normalized grayscale Terrain Model: 155.88 Canvin 20081001 normalized grayscale Terrain Model: 187.91 Ontanaya 20081001 normalized grayscale Terrain Model: 151.20 Butler 20081006 normalized grayscale Terrain Model: 131.29 Sassen 20081031 normalized grayscale Terrain Model: 218.06 -------------------- Some higher resolution images available at my photostream: http://www.flickr.com/photos/31678681@N07/
|
|
|
|
|
|
|
Feb 3 2009, 04:53 AM
Post
#791
|
||
|
Senior Member Group: Moderator Posts: 2785 Joined: 10-November 06 From: Pasadena, CA Member No.: 1345 |
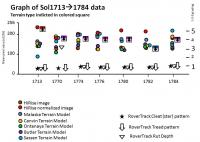
Graph of Sol1713 (Santorini)-->Sol1784 observables and 10x10 m avg. values from the various UMSF Terrain models:
-Mike And here is an EXCEL table with this and a bunch o' derived data:  UMSF_Terrain_Model_evaluation.xls ( 33.5K )
Number of downloads: 271
UMSF_Terrain_Model_evaluation.xls ( 33.5K )
Number of downloads: 271-------------------- Some higher resolution images available at my photostream: http://www.flickr.com/photos/31678681@N07/
|
|
|
|
|
|
|
Feb 3 2009, 09:34 AM
Post
#792
|
||||||
|
Member Group: Members Posts: 236 Joined: 5-June 08 From: Udon Thani Member No.: 4185 |
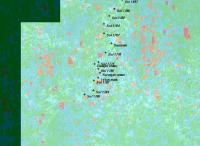
Relative variance calculated for the present area, this seems to match quite good with IR measurements by CRISM
Furthermore there is some match with several chemicals:
Relative amount of ferric minerals
Iron minerals
high Ca pyroxine I guess above similarities are mostly caused by exposed bedrock on yellow brick road? Regards, Geert. |
|||||
|
|
|
|||||
|
Feb 3 2009, 12:50 PM
Post
#793
|
|
|
Senior Member Group: Moderator Posts: 2785 Joined: 10-November 06 From: Pasadena, CA Member No.: 1345 |
QUOTE (Geert @ Feb 3 2009, 04:34 AM)  I guess above similarities are mostly caused by exposed bedrock on yellow brick road? I'd like to think so... The mineral maps are using IR spectral response (brightness at diagnostic wavelengths) to determine relative abundance of chemicals. But in the the case of a very subtle mineral variation (i.e. close to overinterpreting spectral noise), they could be "fooled" by brightness variations as well. (Note how high Ca pyroxene and iron minerals are perfectly anti-correlated, and match perfectly/inversely with IR/RED variance. It would be comforting to see an "outcrop of minerals" that doesn't correlate/anticorrelate to RED brightness/darkness.) -Mike -------------------- Some higher resolution images available at my photostream: http://www.flickr.com/photos/31678681@N07/
|
|
|
|
|
Feb 3 2009, 07:31 PM
Post
#794
|
||
|
Senior Member Group: Moderator Posts: 2785 Joined: 10-November 06 From: Pasadena, CA Member No.: 1345 |
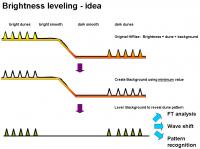
As was mentioned much, much, earlier in this thread, it is possible that subtle regional brightness artifacts are significantly influencing all the terrain models. It would be neat to remove/subtract the regional brightness variations to leave just the local brightness variations due to the ripple patterns. The remaining patterns could then be used for FT analysis, differential shift analysis, and pattern recognition.
Assuming every pixel in the HiRise image is a result of dune top brightness (A) + background (B), then the dune trough pixel value could be used to create the background (B) layer. (Note that the minimum value would be best to make the background layer, not the average value).
The trick will be to find the best way of using Photoshop to create a minimum brightness layer that then gets blurred to fill in the gaps for eventual image subtraction. Any advice? If anybody want to try their hand at this, Ive placed a normalized HiRise image of the S Victoria region here as a JPEG file (12.5% full HiRise or 2 m/pixel scale): http://www.flickr.com/photos/31678681@N07/3249065487/ A 30 Mb TIFF file of the same image is available here: http://www.speedyshare.com/643201551.html -------------------- Some higher resolution images available at my photostream: http://www.flickr.com/photos/31678681@N07/
|
|
|
|
|
|
|
Feb 4 2009, 12:00 AM
Post
#795
|
|
|
Member Group: Members Posts: 236 Joined: 5-June 08 From: Udon Thani Member No.: 4185 |
QUOTE (Juramike @ Feb 4 2009, 02:31 AM) Assuming every pixel in the HiRise image is a result of dune top brightness (A) + background (  , then the dune trough pixel value could be used to create the background ( layer. (Note that the minimum value would be best to make the background layer, not the average value). , then the dune trough pixel value could be used to create the background ( layer. (Note that the minimum value would be best to make the background layer, not the average value).I think indeed all terrain calculations are more or less influenced by brightness variations, if you just calculate a false color image of the brightness you already get results which closely match terrain calculations which is weird. This however does not say we are only calculating 'noise', as you have proved all to clearly there is a nice match between actual rover driving conditions and predictions from our terrain models. Furthermore there is a good match with THEMIS night IR measurements as I have shown earlier, THEMIS seems to show very nicely were the dune-area's are and this closely matches our predictions. I think the problem with filtering is that the dune's aren't nice sinusoid and their 'wavelength' as well as their direction variates a lot, so trying to filter on one particular wavelength/direction results in the loss of a lot of information. Furthermore, the bedrock-area's as well as crater-edges and such causes a lot of 'disturbance' as they are also exceeding the average brightness. Dunes on exposed bedrock are different from dunes on sand, or at least they are to our filters. I am not working with photoshop, as I convert the images to a multi-dimensional matrix and then work with software on the data itself which gives me the most flexibility in what I wish to calculate and show, but what I'm trying to do at present is see if I can let the software recognize certain 'fingerprints' of variations (for instance caused by bedrock, or craters, or dunes, etc), and work from there onwards. There is a lot more to the terrain calculations then only showing the dune's, by the time we have perfected our 'dune-model' we might be already outside that area! Regards, Geert. |
|
|
|
|

|
Lo-Fi Version | Time is now: 28th May 2024 - 02:42 AM |
|
RULES AND GUIDELINES Please read the Forum Rules and Guidelines before posting. IMAGE COPYRIGHT |
OPINIONS AND MODERATION Opinions expressed on UnmannedSpaceflight.com are those of the individual posters and do not necessarily reflect the opinions of UnmannedSpaceflight.com or The Planetary Society. The all-volunteer UnmannedSpaceflight.com moderation team is wholly independent of The Planetary Society. The Planetary Society has no influence over decisions made by the UnmannedSpaceflight.com moderators. |
SUPPORT THE FORUM Unmannedspaceflight.com is funded by the Planetary Society. Please consider supporting our work and many other projects by donating to the Society or becoming a member. |
|