Endeavour Drive - Drivability analysis |

  |
Endeavour Drive - Drivability analysis |
 Mar 6 2009, 08:03 AM Mar 6 2009, 08:03 AM
Post
#826
|
|
|
Member  Group: Members Posts: 202 Joined: 9-September 08 Member No.: 4334 |
This is (at least) a bit premature, but when we get to the rim of Endeavour, are there expected to be problems with crossing the crater-rim hills? Oppy will be pretty old by that point...
|
 |
 
|
|
Mar 6 2009, 09:03 AM
Post
#827
|
||
 Member Group: Members Posts: 236 Joined: 5-June 08 From: Udon Thani Member No.: 4185 |
QUOTE (Vultur @ Mar 6 2009, 03:03 PM)  This is (at least) a bit premature, but when we get to the rim of Endeavour, are there expected to be problems with crossing the crater-rim hills? Oppy will be pretty old by that point... I guess a lot would depend on how many wheels are still operating if/when she reaches Endeavour. Below is a 'quick' analysis of some of the hills on the crater rim, basically the terrain around the hills looks nice and flat and there are plenty 'holes' in the hills to pass inside the crater, but the hills themselves look quite rough.
Personally I think the area just on the foot of the hills looks a bit like an old shoreline, if this is true that might be the most interesting place to study and it might be within reach. Regards, Geert |
|
|
|
|
|
|
Mar 6 2009, 12:27 PM
Post
#828
|
|
 Senior Member Group: Moderator Posts: 2785 Joined: 10-November 06 From: Pasadena, CA Member No.: 1345 |
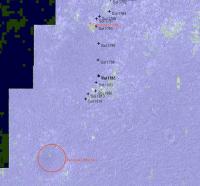
QUOTE (Geert @ Mar 6 2009, 02:33 AM) Chemical composition values as measured by CRISM, note that these are also influenced by IR brightness so should be treated with caution. Nice! I'm interested in the Themis bump near waypoint 15-16, to the S of Porcupine Crater. I wonder if that is due to the brigthness (or signature) of the bedrock exposure. It looks similar to the spike near Conjunction Junction (Sol1710). That also looks like the last major piece of bedrock for a while as the terrain smooths out to flatter sand on the proposed route. -Mike -------------------- Some higher resolution images available at my photostream: http://www.flickr.com/photos/31678681@N07/
|
|
|
|
|
Mar 6 2009, 06:37 PM
Post
#829
|
|||
|
Member Group: Members Posts: 236 Joined: 5-June 08 From: Udon Thani Member No.: 4185 |
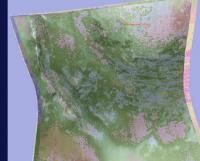
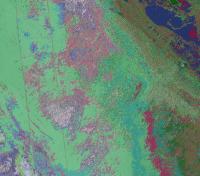
Mike, I have been quite busy these last weeks in trying to find correlation functions between your wheel-resistance figures (as analyzed from the images of wheelrim, starpatern, etc) and the various data from orbital satellites (HiRISE, CRISM, THEMIS). Previously I worked with 'filters' which more or less did the same but I now made the software 'smart' enough to start looking for patterns itself and match terrain to your data-points.
Although I can create images for terrain roughness also using this method, it works best for wheel resistance and soil-type.
Above image is the result of the 'soil-analyses' for the area immediately surrounding Victoria, carried out by comparing your data on wheel resistance with the orbital data. The whole thing still needs more fine-tuning, but it is starting to produce results. Blue is 'moderate' wheel resistance and green is light wheel resistance. It is quite amazing to see patterns appearing where HiRISE seemingly does not see any difference. According this analysis, the area to the east of Victoria would have shown less wheel-resistance and better driving then the westerly part, might be long before we ever find out whether that's true but it is interesting ;-).
The present area, it seems to pick up the larger bedrock patches (owing to the lower CRISM resolution this method doesn't work well on very small area's). The sand area inside Porcupine 'looks' different to the eye, however this type of terrain has as yet not been 'sampled' so the software won't find a match with historical data. Note that these colors only show expected wheel resistance and bearing-strength of the soil, it doesn't say anything about terrain roughness etc! Disadvantage of the thing is that it needs CRISM data to work, I can make it work with only THEMIS and HiRISE but then results are far less accurate, so hopefully there will be some more CRISM images of the route further south. |
||
|
|
|
||
|
Mar 18 2009, 05:03 AM
Post
#830
|
|||
|
Member Group: Members Posts: 236 Joined: 5-June 08 From: Udon Thani Member No.: 4185 |
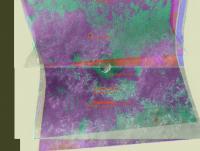
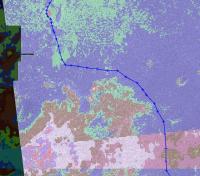
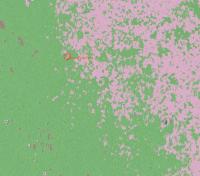
Distribution of Ferric and Iron minerals in Victoria and Endeavour region.
Note the colors in themselves are meaningless, however area's with the same measured quantities of minerals (within a certain bandwidth) are given the same color.
Images are created from the average of 5 different CRISM observations, basically the software checks the quantities for ferric and iron minerals for every position, then creates a mapping giving all positions with the same measured quantities the same color. |
||
|
|
|
||
|
Mar 18 2009, 05:11 AM
Post
#831
|
|||
|
Member Group: Members Posts: 236 Joined: 5-June 08 From: Udon Thani Member No.: 4185 |
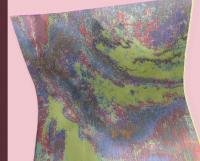
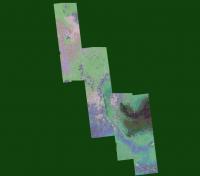
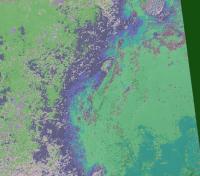
Distribution of (high-Ca and Low-Ca) pyroxenes in Victoria and Endeavour region, using same method as above.
Once again colors in themselves are meaningless but area's with the same distribution are given the same color.
|
||
|
|
|
||
|
Mar 18 2009, 05:21 AM
Post
#832
|
|||
|
Member Group: Members Posts: 236 Joined: 5-June 08 From: Udon Thani Member No.: 4185 |
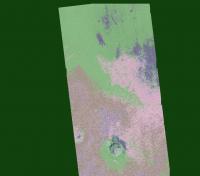
Terrain model created by comparing Mike's measurements of wheel resistance and dune heights with observed data from HiRISE and CRISM.
Note in this image the colors in themselves are meaningless, however area's with same properties are given same color.
Once again, note that colors in themselves are meaningless, so green does NOT mean 'perfect driving', however terrain with the same color can be expected to have the same properties (both wheel resistance and dune size/hight). |
||
|
|
|
||
|
Mar 18 2009, 02:49 PM
Post
#833
|
|
|
Senior Member Group: Moderator Posts: 2785 Joined: 10-November 06 From: Pasadena, CA Member No.: 1345 |
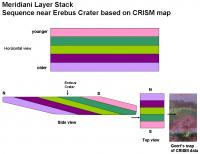
QUOTE (Geert @ Mar 18 2009, 12:03 AM) Distribution of Ferric and Iron minerals in Victoria and Endeavour region. Note the colors in themselves are meaningless, however area's with the same measured quantities of minerals (within a certain bandwidth) are given the same color. This is VERY cool. Would it be possible to add in the topographic data? I think this is creating a pretty geologic map of Meridiani planum with the exposed strata having slightly different mineral components. With the topographic data added, it should be possible to create a side view of the different layers. Here is a previous graphic based on an abstract by Sullivan et al., 2008. (post 731, this thread) The topographic data might also explain the curviness of mineral exposures seen near Endeavour crater seen in your lower graphics. IIRC, as we head south we are going into younger terrain. So each band southward sat above the older northern band in the layer stack. -Mike -------------------- Some higher resolution images available at my photostream: http://www.flickr.com/photos/31678681@N07/
|
|
|
|
|
Mar 18 2009, 03:15 PM
Post
#834
|
||
|
Senior Member Group: Moderator Posts: 2785 Joined: 10-November 06 From: Pasadena, CA Member No.: 1345 |
Here's a graphic based on Geert's CRISM (Fe and Ferric minerals) map and the Sullivan et al. abstract of the layering sequence in Oppy's location in Meridiani:
-Mike -------------------- Some higher resolution images available at my photostream: http://www.flickr.com/photos/31678681@N07/
|
|
|
|
|
|
|
Mar 18 2009, 04:02 PM
Post
#835
|
|
|
Member Group: Members Posts: 236 Joined: 5-June 08 From: Udon Thani Member No.: 4185 |
QUOTE (Juramike @ Mar 18 2009, 09:49 PM) This is VERY cool. Would it be possible to add in the topographic data? Technically it should be possible, as I mentioned before I developed a dataset with all data (CRISM, HiRISE, THEMIS, etc) in digital format linked to a lat/lon grid, so I can relate anything to anything and project it in any which way and just let the computer crunch out the results (I'm more or less writing the software as I go along). Problem with the topographic data is that as yet I'm not very impressed with MOLA data, I know it's a wonderful tool but at the distance scales we are talking about it's not giving me very much fabric to cling to. Basically the easiest format for me would be a greyscale map-projected 'image' with brightness relating to height but it needs to be very high resolution in order to spot the correlation you're trying to find. An other option might be to simply take a number of lat/lon positions and check their heights in Google-Mars, and from that I can probably let the thing produce a graph relating height to composition... Let's say I'll work on it ;-) With regards to CRISM note that this is all more or less 'raw' data, as has been mentioned before CRISM data is influenced by IR-brightness but it is difficult (for me) to know how much I need to correct for this, it's really nice to see pieces fit together and I love to play with this data and see what I can get out of it, but it's not a proper scientific study ;-). |
|
|
|
|
Mar 23 2009, 06:30 AM
Post
#836
|
||||||
|
Member Group: Members Posts: 236 Joined: 5-June 08 From: Udon Thani Member No.: 4185 |
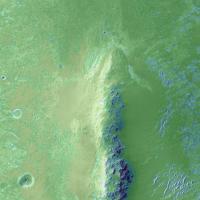
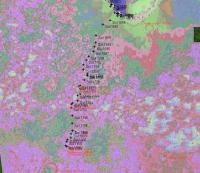
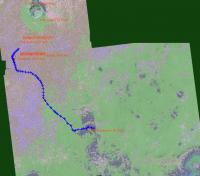
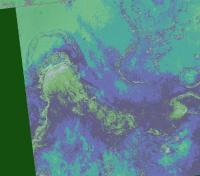
Further attempt on terrain specification for whole area. As CRISM data is not available for the complete area, this map is created by using HiRISE average brightness and variance, with THEMIS Night IR brightness data. I'm definitely not a geologist, so this is only an amateur-overview of what it looks like to me.
Note colors in this map do not necessarily define driving-characteristics, they just define terrain-type.
The map for the area north of Victoria seems to conform with my earlier CRISM analyses and with Mike's post here . It looks to me like the green area notes the hermatite-rich strata (basically flat surface with few ripples due to stronger top 'coating'). Further south the sulfate rich strata results in terrain with more dunes and ripples, while around Victoria crater the hermatite-rich ejecta has resulted in re-appearance of the "green" flat terrain. Darker 'windstreaks' downwind of several features might be area's were darker, basaltic, dust was deposited by the wind. I don't know why the sulfate rich strata seems to come in to 'varieties' in this map (light purple to the northeast, then a small band of 'green' and then the dark brown/purple which define the larger ripples north of Victoria and around Erebus).
Further south of Victoria the hermatite-rich strata surfaces again, resulting in re-appearance of the 'green' terrain. Unfortunately the MOLA data I have in my dataset at the moment is not yet accurate enough to correlate this map with topographic data.
Finally, when entering Endeavour crater it seems to me that there is more darker (basaltic?) tinted sand, which is also present on the planes south of endeavour. There do seem to be several layers of terrain types when descending into Endeavour. There is still a lot to explore ;-) |
|||||
|
|
|
|||||
|
Mar 23 2009, 08:01 AM
Post
#837
|
||||||||
|
Member Group: Members Posts: 236 Joined: 5-June 08 From: Udon Thani Member No.: 4185 |
Can't resist to post a few more images made with above mentioned computer technique.
Don't know how much (or how little) of this really relates to anything and how much is just computer-enhanced garbage but otherwise we can always put it down as abstract art ;-).
Endurance crater and surrounding area
Vostok area
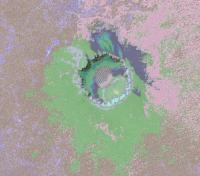
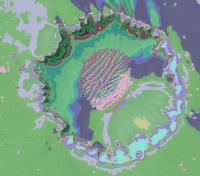
Victoria crater interior
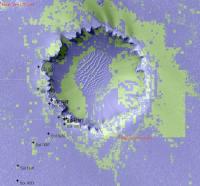
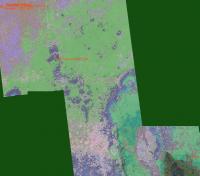
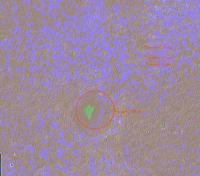
Porcupine area. (Note: this is NOT a 'driving' map, colors refer only to terrain-type and have no further meaning as such).
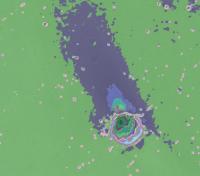
NW Entrance into Endeavour crater
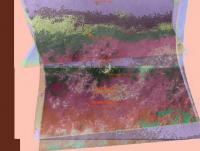
South slopes of Endeavour (Medusa Rock can be seen on the right in middle)
Ridge on the plane south of Endeavour |
|||||||
|
|
|
|||||||
| Guest_Oersted_* |
Mar 23 2009, 02:08 PM
Post
#838
|
|
Guests |
Your "artwork" is much appreciated Geert!
|
|
|
|
|
Mar 23 2009, 02:35 PM
Post
#839
|
|
 Senior Member Group: Members Posts: 1281 Joined: 18-December 04 From: San Diego, CA Member No.: 124 |
They do look cool, and they are the right size for CD artwork as well
 QUOTE Porcupine area. (Note: this is NOT a 'driving' map, colors refer only to terrain-type and have no further meaning as such). I know this probably exists in the thread earlier on, but is there a key to those colors? -------------------- Lyford Rome
"Zis is not nuts, zis is super-nuts!" Mathematician Richard Courant on viewing an Orion test |
|
|
|
|
Mar 23 2009, 03:19 PM
Post
#840
|
|
|
Member Group: Members Posts: 236 Joined: 5-June 08 From: Udon Thani Member No.: 4185 |
QUOTE (lyford @ Mar 23 2009, 10:35 PM) I know this probably exists in the thread earlier on, but is there a key to those colors? Nope, in this case there's no key, the colors in themselves have no meaning, they just mark area's with similar characteristics (within a certain bandwidth). What the software does is searching the dataset for as much data as possible about each pixel position (as CRISM is unfortunately not available for the complete area and THEMIS has only low res, most important are average grid-brightness and variation within a grid centered on the position). Each pixel then gets a string associated with it, which basically states all measurements relating to this pixel divided by a bandwidth factor. Once this is done for all pixels, the computer assigns random colors to all measurement-strings and marks all pixels with this string in this color. So each color marks a specific set of measurements and all positions with this color will have the same terrain characteristics, but the color in itself is meaningless. Although these images are mainly created from HiRISE data, it is remarkable how much resemblance there is with the CRISM measurements I posted earlier, which gives a bit of confidence that at least some of these layers the software seems to detect indeed do relate to 'something', however you would need a lot more data (or ground-checks) to know what chemical or geological feature is causing one specific layer to appear in the image. My software only shows there is a layer but it doesn't say much about what it is made of... (and as I already mentioned, there is probably a lot of 'garbage' in it, sun-shadows, etc). |
|
|
|
|

|
Lo-Fi Version | Time is now: 28th May 2024 - 09:47 PM |
|
RULES AND GUIDELINES Please read the Forum Rules and Guidelines before posting. IMAGE COPYRIGHT |
OPINIONS AND MODERATION Opinions expressed on UnmannedSpaceflight.com are those of the individual posters and do not necessarily reflect the opinions of UnmannedSpaceflight.com or The Planetary Society. The all-volunteer UnmannedSpaceflight.com moderation team is wholly independent of The Planetary Society. The Planetary Society has no influence over decisions made by the UnmannedSpaceflight.com moderators. |
SUPPORT THE FORUM Unmannedspaceflight.com is funded by the Planetary Society. Please consider supporting our work and many other projects by donating to the Society or becoming a member. |
|