Charon Surface Observations: NH Post-Encounter Phase, 1 Aug 2015- TBD |

  |
Charon Surface Observations: NH Post-Encounter Phase, 1 Aug 2015- TBD |
 Oct 13 2015, 12:16 AM Oct 13 2015, 12:16 AM
Post
#76
|
||||
 IMG to PNG GOD  Group: Moderator Posts: 2250 Joined: 19-February 04 From: Near fire and ice Member No.: 38 |
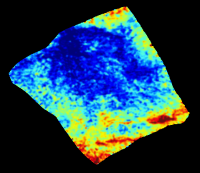
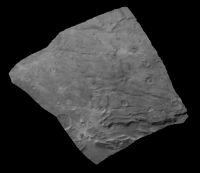
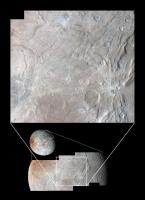
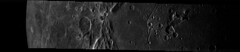
I have been experimenting with generating a DEM of Charon from a stereo pair. The resulting DEM is extremely crude and noisy, my software isn't very sophisticated and the JPG compression artifacts mess things up but at least I'm getting something that may be interesting. Here is a color coded DEM in simple cylindrical projection generated using images lor_0299175643_0x630_sci_4.jpg and lor_0299168728_0x630_sci_3.jpg together with an image showing the terrain convered by the DEM:
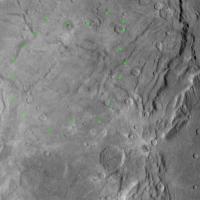
The are some errors due to the fact that I don't know the exact viewing geometry of the source images (the accuracy to which I could reverse engineer it is limited). The DEM is also noisy and low-res but it can be used to make crude estimates of relative elevation differences. For example the big crater at the left edge is probably 1-1.5 km deep. The depression/'canyon' at bottom and extending to the right edge is probably ~2.5 km deep but this is somewhat difficult to estimate due to noise in the DEM and the depth may also be variable. But what's really interesting is that the DEM reveals a possible gentle, large scale depression (the big blue area). I can't completely rule out that the southern edge of this feature could be an artifact caused by inaccurate viewing geometry but a more probable explanation is that this is a real feature. Here is one of the two images I used to make the DEM with the very approximate boundary of the possible depression indicated with green dots:
I think it should be possible to generate considerably better DEMs than this one, even when JPG source images are used. I have been looking for software (mainly free/open source stuff) to use instead of what I'm using now. I don't know yet what's going to come out of that but a lot has happened in this field since I originally wrote my (crude) stereo software several years ago. |
|||
 |
 
|
|||
|
Oct 13 2015, 02:41 AM
Post
#77
|
||
|
Member Group: Members Posts: 890 Joined: 18-November 08 Member No.: 4489 |
for low frequency heights like that the sfs i use is mostly useless
it is good on hi-frequency data like the rift on the right for this stereo is needed then run the sfs from ASP on the Gtiff from stereo-pipline ( a hi-breed sfs with the stereo using the spice data ) this is what i get -- good for wrapping around a sphere mesh for 3d shading but--- has problems a 8 bit height map for " lor_0299175643_0x630_sci_4.jpg"
the lower half of the creator is ??? iffy maybe ??? some what visible in mine but that is only in a side by side with your green dots |
|
|
|
|
|
|
Oct 13 2015, 10:05 AM
Post
#78
|
||
 Member Group: Members Posts: 796 Joined: 27-February 08 From: Heart of Europe Member No.: 4057 |
QUOTE (Bjorn Jonsson @ Oct 13 2015, 02:16 AM)  But what's really interesting is that the DEM reveals a possible gentle, large scale depression (the big blue area). I can't completely rule out that the southern edge of this feature could be an artifact caused by inaccurate viewing geometry but a more probable explanation is that this is a real feature. I see major parts of your big blue area as depression but I think that circular shape is partly caused by artifacts. I think that central part (ridges) has different origin. My interpretation is that depressions are probably part of the same event which caused southern hemisphere resurfacing. Here is quick graphics which shows boundaries of different areas. Blue boundary is edge of resurfaced southern hemisphere. Green boundary is continuation of this resurfacing event through central chasmata system. Red boundary shows edges of another depressions (they are visible in your DEM) which could be another part of the same southern hemisphere resurfacing event.
Attached thumbnail(s)
-------------------- |
|
|
|
|
|
|
Oct 13 2015, 02:56 PM
Post
#79
|
|
|
Senior Member Group: Members Posts: 2998 Joined: 30-October 04 Member No.: 105 |
Agreed. The green-dotted depression is probably not a depression and, from the surface morphology, appears to be flatish or possibly a slightly positive elevation. It is probably a result of activity in the area of "Ripley" crater. There many changes with some resurfacing and it seems to occur in episodic events. More and more details pop out with increases in resolution-- this is going to be an interesting little world to figure out.
I'm looking forward to the Dawn team producing an elevation map. In the meantime, what are your feelings on the topography of "Mordor" macula? This feature does appear to be a depression, with the deepest rim being on the Pluto-side (left) and a shallower rim being on the anti-Pluto (right) side. I believe that feature will turn out to be the strangest of the strange on Charon. --Bill -------------------- |
|
|
|
|
Oct 13 2015, 06:01 PM
Post
#80
|
|||
|
Member Group: Members Posts: 866 Joined: 15-March 05 From: Santa Cruz, CA Member No.: 196 |
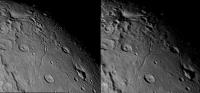
crosseye and parellel excerpt from Machi's stereo
yet another mystery wrapped in a connundrum, as if a cryovolcanic plug rose from one but why not the the other? although there is a minimountain just behind it. the fault line almost equidistant and perpendicular between the disparate moats mere coincidence?
|
||
|
|
|
||
|
Oct 16 2015, 05:23 PM
Post
#81
|
|
 Member Group: Members Posts: 714 Joined: 3-January 08 Member No.: 3995 |
|
|
|
|
|
Oct 16 2015, 06:08 PM
Post
#82
|
||
 Senior Member Group: Moderator Posts: 3233 Joined: 11-February 04 From: Tucson, AZ Member No.: 23 |
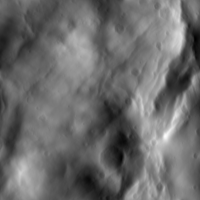
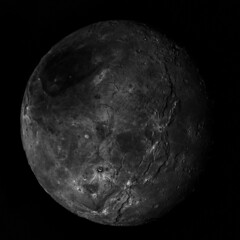
Here's a quick mosaic of the C_MVIC_LORRI_CA images.
-------------------- &@^^!% Jim! I'm a geologist, not a physicist!
The Gish Bar Times - A Blog all about Jupiter's Moon Io |
|
|
|
|
|
|
Oct 16 2015, 08:04 PM
Post
#83
|
|
|
Member Group: Members Posts: 137 Joined: 16-June 15 Member No.: 7507 |
Okay, wow. If I only saw the right hand side of that I'd have thought it was Pluto! It's got the same sort of (what we've been presumling is sublimation pitting) that we see on Pluto - that's so neat! And it's not everywhere, either...
We also got the "three hills in a moat" terrain, our first closeup of one of the moats. Looks like a large chunk of the western side is slumping into it. A couple small areas also look to be slumped. The biggest moat there is polygonal - doesn't look like a crater at all. And there's some rather weird low-relief structures near its southern end and in the craters to the south - no idea what those might be. Kind of like something bubbled up there or something. |
|
|
|
|
Oct 16 2015, 08:51 PM
Post
#84
|
|
|
IMG to PNG GOD Group: Moderator Posts: 2250 Joined: 19-February 04 From: Near fire and ice Member No.: 38 |
QUOTE (Nafnlaus @ Oct 16 2015, 08:04 PM) Okay, wow. If I only saw the right hand side of that I'd have thought it was Pluto! It's got the same sort of (what we've been presumling is sublimation pitting) that we see on Pluto I'm sure I've seen very similar pitted terrain elsewhere (not including Pluto) and I'm trying to remember where. Probably on Mercury, the Moon or Mars. |
|
|
|
|
Oct 16 2015, 08:56 PM
Post
#85
|
|||
 Member Group: Members Posts: 244 Joined: 2-March 15 Member No.: 7408 |
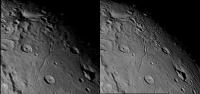
Extreme stereo view on Charon.
Parallel viewing:
Cross-Eye viewing:
|
||
|
|
|
||
|
Oct 16 2015, 09:59 PM
Post
#86
|
|
|
Senior Member Group: Members Posts: 3516 Joined: 4-November 05 From: North Wales Member No.: 542 |
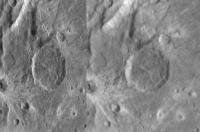
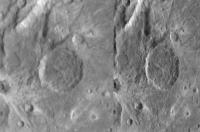
I'm intrigued by the dark-splat-in-the-middle-of-a-bright-splat in this image. (It appears at the edge of Herobrine's 3D view above.) The dark splat is presumably more recent than the larger bright one. I think it unlikely that very differently toned materials were thrown out by the two events, so I come round to the idea that ejecta change colour with time in a non-monotonic way. They are dark at first before bleaching out, and only then dull down again to match the general tone of the surroundings. Any thoughts?
http://pluto.jhuapl.edu/soc/Pluto-Encounte...0x630_sci_4.jpg |
|
|
|
|
Oct 16 2015, 10:29 PM
Post
#87
|
|
|
Senior Member Group: Moderator Posts: 3233 Joined: 11-February 04 From: Tucson, AZ Member No.: 23 |
It could also be due to layering in the near-surface of Charon. IIRC the more distal, bright rays should come from material that was near the surface while the closer dark ones would result from ejects that originated at greater depths.
-------------------- &@^^!% Jim! I'm a geologist, not a physicist!
The Gish Bar Times - A Blog all about Jupiter's Moon Io |
|
|
|
|
Oct 16 2015, 10:56 PM
Post
#88
|
|
|
Senior Member Group: Members Posts: 3516 Joined: 4-November 05 From: North Wales Member No.: 542 |
Interesting, but I find it hard to believe that the bigger impact missed the dirt but the later smaller one found it.
Or are you saying that it was all exposed at once, with dark and light ejecta zones mapping the subsurface layers? |
|
|
|
|
Oct 17 2015, 12:04 AM
Post
#89
|
|
|
Member Group: Members Posts: 890 Joined: 18-November 08 Member No.: 4489 |
a few 3d renders from
http://pluto.jhuapl.edu/soc/Pluto-Encounter/index.php lor_0299180418_0x630_sci_3.jpg lor_0299180415_0x630_sci_4.jpg ---------- joined the two then created a heightmap from that 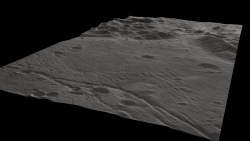 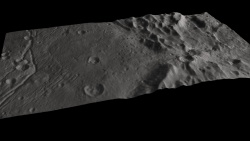 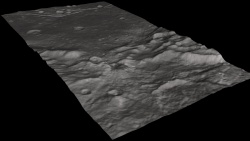 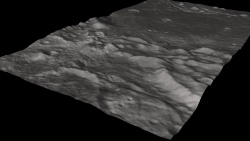 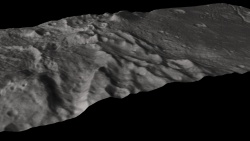  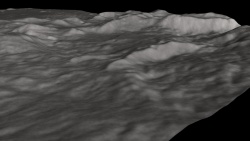
|
|
|
|
|
Oct 17 2015, 03:35 AM
Post
#90
|
|
 Member Group: Members Posts: 146 Joined: 22-November 14 From: Bormida (SV) - Italy Member No.: 7348 |
Here the last mosaics
  EDIT anaglyph 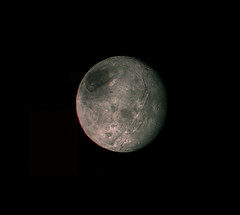
-------------------- |
|
|
|
|

|
Lo-Fi Version | Time is now: 28th April 2024 - 04:13 PM |
|
RULES AND GUIDELINES Please read the Forum Rules and Guidelines before posting. IMAGE COPYRIGHT |
OPINIONS AND MODERATION Opinions expressed on UnmannedSpaceflight.com are those of the individual posters and do not necessarily reflect the opinions of UnmannedSpaceflight.com or The Planetary Society. The all-volunteer UnmannedSpaceflight.com moderation team is wholly independent of The Planetary Society. The Planetary Society has no influence over decisions made by the UnmannedSpaceflight.com moderators. |
SUPPORT THE FORUM Unmannedspaceflight.com is funded by the Planetary Society. Please consider supporting our work and many other projects by donating to the Society or becoming a member. |
|