Mgs Resolves Meridiani-like Outcrops |

  |
Mgs Resolves Meridiani-like Outcrops |
| Guest_Richard Trigaux_* |
 May 1 2006, 06:33 AM May 1 2006, 06:33 AM
Post
#16
|
|
Guests |
Woaow
 super images super imagesI wonder, if they took the scene with Oppy, we could clearly see it. With a bit of luck, they will image it, in order to find a safe path. |
 |
 
|
|
May 1 2006, 10:32 AM
Post
#17
|
|
 Junior Member  Group: Members Posts: 29 Joined: 6-April 06 From: Finland > Turku Member No.: 733 |
QUOTE (SigurRosFan @ Apr 30 2006, 07:18 PM)  stange... I think there is more craters, than meridiani. But beautiful photo. Why MGS don't take pictures from meridiani by same resolution? |
|
|
|
|
May 1 2006, 11:22 AM
Post
#18
|
|
|
Founder Group: Chairman Posts: 14432 Joined: 8-February 04 Member No.: 1 |
QUOTE (FIN Mars @ May 1 2006, 10:32 AM) Why MGS don't take pictures from meridiani by same resolution? It has - these are much larger dunes and other features than at Meridiani - but that image is no higher res than the best images of Meridiani. Doug |
|
|
|
|
May 1 2006, 12:13 PM
Post
#19
|
|
|
Member Group: Members Posts: 235 Joined: 2-August 05 Member No.: 451 |
QUOTE (djellison @ May 1 2006, 05:22 AM) It has - these are much larger dunes and other features than at Meridiani - but that image is no higher res than the best images of Meridiani. I see. the image says it is 3 km wide, and there are about 100 dunes across the width, so the dunes here are on average 30 meters apart, whereas on Meridiani they seem to be three to five meters apart. So why would these be similar, but scaled so differently? different grain size, density, or cohesiveness? different prevailing wind speed? |
|
|
|
|
May 1 2006, 12:26 PM
Post
#20
|
|
|
Senior Member Group: Members Posts: 2998 Joined: 30-October 04 Member No.: 105 |
"All of the above". We have similar appearances with a diiferent scale, so the processes and geology must be different.
And the "paving stones" are also much larger than the ones at Meridiani. --Bill -------------------- |
|
|
|
|
May 1 2006, 01:22 PM
Post
#21
|
||
 Member Group: Members Posts: 362 Joined: 12-June 05 From: Kiama, Australia Member No.: 409 |
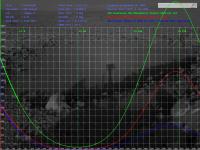
QUOTE (helvick @ Jan 13 2006, 10:38 AM) The southern edge of Hellas would be way too far south for an unmodified MER type rover to survive for more than a couple of months, it would defenitely die around Sol 60. [attachment=3333:attachment] These are generated using standard MER-A parameters for landing date, solar panel area, cell efficiency and I used the published MER-A TAU values for Sols 0-190. If such a rover followed the actual MER mission experiences the power generated by the panels would follow the blue line give or take 100 watt hours for the first 400 Sols . Depending on cleaning events it can rise back as far as the red line. You could get 250+ sols if you landed the rover when the solar cycle is at the equivilant of sol450 on yuor graph. Dont know if it is possibly to lauch for such an arrival time? Graph courtesy Helvick
Attached thumbnail(s)
|
|
|
|
|
|
|
May 1 2006, 01:47 PM
Post
#22
|
|
|
Founder Group: Chairman Posts: 14432 Joined: 8-February 04 Member No.: 1 |
Giving 200 Whrs as basically the cut-off of survivability, it's more like 90-150 sols on your graphs
Doug |
|
|
|
|
May 1 2006, 02:40 PM
Post
#23
|
|
 Dublin Correspondent Group: Admin Posts: 1799 Joined: 28-March 05 From: Celbridge, Ireland Member No.: 220 |
QUOTE (djellison @ May 1 2006, 01:47 PM) Giving 200 Whrs as basically the cut-off of survivability, it's more like 90-150 sols on your graphs I think abalone's point was that if you could land such a rover in late winter you could have rising overall insolation for 100 -150 or so Sols prior to the start of this sample chart of mine which was based on the Spirit landing date so a 250+ Sol mission might be possible, the 90-150 Sol limit is only the case if you land at the same time as spirit did in late summer at 60 or so Sols before the Autumnal equinox. The very rapid drop off in insolation with the onset of winter comes from the proximity to the martian "antartic" circle - this location is only 10 degrees closer to the equator than Phoenix's landing site. I don't know enough about mars transfer orbits to tell whether there are practical launch windows that could place such a lander on the surface at the right time. One possibility for "cheap" lander\rovers would be to develop core mechanics\electronics that could reliably hibernate through deep winter. Add in (semi) pointable solar arrays and you might be able to build a long lived rover or lander that could work at these latitudes for longer than a single summer season. RTG's are obviously the answer at the moment for large rovers like MSL but it would be nice to see a fleet of small sensor landers\rovers scattered across a much wider selection of terrains at some stage. |
|
|
|
|
May 1 2006, 02:57 PM
Post
#24
|
|
|
Member Group: Members Posts: 362 Joined: 12-June 05 From: Kiama, Australia Member No.: 409 |
QUOTE (djellison @ May 1 2006, 11:47 PM) Giving 200 Whrs as basically the cut-off of survivability, it's more like 90-150 sols on your graphs Doug I think you forget that on Helvicks graph it already includes dust accumulation for 450sols to get the blue estimate line at sol 450. If you landed at this stage actual power would be much higher and last much longer than 90-150 sols. Actual power would be closer to 450W ie. the red line |
|
|
|
|
May 1 2006, 03:38 PM
Post
#25
|
||
|
Dublin Correspondent Group: Admin Posts: 1799 Joined: 28-March 05 From: Celbridge, Ireland Member No.: 220 |
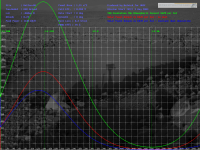
QUOTE (abalone @ May 1 2006, 02:57 PM) I think you forget that on Helvicks graph it already includes dust accumulation for 450sols to get the blue estimate line at sol 450. If you landed at this stage actual power would be much higher and last much longer than 90-150 sols. Actual power would be closer to 450W ie. the red line Like this for a fictitious landing at 60S starting on May 2 2003. It starts off at ~350whr per sol, rises to 870whr on Sol 130 and drops back below 300whr around Sol 270. A tiltable panel (or clever driving for a rover) could probably stretch that by another 100 sols or so.
|
|
|
|
|
|
|
May 1 2006, 04:36 PM
Post
#26
|
|
 Senior Member Group: Members Posts: 3419 Joined: 9-February 04 From: Minneapolis, MN, USA Member No.: 15 |
QUOTE (CosmicRocker @ Apr 30 2006, 11:14 PM) ...It's interesting to note how increasing resolutions and better spectral data have changed that view over time. The better we can see, the more interesting this place (and I guess, any place) becomes... While increasing levels of resolution are satisfying, I'd like to repeat Wilhelms' Caution, here. Which is that, in the heady days of lunar exploration of the 1960s and 1970s, the push for greater and greater resolutions of lunar vistas led to a steadily *worsening* understanding of the processes that shaped lunar evolution. Ground conditions can become coated with ubiquitous features -- regoliths, dust covers, cratering densities -- that make surfaces created by far different processes look very alike on fine scales. Wilhelms comes to the conclusion that, especially for the Moon, lower resolutions and larger scales provide better clues to the large-scale impact processes that shaped our companion world. While Mars is a different animal than the Moon, the same rules tend to apply. For example, on Mars, water- and air-driven erosion has distributed a poorly sorted covering of dust and rocks over underlying terrain features, making the fine details of the surface layer less than representative of the underlying units. In terms of spectral data, yes -- we've yet to come across a high-resolution limit at which we learn less and less about the processes that formed the rock in the first place. But since Mars has redistributed it surface quite a bit over time, fine spectral resolution doesn't ensure that you're seeing information about the composition of the underlying units, either. -the other Doug -------------------- The trouble ain't that there is too many fools, but that the lightning ain't distributed right. -Mark Twain
|
|
|
|
|

|
Lo-Fi Version | Time is now: 27th May 2024 - 08:18 PM |
|
RULES AND GUIDELINES Please read the Forum Rules and Guidelines before posting. IMAGE COPYRIGHT |
OPINIONS AND MODERATION Opinions expressed on UnmannedSpaceflight.com are those of the individual posters and do not necessarily reflect the opinions of UnmannedSpaceflight.com or The Planetary Society. The all-volunteer UnmannedSpaceflight.com moderation team is wholly independent of The Planetary Society. The Planetary Society has no influence over decisions made by the UnmannedSpaceflight.com moderators. |
SUPPORT THE FORUM Unmannedspaceflight.com is funded by the Planetary Society. Please consider supporting our work and many other projects by donating to the Society or becoming a member. |
|