Sol 3 and onwards - imaging |

Sol 3 and onwards - imaging |
 May 28 2008, 06:27 PM May 28 2008, 06:27 PM
Post
#1
|
|
|
Founder  Group: Chairman Posts: 14434 Joined: 8-February 04 Member No.: 1 |
Keeping with the practice of sol-by-sol discussions, here it is.
|
 |
 
|
 |
|
May 28 2008, 06:36 PM
Post
#2
|
||
|
Founder Group: Chairman Posts: 14434 Joined: 8-February 04 Member No.: 1 |
Not Sol 3 related - but it's a graphic image pulled out by Adobe Soundbooth of the Melacom recording from MEX
 If I had to guess, the bright part that finished at the bottom of the 'trough' would be the plasma 'blackout' period and the kink on the 'up' slope the 'chute deployment or the switch from 8k to 32k. The wider, brighter area covering most of the signal period, perhaps noise from HRSC or Spicam. If I had to guess, the bright part that finished at the bottom of the 'trough' would be the plasma 'blackout' period and the kink on the 'up' slope the 'chute deployment or the switch from 8k to 32k. The wider, brighter area covering most of the signal period, perhaps noise from HRSC or Spicam.Doug
Attached thumbnail(s)
|
|
|
|
|
|
|
May 28 2008, 07:45 PM
Post
#3
|
||
 Member Group: Members Posts: 646 Joined: 23-December 05 From: Forest of Dean Member No.: 617 |
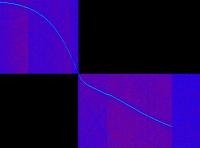
QUOTE (djellison @ May 28 2008, 06:36 PM)  Not Sol 3 related - but it's a graphic image pulled out by Adobe Soundbooth of the Melacom recording from MEX heh,.. when I played the file, my audio player's default visualisation module kicked in and produced this (it didn't fit onto one screen's width so I've crudely pasted chunks from two screenshots together to get the whole thing.) As scientific as a newpaper horoscope, of course but I notice the same harmonics (if that's what they are) show up in both visualisations though.
EDIT: Hmmm, Doug's shot shows a curve after the "bounce", whilst mine shows a straight line. Logarithmic vs. linear vertical scale perhaps? Any mathematicians in the house? -------------------- --
Viva software libre! |
|
|
|
|
|
|
May 29 2008, 04:55 AM
Post
#4
|
||
 The Insider Group: Members Posts: 669 Joined: 3-May 04 Member No.: 73 |
QUOTE (imipak @ May 28 2008, 12:45 PM) heh,.. when I played the file, my audio player's default visualisation module kicked in and produced this (it didn't fit onto one screen's width so I've crudely pasted chunks from two screenshots together to get the whole thing.) As scientific as a newpaper horoscope, of course but I notice the same harmonics (if that's what they are) show up in both visualisations though.EDIT: Hmmm, Doug's shot shows a curve after the "bounce", whilst mine shows a straight line. Logarithmic vs. linear vertical scale perhaps? Any mathematicians in the house? Ok, this is cool. I took the liberty of flipping the second half upside down to give a sense of continuity to the signal after it receded from the Mars Express. It's interesting to see the change in signal when Phoenix hit the atmosphere.
Attached thumbnail(s)
|
|
|
|
|
|
 djellison Sol 3 and onwards - imaging May 28 2008, 06:27 PM
 Sunspot LOL The press have such short attention spans. Th... May 28 2008, 06:34 PM
 JRehling QUOTE (Sunspot @ May 28 2008, 11:34 AM) L... May 28 2008, 09:08 PM stevelu QUOTE (JRehling @ May 28 2008, 01:08 PM) ... May 29 2008, 04:54 AM rlorenz QUOTE (stevelu @ May 29 2008, 12:54 AM) A... May 29 2008, 12:53 PM MahFL Still another day of arm unstow yet. May 29 2008, 01:03 PM stevelu QUOTE (rlorenz @ May 29 2008, 04:53 AM) G... May 29 2008, 05:38 PM kwan3217 Well, its getting to the point where they are sayi... May 28 2008, 06:35 PM volcanopele It is probably the "You mean, we have to repo... May 28 2008, 06:48 PM elakdawalla Actually, a lot of the press from JPL were headed ... May 28 2008, 07:24 PM ElkGroveDan It looks as though you and Doug have discovered a ... May 28 2008, 07:57 PM imipak Doug discovered it first... I suppose that makes i... May 28 2008, 08:48 PM kungpostyle QUOTE (ElkGroveDan @ May 28 2008, 02:57 P... May 28 2008, 08:19 PM Juramike I'm just curious, and horribly addicted: Whic... May 28 2008, 09:21 PM um3k University of Arizona seems to post the images as ... May 28 2008, 09:37 PM volcanopele Emily, the workspace mosaic you said you couldn... May 28 2008, 09:37 PM elakdawalla Thanks. I was looking at the NASA site for images... May 28 2008, 10:04 PM volcanopele I just used the Phoenix website's gallery page... May 28 2008, 10:27 PM mars loon At today's press conference, both the lack of ... May 29 2008, 12:49 AM stellarlight Hi!
Have you seen this news?
http://www.esa.i... May 29 2008, 12:51 AM centsworth_II QUOTE (stellarlight @ May 28 2008, 08:51 ... May 29 2008, 05:24 AM elakdawalla If you want to post a few here, go ahead and I... May 29 2008, 01:20 AM Gladstoner Question 1: "Do you have a workaround for the... May 29 2008, 01:36 AM nprev Okay, thanks! Here's a few; pick any you w... May 29 2008, 02:26 AM Steve G Any idea if they intend - or are able - to use the... May 29 2008, 02:35 AM nprev I think MARDI is still very much an open issue, bu... May 29 2008, 02:45 AM mcaplinger QUOTE (nprev @ May 28 2008, 06:45 PM) It ... May 29 2008, 03:54 AM Zeehond QUOTE (mcaplinger @ May 29 2008, 05:54 AM... May 29 2008, 04:06 AM Reed QUOTE (Zeehond @ May 28 2008, 09:06 PM) T... May 29 2008, 04:18 AM Zeehond QUOTE (Reed @ May 29 2008, 06:18 AM) This... May 29 2008, 04:21 AM Aussie I like nprev's question on any preliminary gu... May 29 2008, 03:07 AM helvick Some more questions for Emily (or anyone who can a... May 29 2008, 07:25 AM Zeehond New pictures are coming in now. The arm has moved. May 29 2008, 03:28 AM hal_9000 Anyone plan record the press conference? May 29 2008, 03:47 AM Zeehond QUOTE (hal_9000 @ May 29 2008, 05:47 AM) ... May 29 2008, 03:55 AM bgarlick and the non-fisheye panaorama...
http://phoenix.l... May 29 2008, 04:29 AM tim53 QUOTE (bgarlick @ May 28 2008, 08:29 PM) ... May 29 2008, 04:49 AM Joffan QUOTE (tim53 @ May 28 2008, 09:49 PM) Sad... May 29 2008, 06:19 AM Josh Cryer Quite enjoying the rawness of these new images... May 29 2008, 04:39 AM Zeehond QUOTE (Josh Cryer @ May 29 2008, 06:39 AM... May 29 2008, 04:44 AM Josh Cryer QUOTE (Zeehond @ May 28 2008, 09:44 PM) A... May 29 2008, 09:22 AM volcanopele QUOTE (Zeehond @ May 28 2008, 09:44 PM) A... May 29 2008, 05:33 AM Reed These birds eye views really bring out the polygon... May 29 2008, 06:01 AM CosmicRocker The polygons are gorgeous, and are probably the la... May 29 2008, 06:50 AM jamescanvin Nice new pics.
For those of you waiting for me to... May 29 2008, 07:36 AM Phil Stooke "Me, I'm a horizon kind of guy."
Ye... May 29 2008, 07:53 AM Juramike Coordinated view of my pseudocolor HiRISE image an... May 29 2008, 12:09 PM hal_9000 Moving... May 29 2008, 12:13 PM Pertinax Even more questions for Emily (or anyone who can a... May 29 2008, 01:36 PM Sunspot QUOTE (Pertinax @ May 29 2008, 02:36 PM) ... May 29 2008, 01:49 PM Pertinax QUOTE (Sunspot @ May 29 2008, 09:49 AM) I... May 29 2008, 02:29 PM Sunspot QUOTE (Pertinax @ May 29 2008, 03:29 PM) ... May 29 2008, 03:02 PM Pedro_Sondas The scoop:
and the RAC:
http://phoenix.lp... May 29 2008, 02:28 PM djellison It would be sort of cool to see the RAC with the ... May 29 2008, 02:30 PM ustrax I am happy...
On the 8th year of the 21st century ... May 29 2008, 02:35 PM Stu Oh dear god, we've created a monster! A MO... May 29 2008, 02:40 PM Sunspot ....and the rest of the article. May 29 2008, 03:04 PM hendric Q: Can Phoenix wake in the spring without its batt... May 29 2008, 03:13 PM djellison QUOTE (hendric @ May 29 2008, 04:13 PM) Q... May 29 2008, 03:40 PM Stu Here's a question for you Emily (or any Phoeni... May 29 2008, 03:50 PM jamescanvin As some of you may have noticed (thanks Algorimanc... May 29 2008, 04:34 PM Steve G Just completed watching the latest news conferance... May 29 2008, 06:32 PM djellison QUOTE (Steve G @ May 29 2008, 07:32 PM) y... May 29 2008, 06:48 PM Stu Starting to name rocks and features around the lan... May 29 2008, 06:34 PM Juramike QUOTE (Stu @ May 29 2008, 01:34 PM) Start... May 29 2008, 06:51 PM volcanopele A few thoughts from the press conference:
1) Emil... May 29 2008, 06:38 PM Steve G Too bad they didn't take the weight of the MAR... May 29 2008, 06:43 PM volcanopele From today's press release mosaic, a crop show... May 29 2008, 07:01 PM punkboi Go Phoenix! Waiting on the full-color panoram... May 29 2008, 07:03 PM Steve G Good shot (inverted up) to show scoop and deck. May 29 2008, 07:04 PM jamescanvin Well you've all already seen a version of this... May 29 2008, 08:11 PM algorimancer QUOTE (jamescanvin @ May 29 2008, 02:11 P... May 29 2008, 11:05 PM ahecht QUOTE (Steve G @ May 29 2008, 02:32 PM) J... May 29 2008, 08:16 PM djellison Phoenix - in TallovisioN - WAY more horizon relief... May 29 2008, 08:18 PM climber QUOTE (djellison @ May 29 2008, 10:18 PM)... May 29 2008, 08:35 PM Juramike QUOTE (djellison @ May 29 2008, 03:18 PM)... May 29 2008, 08:42 PM Nix QUOTE (djellison @ May 29 2008, 10:18 PM)... May 29 2008, 10:18 PM JRehling QUOTE (djellison @ May 28 2008, 11:27 AM)... May 29 2008, 08:30 PM djellison Open to suggestions on how to manage it especially... May 29 2008, 08:34 PM elakdawalla For those of you who only use inches as units for ... May 29 2008, 09:04 PM ugordan Ahhhh... The metric system. I heard about that one... May 29 2008, 09:07 PM climber QUOTE (elakdawalla @ May 29 2008, 11:04 P... May 29 2008, 09:10 PM Graham QUOTE (climber @ May 29 2008, 10:10 PM) T... May 29 2008, 09:39 PM ddeerrff QUOTE (climber @ May 29 2008, 04:10 PM) T... May 29 2008, 09:59 PM ElkGroveDan QUOTE (elakdawalla @ May 29 2008, 01:04 P... May 29 2008, 09:41 PM PFK That's instructive, but left me with a horribl... May 29 2008, 09:48 PM ElkGroveDan I was just going for familiarity. May 29 2008, 09:56 PM PFK QUOTE (ElkGroveDan @ May 29 2008, 10:56 P... May 29 2008, 10:10 PM Juramike Is there a site that has past Phoenix mission brie... May 29 2008, 09:58 PM ugordan QUOTE (Juramike @ May 29 2008, 11:58 PM) ... May 29 2008, 10:06 PM CAP-Team Here's a Dutch commercial for an insurance com... May 29 2008, 10:48 PM bgarlick Is there a way to know when each day's picture... May 29 2008, 11:29 PM Reed QUOTE (bgarlick @ May 29 2008, 03:29 PM) ... May 30 2008, 12:55 AM Fred Maybe I hadn't been following the mission clos... May 30 2008, 12:21 AM nilstycho Mars Descent Imager (MARDI) was on Phoenix, but it... May 30 2008, 12:29 AM bgarlick New images arriving.
Is this solid ice exposed by... May 30 2008, 03:13 AM um3k http://fawkes3.lpl.arizona.edu/images.php?gID=0... May 30 2008, 03:13 AM
JRehling QUOTE (Sunspot @ May 28 2008, 11:34 AM) L... May 28 2008, 09:08 PM stevelu QUOTE (JRehling @ May 28 2008, 01:08 PM) ... May 29 2008, 04:54 AM rlorenz QUOTE (stevelu @ May 29 2008, 12:54 AM) A... May 29 2008, 12:53 PM MahFL Still another day of arm unstow yet. May 29 2008, 01:03 PM stevelu QUOTE (rlorenz @ May 29 2008, 04:53 AM) G... May 29 2008, 05:38 PM kwan3217 Well, its getting to the point where they are sayi... May 28 2008, 06:35 PM volcanopele It is probably the "You mean, we have to repo... May 28 2008, 06:48 PM elakdawalla Actually, a lot of the press from JPL were headed ... May 28 2008, 07:24 PM ElkGroveDan It looks as though you and Doug have discovered a ... May 28 2008, 07:57 PM imipak Doug discovered it first... I suppose that makes i... May 28 2008, 08:48 PM kungpostyle QUOTE (ElkGroveDan @ May 28 2008, 02:57 P... May 28 2008, 08:19 PM Juramike I'm just curious, and horribly addicted: Whic... May 28 2008, 09:21 PM um3k University of Arizona seems to post the images as ... May 28 2008, 09:37 PM volcanopele Emily, the workspace mosaic you said you couldn... May 28 2008, 09:37 PM elakdawalla Thanks. I was looking at the NASA site for images... May 28 2008, 10:04 PM volcanopele I just used the Phoenix website's gallery page... May 28 2008, 10:27 PM mars loon At today's press conference, both the lack of ... May 29 2008, 12:49 AM stellarlight Hi!
Have you seen this news?
http://www.esa.i... May 29 2008, 12:51 AM centsworth_II QUOTE (stellarlight @ May 28 2008, 08:51 ... May 29 2008, 05:24 AM elakdawalla If you want to post a few here, go ahead and I... May 29 2008, 01:20 AM Gladstoner Question 1: "Do you have a workaround for the... May 29 2008, 01:36 AM nprev Okay, thanks! Here's a few; pick any you w... May 29 2008, 02:26 AM Steve G Any idea if they intend - or are able - to use the... May 29 2008, 02:35 AM nprev I think MARDI is still very much an open issue, bu... May 29 2008, 02:45 AM mcaplinger QUOTE (nprev @ May 28 2008, 06:45 PM) It ... May 29 2008, 03:54 AM Zeehond QUOTE (mcaplinger @ May 29 2008, 05:54 AM... May 29 2008, 04:06 AM Reed QUOTE (Zeehond @ May 28 2008, 09:06 PM) T... May 29 2008, 04:18 AM Zeehond QUOTE (Reed @ May 29 2008, 06:18 AM) This... May 29 2008, 04:21 AM Aussie I like nprev's question on any preliminary gu... May 29 2008, 03:07 AM helvick Some more questions for Emily (or anyone who can a... May 29 2008, 07:25 AM Zeehond New pictures are coming in now. The arm has moved. May 29 2008, 03:28 AM hal_9000 Anyone plan record the press conference? May 29 2008, 03:47 AM Zeehond QUOTE (hal_9000 @ May 29 2008, 05:47 AM) ... May 29 2008, 03:55 AM bgarlick and the non-fisheye panaorama...
http://phoenix.l... May 29 2008, 04:29 AM tim53 QUOTE (bgarlick @ May 28 2008, 08:29 PM) ... May 29 2008, 04:49 AM Joffan QUOTE (tim53 @ May 28 2008, 09:49 PM) Sad... May 29 2008, 06:19 AM Josh Cryer Quite enjoying the rawness of these new images... May 29 2008, 04:39 AM Zeehond QUOTE (Josh Cryer @ May 29 2008, 06:39 AM... May 29 2008, 04:44 AM Josh Cryer QUOTE (Zeehond @ May 28 2008, 09:44 PM) A... May 29 2008, 09:22 AM volcanopele QUOTE (Zeehond @ May 28 2008, 09:44 PM) A... May 29 2008, 05:33 AM Reed These birds eye views really bring out the polygon... May 29 2008, 06:01 AM CosmicRocker The polygons are gorgeous, and are probably the la... May 29 2008, 06:50 AM jamescanvin Nice new pics.
For those of you waiting for me to... May 29 2008, 07:36 AM Phil Stooke "Me, I'm a horizon kind of guy."
Ye... May 29 2008, 07:53 AM Juramike Coordinated view of my pseudocolor HiRISE image an... May 29 2008, 12:09 PM hal_9000 Moving... May 29 2008, 12:13 PM Pertinax Even more questions for Emily (or anyone who can a... May 29 2008, 01:36 PM Sunspot QUOTE (Pertinax @ May 29 2008, 02:36 PM) ... May 29 2008, 01:49 PM Pertinax QUOTE (Sunspot @ May 29 2008, 09:49 AM) I... May 29 2008, 02:29 PM Sunspot QUOTE (Pertinax @ May 29 2008, 03:29 PM) ... May 29 2008, 03:02 PM Pedro_Sondas The scoop:
and the RAC:
http://phoenix.lp... May 29 2008, 02:28 PM djellison It would be sort of cool to see the RAC with the ... May 29 2008, 02:30 PM ustrax I am happy...
On the 8th year of the 21st century ... May 29 2008, 02:35 PM Stu Oh dear god, we've created a monster! A MO... May 29 2008, 02:40 PM Sunspot ....and the rest of the article. May 29 2008, 03:04 PM hendric Q: Can Phoenix wake in the spring without its batt... May 29 2008, 03:13 PM djellison QUOTE (hendric @ May 29 2008, 04:13 PM) Q... May 29 2008, 03:40 PM Stu Here's a question for you Emily (or any Phoeni... May 29 2008, 03:50 PM jamescanvin As some of you may have noticed (thanks Algorimanc... May 29 2008, 04:34 PM Steve G Just completed watching the latest news conferance... May 29 2008, 06:32 PM djellison QUOTE (Steve G @ May 29 2008, 07:32 PM) y... May 29 2008, 06:48 PM Stu Starting to name rocks and features around the lan... May 29 2008, 06:34 PM Juramike QUOTE (Stu @ May 29 2008, 01:34 PM) Start... May 29 2008, 06:51 PM volcanopele A few thoughts from the press conference:
1) Emil... May 29 2008, 06:38 PM Steve G Too bad they didn't take the weight of the MAR... May 29 2008, 06:43 PM volcanopele From today's press release mosaic, a crop show... May 29 2008, 07:01 PM punkboi Go Phoenix! Waiting on the full-color panoram... May 29 2008, 07:03 PM Steve G Good shot (inverted up) to show scoop and deck. May 29 2008, 07:04 PM jamescanvin Well you've all already seen a version of this... May 29 2008, 08:11 PM algorimancer QUOTE (jamescanvin @ May 29 2008, 02:11 P... May 29 2008, 11:05 PM ahecht QUOTE (Steve G @ May 29 2008, 02:32 PM) J... May 29 2008, 08:16 PM djellison Phoenix - in TallovisioN - WAY more horizon relief... May 29 2008, 08:18 PM climber QUOTE (djellison @ May 29 2008, 10:18 PM)... May 29 2008, 08:35 PM Juramike QUOTE (djellison @ May 29 2008, 03:18 PM)... May 29 2008, 08:42 PM Nix QUOTE (djellison @ May 29 2008, 10:18 PM)... May 29 2008, 10:18 PM JRehling QUOTE (djellison @ May 28 2008, 11:27 AM)... May 29 2008, 08:30 PM djellison Open to suggestions on how to manage it especially... May 29 2008, 08:34 PM elakdawalla For those of you who only use inches as units for ... May 29 2008, 09:04 PM ugordan Ahhhh... The metric system. I heard about that one... May 29 2008, 09:07 PM climber QUOTE (elakdawalla @ May 29 2008, 11:04 P... May 29 2008, 09:10 PM Graham QUOTE (climber @ May 29 2008, 10:10 PM) T... May 29 2008, 09:39 PM ddeerrff QUOTE (climber @ May 29 2008, 04:10 PM) T... May 29 2008, 09:59 PM ElkGroveDan QUOTE (elakdawalla @ May 29 2008, 01:04 P... May 29 2008, 09:41 PM PFK That's instructive, but left me with a horribl... May 29 2008, 09:48 PM ElkGroveDan I was just going for familiarity. May 29 2008, 09:56 PM PFK QUOTE (ElkGroveDan @ May 29 2008, 10:56 P... May 29 2008, 10:10 PM Juramike Is there a site that has past Phoenix mission brie... May 29 2008, 09:58 PM ugordan QUOTE (Juramike @ May 29 2008, 11:58 PM) ... May 29 2008, 10:06 PM CAP-Team Here's a Dutch commercial for an insurance com... May 29 2008, 10:48 PM bgarlick Is there a way to know when each day's picture... May 29 2008, 11:29 PM Reed QUOTE (bgarlick @ May 29 2008, 03:29 PM) ... May 30 2008, 12:55 AM Fred Maybe I hadn't been following the mission clos... May 30 2008, 12:21 AM nilstycho Mars Descent Imager (MARDI) was on Phoenix, but it... May 30 2008, 12:29 AM bgarlick New images arriving.
Is this solid ice exposed by... May 30 2008, 03:13 AM um3k http://fawkes3.lpl.arizona.edu/images.php?gID=0... May 30 2008, 03:13 AM |

|
Lo-Fi Version | Time is now: 26th September 2024 - 02:34 PM |
|
RULES AND GUIDELINES Please read the Forum Rules and Guidelines before posting. IMAGE COPYRIGHT |
OPINIONS AND MODERATION Opinions expressed on UnmannedSpaceflight.com are those of the individual posters and do not necessarily reflect the opinions of UnmannedSpaceflight.com or The Planetary Society. The all-volunteer UnmannedSpaceflight.com moderation team is wholly independent of The Planetary Society. The Planetary Society has no influence over decisions made by the UnmannedSpaceflight.com moderators. |
SUPPORT THE FORUM Unmannedspaceflight.com is funded by the Planetary Society. Please consider supporting our work and many other projects by donating to the Society or becoming a member. |
|