LOLA PDS release #5 |

LOLA PDS release #5 |
 Feb 25 2011, 06:50 PM Feb 25 2011, 06:50 PM
Post
#1
|
|
|
Junior Member  Group: Members Posts: 22 Joined: 20-June 09 Member No.: 4830 |
Hi All,
Some LOLA products for the PDS release (#5), which will be officially out on March 15, 2011, are now available on the LOLA PDS node ! Label files and documentation are still being worked out, but I thought it'd be good to post (and some of you know we usually put those products online a bit early) The data released are from July 13, 2009 to January 31, 2011. There are EDRs/RDRs (individual profiles) for the courageous ones. But most of you will prefer the map products ( http://imbrium.mit.edu/DATA/LOLA_GDR/ ). In addition to IMG products (int16), there are JP2 files (GeoJPEG2000) which are compressed (lossless) and contain projection information. If you use a GIS programs, that should be helpful. The attached XML files contain the statistics already, which could save you 10+ minutes for the bigger grids upon loading. (Due to PDS filenaming conventions, you need to rename them to file.JP2.aux.xml for that to work properly; tested on ArcGIS). And keep in mind that in both those formats, the data were digitized at a 0.5m granularity, so you will need to divide the values by 2 to get the actual heights (in meters). Also of interest for visualization are the updated LOLA texture packages for Celestia. ZIP files here: http://imbrium.mit.edu/EXTRAS/CELESTIA/ and a few screenshots:       It'd be great also to know how this community is using the LOLA data, so please reply if you do: 1- Experimental Data Records (EDR) [raw telemetry] 2 - Reduced Data Records (RDR) [altimetric profiles] 3 - IMG Gridded Data Records (GDR) [maps] 4 - JP2 Gridded Data Records (GDR) [maps] 5 - Celestia Virtual Textures Enjoy !! Erwan EDIT 2011.02.25 08:30pm EST I realized there was a mistake in the level 0 normal map. (The files were the same as the topography texture...) The ZIP files have been updated. In case you downloaded the "old" version, you can download the two level 0 files here instead of re-downloading the ZIP. |
 |
 
|
 |
|
Mar 8 2011, 04:40 PM
Post
#2
|
||
|
Senior Member Group: Members Posts: 1075 Joined: 21-September 07 From: Québec, Canada Member No.: 3908 |
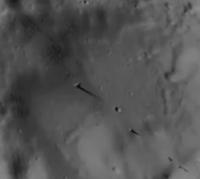
Great animation! Keep them coming.
Did you notice the pinnacle-like feature in the lower right corner at the beginning of the animation? (see image capture below) Is that real or a processing artifact?
|
|
|
|
|
|
|
Mar 8 2011, 04:57 PM
Post
#3
|
|
|
Junior Member Group: Members Posts: 37 Joined: 26-January 10 From: Reading, UK Member No.: 5192 |
Its almost certainly bad data. I automatically filter some of the bad data out but it doesn't catch everything.
|
|
|
|
|
Mar 10 2011, 05:03 AM
Post
#4
|
|
|
Newbie Group: Members Posts: 17 Joined: 30-January 11 Member No.: 5787 |
UNNECESSARY QUOTING DELETED
How are you creating the 3D flybys? JR |
|
|
|
|
Mar 10 2011, 07:54 PM
Post
#5
|
|
|
Junior Member Group: Members Posts: 37 Joined: 26-January 10 From: Reading, UK Member No.: 5192 |
UNNECESSARY QUOTING DELETED
I 'm using the same rendering software I wrote for visualising the Mars HiRISE data. |
|
|
|
|
Mar 10 2011, 11:39 PM
Post
#6
|
|
|
Newbie Group: Members Posts: 17 Joined: 30-January 11 Member No.: 5787 |
UNNECESSARY QUOTING DELETED
I've been looking for a 3D map of the lunar north pole, specifically, a 30km radius centered at 89.55N 30W. I've downloaded the LOLA files and viewed them with LTVT, but that's as far as I've gotten with it. Is your software an adaptation of something that's available online, or is it a custom program? JR |
|
|
|
|
Mar 11 2011, 09:58 PM
Post
#7
|
|
|
Junior Member Group: Members Posts: 37 Joined: 26-January 10 From: Reading, UK Member No.: 5192 |
QUOTE (joertexas @ Mar 10 2011, 11:39 PM)  I've been looking for a 3D map of the lunar north pole, specifically, a 30km radius centered at 89.55N 30W. I've downloaded the LOLA files and viewed them with LTVT, but that's as far as I've gotten with it. Is your software an adaptation of something that's available online, or is it a custom program? JR It's a custom program. Here's a map of the area you mentioned. Here's another map of the north pole showing a larger area (with exagerated lighting) |
|
|
|
|
Mar 11 2011, 11:08 PM
Post
#8
|
|
|
Newbie Group: Members Posts: 17 Joined: 30-January 11 Member No.: 5787 |
|
|
|
|
|
Mar 11 2011, 11:40 PM
Post
#9
|
|
|
Junior Member Group: Members Posts: 37 Joined: 26-January 10 From: Reading, UK Member No.: 5192 |
UNNECESSARY QUOTING DELETED
JOE & 3D *** YOU DON"T NEED TO QUOTE THE COMMENT IMMEDIATELY PRECEDING YOURS **** Thanks, I should point out that for the second image the terrain was scaled vertically by a factor of two. |
|
|
|
|
Mar 12 2011, 10:45 PM
Post
#10
|
|
|
Newbie Group: Members Posts: 17 Joined: 30-January 11 Member No.: 5787 |
I thought that second image looked a little lumpy compared to the other one. Now I know why
 Again, great pics. If you decide to produce any low angle 3D images, that'd be wonderful, too  JR |
|
|
|
|
Mar 14 2011, 04:51 PM
Post
#11
|
||
|
Newbie Group: Members Posts: 8 Joined: 19-November 09 Member No.: 5052 |
JR,
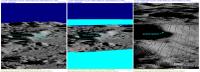
You indicated earlier that you had already studied the LOLA DEM data with the Lunar Terminator Visualization Tool, so this is probably redundant with views you have already seen, but I am attaching some screenshots anyway. You can reproduce any of them using the input data recorded at the top and bottom of each. Your point of interest seems to be centered on the rim of Hinshelwood. These are perspective views looking north along the 30°W meridian from an Earth-like distance (since that is what LTVT is hardwired to do), and with the sun angle artificially elevated to one higher than is ever actually achieved (by setting the solar latitude to 5°N). The first view (on the left) was constructed at 240 m resolution with LOLA LDEM_75N_240M.IMG, and indicates what is apparently your 30 km diameter region of interest. The second view was made using the latest 20 m DEM (LDEM_875N_20M.IMG), but with a 100 m step size. Note that what looks like the lunar limb at top is actually not the limb, but rather the edge of the data set. The final view zooms in 5X to the full 20m resolution, but exhibits numerous rows of artifacts where I assume the data was interpolated between ground paths. With a little patience you should be able to manipulate the sub-observer and sub-solar points to generate views from different directions or with different lighting. It is also possible to use the scripting capability to generate a sequence of views which can be assembled into an animation or fly-over (either in lighting or position, or both). Hope this helps. Jim
Attached thumbnail(s)
|
|
|
|
|
|
|
Mar 15 2011, 12:13 AM
Post
#12
|
|
|
Newbie Group: Members Posts: 17 Joined: 30-January 11 Member No.: 5787 |
QUOTE (Jim Mosher @ Mar 14 2011, 11:51 AM) With a little patience you should be able to manipulate the sub-observer and sub-solar points to generate views from different directions or with different lighting. It is also possible to use the scripting capability to generate a sequence of views which can be assembled into an animation or fly-over (either in lighting or position, or both). Hope this helps. I had no idea LTVT could display the DEM images. Thanks so much for pointing this out to me JR |
|
|
|
 zeBeamer LOLA PDS release #5 Feb 25 2011, 06:50 PM
 Phil Stooke Very nice! At the bottom of the Celestia page... Feb 25 2011, 07:19 PM
 djellison QUOTE (Phil Stooke @ Feb 25 2011, 11:19 A... Feb 25 2011, 07:24 PM zeBeamer QUOTE (Phil Stooke @ Feb 25 2011, 03:19 P... Feb 25 2011, 08:37 PM Phil Stooke Many thanks for those!
Phil Feb 25 2011, 09:50 PM JohnVV i am checking them for addition to the celestia mo... Mar 1 2011, 06:40 AM mhoward QUOTE (zeBeamer @ Feb 25 2011, 12:50 PM) ... Mar 1 2011, 03:13 PM Mars3D Thank you for releasing this early Erwan.
I am us... Mar 8 2011, 10:46 AM JohnVV any dem viewer will work
the lola file is in 16bi... Mar 11 2011, 02:10 AM joertexas I've tried many of the standalone programs, bu... Mar 11 2011, 02:37 AM JohnVV joertexas
seeing as these IMG files ( the lola im... Mar 11 2011, 10:09 PM joertexas UNNECESSARY QUOTING DELETED
I can't get img2p... Mar 11 2011, 11:05 PM Bjorn Jonsson QUOTE (zeBeamer @ Feb 25 2011, 06:50 PM) ... Mar 14 2011, 08:04 PM ValterVB QUOTE It'd be great also to know how this comm... Mar 28 2011, 08:22 PM
djellison QUOTE (Phil Stooke @ Feb 25 2011, 11:19 A... Feb 25 2011, 07:24 PM zeBeamer QUOTE (Phil Stooke @ Feb 25 2011, 03:19 P... Feb 25 2011, 08:37 PM Phil Stooke Many thanks for those!
Phil Feb 25 2011, 09:50 PM JohnVV i am checking them for addition to the celestia mo... Mar 1 2011, 06:40 AM mhoward QUOTE (zeBeamer @ Feb 25 2011, 12:50 PM) ... Mar 1 2011, 03:13 PM Mars3D Thank you for releasing this early Erwan.
I am us... Mar 8 2011, 10:46 AM JohnVV any dem viewer will work
the lola file is in 16bi... Mar 11 2011, 02:10 AM joertexas I've tried many of the standalone programs, bu... Mar 11 2011, 02:37 AM JohnVV joertexas
seeing as these IMG files ( the lola im... Mar 11 2011, 10:09 PM joertexas UNNECESSARY QUOTING DELETED
I can't get img2p... Mar 11 2011, 11:05 PM Bjorn Jonsson QUOTE (zeBeamer @ Feb 25 2011, 06:50 PM) ... Mar 14 2011, 08:04 PM ValterVB QUOTE It'd be great also to know how this comm... Mar 28 2011, 08:22 PM |

|
Lo-Fi Version | Time is now: 20th September 2024 - 06:50 PM |
|
RULES AND GUIDELINES Please read the Forum Rules and Guidelines before posting. IMAGE COPYRIGHT |
OPINIONS AND MODERATION Opinions expressed on UnmannedSpaceflight.com are those of the individual posters and do not necessarily reflect the opinions of UnmannedSpaceflight.com or The Planetary Society. The all-volunteer UnmannedSpaceflight.com moderation team is wholly independent of The Planetary Society. The Planetary Society has no influence over decisions made by the UnmannedSpaceflight.com moderators. |
SUPPORT THE FORUM Unmannedspaceflight.com is funded by the Planetary Society. Please consider supporting our work and many other projects by donating to the Society or becoming a member. |
|