Temperature and pressure at Gale, Suitable (for short periods) for liquid water? |

Temperature and pressure at Gale, Suitable (for short periods) for liquid water? |
 Sep 30 2012, 03:23 PM Sep 30 2012, 03:23 PM
Post
#1
|
|
|
Junior Member  Group: Members Posts: 62 Joined: 11-July 11 Member No.: 6058 |
Just a quick query from someone with no background in science. Obviously, MSL has AFAIK not returned evidence of recent (i.e. years/decades) liquid water in its vicinity; however, I was interested by the following graphs:
08.21.2012: First Pressure Readings on Mars http://mars.jpl.nasa.gov/msl/multimedia/images/?ImageID=4501 08.21.2012: Taking Mars' Temperature http://mars.jpl.nasa.gov/msl/multimedia/images/?ImageID=4502 The first indicates that the pressure between 15 Aug and 18 Aug never dropped below c. 690 millibars; the second shows that, for a period of a couple of hours on 16 Aug, the temperature rose above freezing. If water had been present on the surface, then, would it have been liquid during this brief period? The pressure and temperature seemed to satisfy the conditions for liquid water as I understand them (indeed, the pressure seems to be high enough (just) on a 24-hour basis to allow for the presence of liquid water). Thanks in advance for your opinions (corroborative or not!) on this. |
 |
 
|
 |
|
Mar 7 2013, 02:14 AM
Post
#2
|
||
 Senior Member Group: Members Posts: 1465 Joined: 9-February 04 From: Columbus OH USA Member No.: 13 |
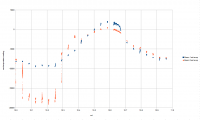
Took a look at an air temperature curve from the uncalibrated REMS data.
Sol 10 data file (comma-separated): http://atmos.nmsu.edu/PDS/data/mslrem_0001...00ACQ____M1.TAB Column descriptions: http://atmos.nmsu.edu/PDS/data/mslrem_0001/LABEL/ACQ.FMT Extracting the columns for the two boom air temperature sensors B1_AIR_Temp and B2_AIR_Temp yields this plot for sol 10:
I picked sol 10 because it can be compared with a calibrated air temperature plot released during one of the telecons: http://www.nasa.gov/mission_pages/msl/mult...a/pia16081.html Not sure what's going on with Boom 2, but comparing the Boom 1 curve with the calibrated curve shows a good match shape-wise up to sol 10.6. At that point it looks like for some reason they drew a straight line to the start of sol 11. Anyway, since the minimum of the calibrated curve is about -90°C and the maximum about 3°C, and the min/max of the uncalibrated curve is -9512/2028, a rough formula to convert the Boom 1 uncalibrated values to °C is: T = 0.00806*n - 13.3 -------------------- |
|
|
|
|
|
|
Mar 7 2013, 07:20 AM
Post
#3
|
|
 Senior Member Group: Members Posts: 2431 Joined: 30-January 13 From: Penang, Malaysia. Member No.: 6853 |
QUOTE (jmknapp @ Mar 7 2013, 10:14 AM)  Took a look at an air temperature curve from the uncalibrated REMS data... Many thanks for pointing me in the right direction Joe. Hopefully the anomalies on the temperature values from the other boom are not an indication of more issues with the REMS instrument package. Hopefully we won't have to wait too long for the calibrated data to be issued. |
|
|
|
 Seryddwr Temperature and pressure at Gale Sep 30 2012, 03:23 PM
 ngunn 690 Pa = 6.9 mbar Sep 30 2012, 03:33 PM Seryddwr 6.9 - quite! 690 millibars would have been qu... Sep 30 2012, 03:40 PM nprev I doubt that the pressure on the surface ever exce... Sep 30 2012, 03:51 PM
 Eyesonmars QUOTE (nprev @ Sep 30 2012, 03:51 PM) I d... Sep 30 2012, 04:50 PM Eyesonmars QUOTE (Seryddwr @ Sep 30 2012, 03:23 PM) ... Sep 30 2012, 04:03 PM djellison QUOTE (Eyesonmars @ Sep 30 2012, 09:03 AM... Sep 30 2012, 04:31 PM Eyesonmars QUOTE (djellison @ Sep 30 2012, 04:31 PM)... Sep 30 2012, 08:04 PM djellison It would boil, would it not? Sep 30 2012, 09:47 PM Eyesonmars QUOTE (djellison @ Sep 30 2012, 09:47 PM)... Sep 30 2012, 11:37 PM udolein QUOTE (Eyesonmars @ Oct 1 2012, 01:37 AM)... Sep 30 2012, 11:44 PM Eyesonmars QUOTE (udolein @ Oct 1 2012, 12:44 AM) Th... Oct 1 2012, 12:33 AM Juramike QUOTE (Eyesonmars @ Sep 30 2012, 07:33 PM... Oct 1 2012, 02:01 PM Eyesonmars QUOTE (Juramike @ Oct 1 2012, 02:01 PM) O... Oct 1 2012, 05:20 PM Juramike QUOTE (Eyesonmars @ Oct 1 2012, 12:20 PM)... Oct 1 2012, 06:53 PM Eyesonmars QUOTE (Juramike @ Oct 1 2012, 06:53 PM) (... Oct 1 2012, 07:27 PM udolein Liquid water is almost impossible under the curren... Sep 30 2012, 11:06 PM udolein BTW: This site has the current weather readings: m... Sep 30 2012, 11:19 PM Eyesonmars QUOTE (udolein @ Sep 30 2012, 11:19 PM) B... Oct 1 2012, 12:14 AM djellison Quite- we''re dancing around a tiny tiny w... Sep 30 2012, 11:25 PM Eyesonmars QUOTE (djellison @ Sep 30 2012, 11:25 PM)... Oct 1 2012, 01:36 AM djellison QUOTE (Eyesonmars @ Sep 30 2012, 05:36 PM... Oct 1 2012, 04:13 AM Eyesonmars QUOTE (djellison @ Oct 1 2012, 04:13 AM) ... Oct 1 2012, 05:46 PM ElkGroveDan QUOTE (Eyesonmars @ Sep 30 2012, 06:36 PM... Oct 1 2012, 02:13 PM serpens Yep to djellison. And addressing reality rather t... Sep 30 2012, 11:40 PM udolein CO2 won't be a liquid at normal conditions due... Sep 30 2012, 11:59 PM nprev Um. Let's put it this way, Eyes: We ain't ... Oct 1 2012, 02:41 AM Eyesonmars Hey guys come on
Before you all pile on Please rea... Oct 1 2012, 05:07 PM marsophile I think one can make a case for transient wetting ... Oct 1 2012, 05:49 PM Juramike Hmmm. That's a good question, but off the top... Oct 1 2012, 07:39 PM Eyesonmars An interesting experiment I've had students do... Oct 1 2012, 08:00 PM Blue Sky It is interesting that in the NASA presentation of... Oct 3 2012, 01:53 AM mshell I searched the web and couldn't find a phase d... Oct 1 2012, 09:04 PM vikingmars QUOTE (mshell @ Oct 1 2012, 11:04 PM) I u... Oct 2 2012, 07:59 AM serpens QUOTE (vikingmars @ Oct 2 2012, 08:59 AM)... Oct 2 2012, 08:20 AM vikingmars QUOTE (serpens @ Oct 2 2012, 10:20 AM) ... Oct 2 2012, 09:31 AM serpens QUOTE (vikingmars @ Oct 2 2012, 10:31 AM)... Oct 2 2012, 04:31 PM Tom Dahl QUOTE (vikingmars @ Oct 2 2012, 05:31 AM)... Oct 2 2012, 04:50 PM Eyesonmars QUOTE (vikingmars @ Oct 2 2012, 08:59 AM)... Oct 2 2012, 06:09 PM vikingmars QUOTE (Eyesonmars @ Oct 2 2012, 08:09 PM)... Oct 3 2012, 08:15 AM djellison Beautiful work mshell - that you very much ( and G... Oct 1 2012, 09:09 PM nprev Indeed, I can only echo the Chairman of UMSF's... Oct 2 2012, 12:08 AM marsophile That is a fine statement of first-order behavior, ... Oct 2 2012, 06:23 AM Harder As mshell rightly mentions, the phase diagram is f... Oct 2 2012, 07:31 AM marsophile QUOTE (Harder @ Oct 1 2012, 11:31 PM) ...... Oct 2 2012, 03:10 PM abalone What would also be interesting is the depth below ... Oct 2 2012, 07:46 AM Explorer1 On a related note, did anything ever come of the ... Oct 2 2012, 08:10 AM abalone An interesting paper
http://online.liebertpub.com/... Oct 3 2012, 03:17 AM mshell This is an update of my up-thread post here where ... Oct 5 2012, 07:44 PM Explorer1 Very impressive work Mark!
So the pressure wil... Oct 5 2012, 09:10 PM mshell In a private message to me, Eyesonmars indicated t... Oct 11 2012, 04:43 AM Explorer1 There's also the fact that the Martian axis is... Oct 11 2012, 06:38 AM Eyesonmars Calculations suggest that the obliquity of Mars va... Oct 11 2012, 06:05 PM Gsnorgathon QUOTE (Eyesonmars @ Oct 11 2012, 10:05 AM... Oct 11 2012, 07:14 PM mcaplinger QUOTE (Gsnorgathon @ Oct 11 2012, 12:14 P... Oct 11 2012, 08:23 PM Eyesonmars Of course, I do have it backward. Atmospheric mas... Oct 11 2012, 08:45 PM Eyesonmars QUOTE Although the albedo effect resulted in thick... Oct 11 2012, 09:14 PM serpens I've never been able to get my mind around the... Oct 11 2012, 10:06 PM climber I watched the jump record of Baumgartner a few min... Oct 14 2012, 06:26 PM MichaelT Dear all,
I am trying to find out if it is possib... Nov 1 2012, 09:46 AM marsophile QUOTE (MichaelT @ Nov 1 2012, 02:46 AM) D... Nov 1 2012, 03:37 PM MichaelT Thanks Marsophile!
That is exactly what I h... Nov 1 2012, 04:16 PM PaulH51 Has anyone been able to extract usable REMS data f... Mar 6 2013, 09:23 AM djellison No - as the PDS release clearly states, they are r... Mar 6 2013, 04:25 PM jmknapp The columns are listed in this file:
http://atmos... Mar 6 2013, 08:05 PM fredk Mods - shouldn't these last few posts go in th... Mar 6 2013, 08:57 PM djellison QUOTE (PaulH51 @ Mar 6 2013, 11:20 PM) Ho... Mar 7 2013, 12:23 PM jmknapp March 20th would put it during their upcoming conf... Mar 7 2013, 12:56 PM PaulH51 Thanks Joe, I envy your skills in extracting the d... Mar 7 2013, 01:37 PM djellison The REMS instrument isn't a NASA/JPL instrumen... Mar 7 2013, 03:28 PM PaulH51 QUOTE (djellison @ Mar 7 2013, 11:28 PM) ... Mar 7 2013, 11:44 PM jmknapp It'll be interesting to compare to the calibra... Mar 7 2013, 09:01 PM Gerald QUOTE (jmknapp @ Mar 7 2013, 10:01 PM) ..... Mar 8 2013, 12:57 PM SpaceListener QUOTE (jmknapp @ Mar 7 2013, 04:01 PM) It... Mar 8 2013, 03:25 PM CosmicRocker QUOTE (jmknapp @ Mar 7 2013, 06:56 AM) ..... Mar 8 2013, 08:33 AM jmknapp Gerald, it may be correlated because the ASIC chip... Mar 8 2013, 06:27 PM Gerald You are right: It's hard to tell, in which way... Mar 8 2013, 07:30 PM jmknapp Here's a quick-and-dirty chart of the temperat... Mar 12 2013, 10:21 AM jmknapp A couple of plots generated from the REMS data fee... Aug 14 2013, 10:46 AM vikingmars QUOTE (jmknapp @ Aug 14 2013, 12:46 PM) T... Aug 15 2013, 09:46 AM PaulH51 QUOTE (jmknapp @ Aug 14 2013, 06:46 PM) D... Aug 15 2013, 10:02 AM jmknapp Paul-- Good idea--I was trying to see how I could ... Aug 15 2013, 12:16 PM jmknapp OK, here are the plots with selectable units:
Tem... Aug 15 2013, 03:57 PM centsworth_II QUOTE (jmknapp @ Aug 15 2013, 10:57 AM) O... Aug 15 2013, 09:23 PM jmknapp I put in a dotted line to mark the H2O freezing po... Aug 16 2013, 07:02 PM Explorer1 Looks like the colors at around sol 73 or so are s... Aug 16 2013, 08:16 PM jmknapp QUOTE (Explorer1 @ Aug 16 2013, 04:16 PM)... Aug 16 2013, 08:30 PM Deimos QUOTE (jmknapp @ Aug 16 2013, 08:30 PM) T... Aug 16 2013, 10:13 PM Harder The dotted line at 32 F is too pessimistic when yo... Aug 16 2013, 09:17 PM jmknapp QUOTE (Harder @ Aug 16 2013, 05:17 PM) An... Aug 16 2013, 11:54 PM Harder The term "explode" came to my mind from ... Aug 17 2013, 04:11 PM jmknapp QUOTE (Harder @ Aug 17 2013, 12:11 PM) I ... Aug 17 2013, 05:55 PM djellison QUOTE (jmknapp @ Aug 16 2013, 04:54 PM) t... Aug 17 2013, 04:45 PM Explorer1 The lowest regions of the planet do have higher pr... Aug 17 2013, 04:46 PM djellison QUOTE (Explorer1 @ Aug 17 2013, 08:46 AM)... Aug 17 2013, 04:55 PM Explorer1 That's the point I was making as well; unlike ... Aug 17 2013, 06:23 PM Harder I stand corrected.. Where I went too fast was in a... Aug 17 2013, 08:28 PM Explorer1 I do wonder if the Exomars rover's drill would... Aug 17 2013, 10:16 PM
Eyesonmars QUOTE (nprev @ Sep 30 2012, 03:51 PM) I d... Sep 30 2012, 04:50 PM Eyesonmars QUOTE (Seryddwr @ Sep 30 2012, 03:23 PM) ... Sep 30 2012, 04:03 PM djellison QUOTE (Eyesonmars @ Sep 30 2012, 09:03 AM... Sep 30 2012, 04:31 PM Eyesonmars QUOTE (djellison @ Sep 30 2012, 04:31 PM)... Sep 30 2012, 08:04 PM djellison It would boil, would it not? Sep 30 2012, 09:47 PM Eyesonmars QUOTE (djellison @ Sep 30 2012, 09:47 PM)... Sep 30 2012, 11:37 PM udolein QUOTE (Eyesonmars @ Oct 1 2012, 01:37 AM)... Sep 30 2012, 11:44 PM Eyesonmars QUOTE (udolein @ Oct 1 2012, 12:44 AM) Th... Oct 1 2012, 12:33 AM Juramike QUOTE (Eyesonmars @ Sep 30 2012, 07:33 PM... Oct 1 2012, 02:01 PM Eyesonmars QUOTE (Juramike @ Oct 1 2012, 02:01 PM) O... Oct 1 2012, 05:20 PM Juramike QUOTE (Eyesonmars @ Oct 1 2012, 12:20 PM)... Oct 1 2012, 06:53 PM Eyesonmars QUOTE (Juramike @ Oct 1 2012, 06:53 PM) (... Oct 1 2012, 07:27 PM udolein Liquid water is almost impossible under the curren... Sep 30 2012, 11:06 PM udolein BTW: This site has the current weather readings: m... Sep 30 2012, 11:19 PM Eyesonmars QUOTE (udolein @ Sep 30 2012, 11:19 PM) B... Oct 1 2012, 12:14 AM djellison Quite- we''re dancing around a tiny tiny w... Sep 30 2012, 11:25 PM Eyesonmars QUOTE (djellison @ Sep 30 2012, 11:25 PM)... Oct 1 2012, 01:36 AM djellison QUOTE (Eyesonmars @ Sep 30 2012, 05:36 PM... Oct 1 2012, 04:13 AM Eyesonmars QUOTE (djellison @ Oct 1 2012, 04:13 AM) ... Oct 1 2012, 05:46 PM ElkGroveDan QUOTE (Eyesonmars @ Sep 30 2012, 06:36 PM... Oct 1 2012, 02:13 PM serpens Yep to djellison. And addressing reality rather t... Sep 30 2012, 11:40 PM udolein CO2 won't be a liquid at normal conditions due... Sep 30 2012, 11:59 PM nprev Um. Let's put it this way, Eyes: We ain't ... Oct 1 2012, 02:41 AM Eyesonmars Hey guys come on
Before you all pile on Please rea... Oct 1 2012, 05:07 PM marsophile I think one can make a case for transient wetting ... Oct 1 2012, 05:49 PM Juramike Hmmm. That's a good question, but off the top... Oct 1 2012, 07:39 PM Eyesonmars An interesting experiment I've had students do... Oct 1 2012, 08:00 PM Blue Sky It is interesting that in the NASA presentation of... Oct 3 2012, 01:53 AM mshell I searched the web and couldn't find a phase d... Oct 1 2012, 09:04 PM vikingmars QUOTE (mshell @ Oct 1 2012, 11:04 PM) I u... Oct 2 2012, 07:59 AM serpens QUOTE (vikingmars @ Oct 2 2012, 08:59 AM)... Oct 2 2012, 08:20 AM vikingmars QUOTE (serpens @ Oct 2 2012, 10:20 AM) ... Oct 2 2012, 09:31 AM serpens QUOTE (vikingmars @ Oct 2 2012, 10:31 AM)... Oct 2 2012, 04:31 PM Tom Dahl QUOTE (vikingmars @ Oct 2 2012, 05:31 AM)... Oct 2 2012, 04:50 PM Eyesonmars QUOTE (vikingmars @ Oct 2 2012, 08:59 AM)... Oct 2 2012, 06:09 PM vikingmars QUOTE (Eyesonmars @ Oct 2 2012, 08:09 PM)... Oct 3 2012, 08:15 AM djellison Beautiful work mshell - that you very much ( and G... Oct 1 2012, 09:09 PM nprev Indeed, I can only echo the Chairman of UMSF's... Oct 2 2012, 12:08 AM marsophile That is a fine statement of first-order behavior, ... Oct 2 2012, 06:23 AM Harder As mshell rightly mentions, the phase diagram is f... Oct 2 2012, 07:31 AM marsophile QUOTE (Harder @ Oct 1 2012, 11:31 PM) ...... Oct 2 2012, 03:10 PM abalone What would also be interesting is the depth below ... Oct 2 2012, 07:46 AM Explorer1 On a related note, did anything ever come of the ... Oct 2 2012, 08:10 AM abalone An interesting paper
http://online.liebertpub.com/... Oct 3 2012, 03:17 AM mshell This is an update of my up-thread post here where ... Oct 5 2012, 07:44 PM Explorer1 Very impressive work Mark!
So the pressure wil... Oct 5 2012, 09:10 PM mshell In a private message to me, Eyesonmars indicated t... Oct 11 2012, 04:43 AM Explorer1 There's also the fact that the Martian axis is... Oct 11 2012, 06:38 AM Eyesonmars Calculations suggest that the obliquity of Mars va... Oct 11 2012, 06:05 PM Gsnorgathon QUOTE (Eyesonmars @ Oct 11 2012, 10:05 AM... Oct 11 2012, 07:14 PM mcaplinger QUOTE (Gsnorgathon @ Oct 11 2012, 12:14 P... Oct 11 2012, 08:23 PM Eyesonmars Of course, I do have it backward. Atmospheric mas... Oct 11 2012, 08:45 PM Eyesonmars QUOTE Although the albedo effect resulted in thick... Oct 11 2012, 09:14 PM serpens I've never been able to get my mind around the... Oct 11 2012, 10:06 PM climber I watched the jump record of Baumgartner a few min... Oct 14 2012, 06:26 PM MichaelT Dear all,
I am trying to find out if it is possib... Nov 1 2012, 09:46 AM marsophile QUOTE (MichaelT @ Nov 1 2012, 02:46 AM) D... Nov 1 2012, 03:37 PM MichaelT Thanks Marsophile!
That is exactly what I h... Nov 1 2012, 04:16 PM PaulH51 Has anyone been able to extract usable REMS data f... Mar 6 2013, 09:23 AM djellison No - as the PDS release clearly states, they are r... Mar 6 2013, 04:25 PM jmknapp The columns are listed in this file:
http://atmos... Mar 6 2013, 08:05 PM fredk Mods - shouldn't these last few posts go in th... Mar 6 2013, 08:57 PM djellison QUOTE (PaulH51 @ Mar 6 2013, 11:20 PM) Ho... Mar 7 2013, 12:23 PM jmknapp March 20th would put it during their upcoming conf... Mar 7 2013, 12:56 PM PaulH51 Thanks Joe, I envy your skills in extracting the d... Mar 7 2013, 01:37 PM djellison The REMS instrument isn't a NASA/JPL instrumen... Mar 7 2013, 03:28 PM PaulH51 QUOTE (djellison @ Mar 7 2013, 11:28 PM) ... Mar 7 2013, 11:44 PM jmknapp It'll be interesting to compare to the calibra... Mar 7 2013, 09:01 PM Gerald QUOTE (jmknapp @ Mar 7 2013, 10:01 PM) ..... Mar 8 2013, 12:57 PM SpaceListener QUOTE (jmknapp @ Mar 7 2013, 04:01 PM) It... Mar 8 2013, 03:25 PM CosmicRocker QUOTE (jmknapp @ Mar 7 2013, 06:56 AM) ..... Mar 8 2013, 08:33 AM jmknapp Gerald, it may be correlated because the ASIC chip... Mar 8 2013, 06:27 PM Gerald You are right: It's hard to tell, in which way... Mar 8 2013, 07:30 PM jmknapp Here's a quick-and-dirty chart of the temperat... Mar 12 2013, 10:21 AM jmknapp A couple of plots generated from the REMS data fee... Aug 14 2013, 10:46 AM vikingmars QUOTE (jmknapp @ Aug 14 2013, 12:46 PM) T... Aug 15 2013, 09:46 AM PaulH51 QUOTE (jmknapp @ Aug 14 2013, 06:46 PM) D... Aug 15 2013, 10:02 AM jmknapp Paul-- Good idea--I was trying to see how I could ... Aug 15 2013, 12:16 PM jmknapp OK, here are the plots with selectable units:
Tem... Aug 15 2013, 03:57 PM centsworth_II QUOTE (jmknapp @ Aug 15 2013, 10:57 AM) O... Aug 15 2013, 09:23 PM jmknapp I put in a dotted line to mark the H2O freezing po... Aug 16 2013, 07:02 PM Explorer1 Looks like the colors at around sol 73 or so are s... Aug 16 2013, 08:16 PM jmknapp QUOTE (Explorer1 @ Aug 16 2013, 04:16 PM)... Aug 16 2013, 08:30 PM Deimos QUOTE (jmknapp @ Aug 16 2013, 08:30 PM) T... Aug 16 2013, 10:13 PM Harder The dotted line at 32 F is too pessimistic when yo... Aug 16 2013, 09:17 PM jmknapp QUOTE (Harder @ Aug 16 2013, 05:17 PM) An... Aug 16 2013, 11:54 PM Harder The term "explode" came to my mind from ... Aug 17 2013, 04:11 PM jmknapp QUOTE (Harder @ Aug 17 2013, 12:11 PM) I ... Aug 17 2013, 05:55 PM djellison QUOTE (jmknapp @ Aug 16 2013, 04:54 PM) t... Aug 17 2013, 04:45 PM Explorer1 The lowest regions of the planet do have higher pr... Aug 17 2013, 04:46 PM djellison QUOTE (Explorer1 @ Aug 17 2013, 08:46 AM)... Aug 17 2013, 04:55 PM Explorer1 That's the point I was making as well; unlike ... Aug 17 2013, 06:23 PM Harder I stand corrected.. Where I went too fast was in a... Aug 17 2013, 08:28 PM Explorer1 I do wonder if the Exomars rover's drill would... Aug 17 2013, 10:16 PM |

|
Lo-Fi Version | Time is now: 26th September 2024 - 02:46 AM |
|
RULES AND GUIDELINES Please read the Forum Rules and Guidelines before posting. IMAGE COPYRIGHT |
OPINIONS AND MODERATION Opinions expressed on UnmannedSpaceflight.com are those of the individual posters and do not necessarily reflect the opinions of UnmannedSpaceflight.com or The Planetary Society. The all-volunteer UnmannedSpaceflight.com moderation team is wholly independent of The Planetary Society. The Planetary Society has no influence over decisions made by the UnmannedSpaceflight.com moderators. |
SUPPORT THE FORUM Unmannedspaceflight.com is funded by the Planetary Society. Please consider supporting our work and many other projects by donating to the Society or becoming a member. |
|