Pluto Atmospheric Observations: NH Post-Encounter Phase, 1 Aug 2015- TBD |

Pluto Atmospheric Observations: NH Post-Encounter Phase, 1 Aug 2015- TBD |
 Jul 31 2015, 02:57 PM Jul 31 2015, 02:57 PM
Post
#1
|
|
 Senior Member  Group: Members Posts: 1669 Joined: 5-March 05 From: Boulder, CO Member No.: 184 |
QUOTE (remcook @ Jul 28 2015, 02:55 PM)  A neat paper by Jonathan Fortney shows this ratio to scale (approximately) with sqrt(Rp/H), with Rp being the planet radius and H the scale height. Both indeed decrease this effect for Pluto. If we assume the scale height of Pluto's atmosphere is 60km and the aerosols have the same height as the gas, then I was able to get a few numbers in the course of comparing various airmass equations. Earth would be about 39 airmasses in the horizontal and Pluto would be 6.4. These numbers would be doubled when looking at grazing incidence from space as in the NH images. I'd still like to come up with a formula for an isothermal atmosphere (exponential density decrease with height) by integrating the thin shell relationship over height and to compare this with the other formulations in Wikipedia. On the other hand, the isothermal case is within just a few percent of the homogeneous (constant density with height) case. To check the scale height and see why it is much higher than Earth, we might evaluate this expression for Earth and Pluto: H = kT/mg H is scale height T is temperature (a representative value since this varies with height) k is Boltzmann's constant m is molecular mass g is gravitational acceleration The Wikipedia link above shows this worked example for Earth: Taking T = 288.15 K, k = 1.3806488x10⁻¹³ J/K, m = 28.9644×1.6605×10−27 kg, and g = 9.80665 m/s2 yields H = 8345m Roughly speaking, if pluto has .07 Earth's gravity and the same T and similar m we'd get about 120km scale height. If the scale height is 60km, then the temperature would still end up being ~140K. So we can check how much the temperature increases with height over the surface value of 44K. There are other atmosphere posts in the Near Encounter thread as well (e.g. posts #1238 and #1252). -------------------- Steve [ my home page and planetary maps page ]
|
 |
 
|
 |
|
Aug 13 2015, 08:35 PM
Post
#2
|
|||||
 Member Group: Members Posts: 244 Joined: 2-March 15 Member No.: 7408 |
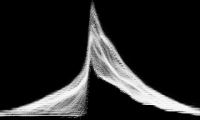
I took the code I wrote to get the value vs radius combined plots of the 2 full-disk backlit LORRI shots and applied it to the 3 partial-disk backlit LORRI shots (lor_029920671, lor_0299206715, lor_0299206716). These are much closer but also much lower quality.
Data from 550,016 pixels across the three images are plotted here. This covers 8.6 times the number of pixels from the other one I posted, and at a much better spatial resolution, so the plot is much richer.
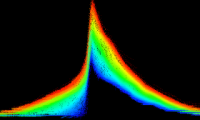
The horizontal axis is the pixel's distance from Pluto's center (left edge is 600 pixels; right edge is 740 pixels). The vertical axis is the pixel's sample value (bottom edge is 88; top edge is (just below) 256). The sample values of the first two LORRI shots were scaled to match the brightness scaling of lor_0299206716. All apparent large-scale contours/concentrations apparent here were also apparent in each frame's data individually; they were very consistent. Artefacts near the bottom are from value-stepping in the original low-quality JPEG data. Here's the same data plotted the same way, but with each point rendered with a hue based on the pixel's angle from the center of Pluto.
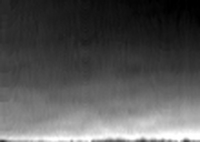
I had to write a different program to make this, and didn't bother with subpixel rendering. Instead, each pixel's data was written into a 560x256 array of lists (2-D binned, in other words) and each list of data was averaged to yield the pixel value. It was then scaled to 280x256 and cropped. While I was at it, I took some of my new code and rewrote a much better atmosphere unwrapper that's binned and processes each pixel in the images exactly once and so isn't susceptible to a lot of the artefacts that turn up with resampling. I also applied an array column-averaged correction to the sample values of the radius vs angle data before rendering to compensate for the uneven lighting around the disk.
The bottom edge is the surface of the planet; the top edge is 78 pixels above the surface. The left edge is an angle of 178 degrees; the right edge is an angle of 288 degrees (I might have that backwards...and you might need to subtract them from 360...) The above version has been contrast-enhanced. The original output is below.
|
||||
|
|
|
||||
 scalbers Pluto Atmospheric Observations: NH Post-Encounter Phase Jul 31 2015, 02:57 PM
 nprev This topic is for discussion of data concerning Pl... Aug 1 2015, 06:13 PM Bill Harris As noted earlier:
QUOTE (Bill Harris @ Aug 3... Aug 5 2015, 05:20 PM lollipop I meant to say that Earle and Binzel had sorted ou... Aug 5 2015, 06:45 PM Bill Harris Even though the NH encounter increased our knowled... Aug 5 2015, 09:40 PM Herobrine I've previously "unwrapped" the atmo... Aug 6 2015, 08:31 PM Gennady Ionov To be seen the glow of the atmosphere due to Rayle... Aug 11 2015, 04:08 PM fredk Are you saying that, for the geometry of that imag... Aug 11 2015, 04:39 PM
nprev This topic is for discussion of data concerning Pl... Aug 1 2015, 06:13 PM Bill Harris As noted earlier:
QUOTE (Bill Harris @ Aug 3... Aug 5 2015, 05:20 PM lollipop I meant to say that Earle and Binzel had sorted ou... Aug 5 2015, 06:45 PM Bill Harris Even though the NH encounter increased our knowled... Aug 5 2015, 09:40 PM Herobrine I've previously "unwrapped" the atmo... Aug 6 2015, 08:31 PM Gennady Ionov To be seen the glow of the atmosphere due to Rayle... Aug 11 2015, 04:08 PM fredk Are you saying that, for the geometry of that imag... Aug 11 2015, 04:39 PM Gennady Ionov QUOTE (fredk @ Aug 11 2015, 09:39 PM) Are... Aug 11 2015, 04:46 PM
 HSchirmer QUOTE (fredk @ Aug 11 2015, 04:39 PM) ...... Aug 12 2015, 04:04 PM Gennady Ionov QUOTE (HSchirmer @ Aug 12 2015, 09:04 PM)... Aug 12 2015, 04:26 PM HSchirmer QUOTE (Gennady Ionov @ Aug 12 2015, 04:26... Sep 24 2015, 12:58 PM Gennady Ionov QUOTE (HSchirmer @ Sep 24 2015, 05:58 PM)... Oct 2 2015, 06:17 PM fredk Sure, Pluto's albedo depends on position, but ... Aug 11 2015, 05:36 PM Gennady Ionov QUOTE (fredk @ Aug 11 2015, 10:36 PM) Sur... Aug 11 2015, 06:12 PM fredk QUOTE (Gennady Ionov @ Aug 11 2015, 07:12... Aug 11 2015, 07:31 PM Gennady Ionov QUOTE (fredk @ Aug 12 2015, 12:31 AM) But... Aug 11 2015, 08:22 PM Bjorn Jonsson QUOTE (fredk @ Aug 11 2015, 07:31 PM) Tha... Aug 11 2015, 08:34 PM Gennady Ionov QUOTE (Bjorn Jonsson @ Aug 12 2015, 01:34... Aug 12 2015, 07:43 AM Gennady Ionov QUOTE (fredk @ Aug 12 2015, 12:31 AM) Tha... Aug 12 2015, 07:45 AM Sherbert The general conclusion seems to be that Pluto... Aug 11 2015, 09:08 PM Herobrine QUOTE (Sherbert @ Aug 11 2015, 05:08 PM) ... Aug 11 2015, 10:21 PM JRehling Meteors may appear over Earth at altitudes where t... Aug 12 2015, 06:40 PM Sherbert QUOTE (JRehling @ Aug 12 2015, 07:40 PM) ... Aug 13 2015, 02:07 PM Gennady Ionov QUOTE (Sherbert @ Aug 13 2015, 07:07 PM) ... Aug 13 2015, 03:30 PM fredk About the visibility of aerosols/haze in the pre-e... Aug 11 2015, 09:52 PM Bjorn Jonsson I have been attempting to model Pluto's atmosp... Aug 11 2015, 10:16 PM ngunn QUOTE (Bjorn Jonsson @ Aug 11 2015, 11:16... Aug 11 2015, 10:32 PM scalbers QUOTE (Bjorn Jonsson @ Aug 11 2015, 10:16... Aug 11 2015, 11:00 PM fredk QUOTE (Bjorn Jonsson @ Aug 11 2015, 11:16... Aug 12 2015, 12:25 AM Gennady Ionov QUOTE (Bjorn Jonsson @ Aug 12 2015, 03:16... Aug 12 2015, 08:02 AM remcook Bjorn, Scalbers: why not blue? It will be blue-ish... Aug 12 2015, 10:51 AM Gennady Ionov QUOTE (remcook @ Aug 12 2015, 03:51 PM) B... Aug 12 2015, 11:51 AM remcook Thanks! So, the colour from your colour simula... Aug 12 2015, 02:59 PM scalbers Good discussion of the additional factors about th... Aug 12 2015, 04:14 PM remcook About the phase functions, here ( http://inspirehe... Aug 12 2015, 06:05 PM scalbers Offhand, the phase function peak is more typically... Aug 12 2015, 06:11 PM fredk QUOTE (scalbers @ Aug 12 2015, 07:11 PM) ... Aug 12 2015, 07:41 PM scalbers QUOTE (fredk @ Aug 12 2015, 07:41 PM) The... Aug 13 2015, 04:37 PM nprev Copied post from stevesilva over on the 'inter... Aug 13 2015, 04:01 AM Gennady Ionov Thank you, Explorer, Bill! Aug 13 2015, 04:27 AM Explorer1 They do in the main post; I've copied the link... Aug 13 2015, 04:44 AM nprev Whups! Sorry. Thanks, Explorer. Aug 13 2015, 05:05 AM Bill Harris Why not _fix_ the bad links in the earlier post? ... Aug 13 2015, 08:11 AM Bill Harris At Earth solar distances, we are not going to find... Aug 13 2015, 02:37 PM Sherbert QUOTE (Bill Harris @ Aug 13 2015, 03:37 P... Aug 13 2015, 05:47 PM Bjorn Jonsson Here is an animation I did of the New Horizons fly... Aug 13 2015, 05:39 PM Gennady Ionov QUOTE (Bjorn Jonsson @ Aug 13 2015, 10:39... Aug 13 2015, 06:22 PM Bjorn Jonsson QUOTE (Gennady Ionov @ Aug 13 2015, 06:22... Aug 13 2015, 07:27 PM fredk QUOTE (Bjorn Jonsson @ Aug 13 2015, 06:39... Aug 13 2015, 08:12 PM Bjorn Jonsson QUOTE (fredk @ Aug 13 2015, 08:12 PM) Bea... Aug 13 2015, 09:13 PM Gennady Ionov QUOTE (Bjorn Jonsson @ Aug 14 2015, 02:13... Aug 14 2015, 06:21 AM scalbers Pretty dramatic flyby from Bjorn 2 posts back. Int... Aug 13 2015, 05:57 PM ZLD Bravo Bjorn! The animation is really great and... Aug 13 2015, 07:48 PM fredk Cool, thanks for that!
About the stretching, ... Aug 13 2015, 09:45 PM Gennady Ionov QUOTE (fredk @ Aug 14 2015, 02:45 AM) Abo... Aug 14 2015, 06:30 AM Gennady Ionov I calculate the average over the angle values of ... Aug 14 2015, 12:42 PM fredk It's not clear that a psf measured from distan... Aug 14 2015, 02:47 PM Gennady Ionov QUOTE (fredk @ Aug 14 2015, 07:47 PM) It... Aug 14 2015, 03:16 PM fredk Yes, absolutely, I meant it will be hard to distin... Aug 14 2015, 04:24 PM Gennady Ionov New simulation shows New Horizons as it went into ... Aug 23 2015, 03:47 PM scalbers Most remarkable simulations with the atmospheric s... Aug 23 2015, 04:47 PM Gennady Ionov QUOTE (scalbers @ Aug 23 2015, 09:47 PM) ... Aug 23 2015, 07:01 PM scalbers Thanks for the update - I now can see the mini-moo... Aug 23 2015, 07:36 PM Gennady Ionov It's the same bug. At one point, I added a sma... Aug 23 2015, 08:43 PM Habukaz In case anyone missed it, the 29 June stellar occu... Sep 8 2015, 10:12 PM fredk The press release caption for PIA19880 says we may... Sep 14 2015, 12:22 AM fred_76 Hello!
Yesterday night I tried to surimpose a... Sep 15 2015, 02:30 PM scalbers That would be interesting to see if a good enough ... Sep 15 2015, 06:24 PM Ian R My attempt to 'unwrap' the hi-phase angle ... Sep 15 2015, 09:38 PM Herobrine Looks like ninjas are nearby, but here's an un... Sep 15 2015, 11:33 PM alan Some topography o the limb visible in these
http:... Oct 2 2015, 06:07 PM Herobrine The weekly SOC release was about 90 minutes ago. 8... Oct 2 2015, 07:00 PM Nafnlaus Tried stacking them to see if I could bring out an... Oct 2 2015, 11:56 PM alan Quote from a recent NASA article
QUOTE In these u... Oct 3 2015, 09:16 PM stevesliva Those hazes are *blue*
http://pluto.jhuapl.edu/New... Oct 8 2015, 04:50 PM scalbers QUOTE (stevesliva @ Oct 8 2015, 04:50 PM)... Oct 8 2015, 11:10 PM Nafnlaus And how blue they are
Such a simple image - the... Oct 8 2015, 07:21 PM ngunn And it vindicates the wonderful coloured version o... Oct 8 2015, 09:06 PM Ian R QUOTE (ngunn @ Oct 8 2015, 10:06 PM) And ... Oct 9 2015, 04:58 PM Bjorn Jonsson The blue color is interesting because it *may* mea... Oct 8 2015, 11:09 PM Gennady Ionov QUOTE (Bjorn Jonsson @ Oct 9 2015, 04:09 ... Oct 9 2015, 08:46 PM fredk QUOTE (Gennady Ionov @ Oct 9 2015, 09:46 ... Oct 9 2015, 10:51 PM remcook Though note that that fractal particles, such as f... Oct 9 2015, 08:05 AM scalbers Yes perhaps it should be bluer. I suppose we can s... Oct 9 2015, 06:24 PM Bjorn Jonsson In hindsight this test render I posted 2 months ag... Oct 9 2015, 07:45 PM ngunn I think you both (Ian and Bjorn) were absolutely s... Oct 9 2015, 08:56 PM Gennady Ionov I can simulate what portion of pixel crescent is s... Oct 10 2015, 12:32 AM fredk QUOTE (Gennady Ionov @ Oct 10 2015, 01:32... Oct 11 2015, 03:41 PM Gennady Ionov QUOTE (fredk @ Oct 11 2015, 08:41 PM) It... Oct 11 2015, 06:48 PM fredk QUOTE (Gennady Ionov @ Oct 11 2015, 07:48... Oct 11 2015, 08:46 PM Gennady Ionov QUOTE (fredk @ Oct 12 2015, 01:46 AM) Do ... Oct 12 2015, 06:38 AM Gennady Ionov If we multiply the green channel by 0.9, and blue ... Oct 11 2015, 07:29 AM scalbers I thought it would be interesting to compare simul... Oct 11 2015, 02:00 PM scalbers That's largely true though I'd be interest... Oct 11 2015, 04:17 PM Gennady Ionov QUOTE (scalbers @ Oct 11 2015, 09:17 PM) ... Oct 11 2015, 06:51 PM remcook A tweet from the Pluto session at the DPS meeting:... Nov 9 2015, 06:48 PM alan QUOTE Other results from the conference showed tha... Nov 9 2015, 10:15 PM scalbers On an AGU poster I recall something like a .0045 o... Dec 20 2015, 03:24 PM
HSchirmer QUOTE (fredk @ Aug 11 2015, 04:39 PM) ...... Aug 12 2015, 04:04 PM Gennady Ionov QUOTE (HSchirmer @ Aug 12 2015, 09:04 PM)... Aug 12 2015, 04:26 PM HSchirmer QUOTE (Gennady Ionov @ Aug 12 2015, 04:26... Sep 24 2015, 12:58 PM Gennady Ionov QUOTE (HSchirmer @ Sep 24 2015, 05:58 PM)... Oct 2 2015, 06:17 PM fredk Sure, Pluto's albedo depends on position, but ... Aug 11 2015, 05:36 PM Gennady Ionov QUOTE (fredk @ Aug 11 2015, 10:36 PM) Sur... Aug 11 2015, 06:12 PM fredk QUOTE (Gennady Ionov @ Aug 11 2015, 07:12... Aug 11 2015, 07:31 PM Gennady Ionov QUOTE (fredk @ Aug 12 2015, 12:31 AM) But... Aug 11 2015, 08:22 PM Bjorn Jonsson QUOTE (fredk @ Aug 11 2015, 07:31 PM) Tha... Aug 11 2015, 08:34 PM Gennady Ionov QUOTE (Bjorn Jonsson @ Aug 12 2015, 01:34... Aug 12 2015, 07:43 AM Gennady Ionov QUOTE (fredk @ Aug 12 2015, 12:31 AM) Tha... Aug 12 2015, 07:45 AM Sherbert The general conclusion seems to be that Pluto... Aug 11 2015, 09:08 PM Herobrine QUOTE (Sherbert @ Aug 11 2015, 05:08 PM) ... Aug 11 2015, 10:21 PM JRehling Meteors may appear over Earth at altitudes where t... Aug 12 2015, 06:40 PM Sherbert QUOTE (JRehling @ Aug 12 2015, 07:40 PM) ... Aug 13 2015, 02:07 PM Gennady Ionov QUOTE (Sherbert @ Aug 13 2015, 07:07 PM) ... Aug 13 2015, 03:30 PM fredk About the visibility of aerosols/haze in the pre-e... Aug 11 2015, 09:52 PM Bjorn Jonsson I have been attempting to model Pluto's atmosp... Aug 11 2015, 10:16 PM ngunn QUOTE (Bjorn Jonsson @ Aug 11 2015, 11:16... Aug 11 2015, 10:32 PM scalbers QUOTE (Bjorn Jonsson @ Aug 11 2015, 10:16... Aug 11 2015, 11:00 PM fredk QUOTE (Bjorn Jonsson @ Aug 11 2015, 11:16... Aug 12 2015, 12:25 AM Gennady Ionov QUOTE (Bjorn Jonsson @ Aug 12 2015, 03:16... Aug 12 2015, 08:02 AM remcook Bjorn, Scalbers: why not blue? It will be blue-ish... Aug 12 2015, 10:51 AM Gennady Ionov QUOTE (remcook @ Aug 12 2015, 03:51 PM) B... Aug 12 2015, 11:51 AM remcook Thanks! So, the colour from your colour simula... Aug 12 2015, 02:59 PM scalbers Good discussion of the additional factors about th... Aug 12 2015, 04:14 PM remcook About the phase functions, here ( http://inspirehe... Aug 12 2015, 06:05 PM scalbers Offhand, the phase function peak is more typically... Aug 12 2015, 06:11 PM fredk QUOTE (scalbers @ Aug 12 2015, 07:11 PM) ... Aug 12 2015, 07:41 PM scalbers QUOTE (fredk @ Aug 12 2015, 07:41 PM) The... Aug 13 2015, 04:37 PM nprev Copied post from stevesilva over on the 'inter... Aug 13 2015, 04:01 AM Gennady Ionov Thank you, Explorer, Bill! Aug 13 2015, 04:27 AM Explorer1 They do in the main post; I've copied the link... Aug 13 2015, 04:44 AM nprev Whups! Sorry. Thanks, Explorer. Aug 13 2015, 05:05 AM Bill Harris Why not _fix_ the bad links in the earlier post? ... Aug 13 2015, 08:11 AM Bill Harris At Earth solar distances, we are not going to find... Aug 13 2015, 02:37 PM Sherbert QUOTE (Bill Harris @ Aug 13 2015, 03:37 P... Aug 13 2015, 05:47 PM Bjorn Jonsson Here is an animation I did of the New Horizons fly... Aug 13 2015, 05:39 PM Gennady Ionov QUOTE (Bjorn Jonsson @ Aug 13 2015, 10:39... Aug 13 2015, 06:22 PM Bjorn Jonsson QUOTE (Gennady Ionov @ Aug 13 2015, 06:22... Aug 13 2015, 07:27 PM fredk QUOTE (Bjorn Jonsson @ Aug 13 2015, 06:39... Aug 13 2015, 08:12 PM Bjorn Jonsson QUOTE (fredk @ Aug 13 2015, 08:12 PM) Bea... Aug 13 2015, 09:13 PM Gennady Ionov QUOTE (Bjorn Jonsson @ Aug 14 2015, 02:13... Aug 14 2015, 06:21 AM scalbers Pretty dramatic flyby from Bjorn 2 posts back. Int... Aug 13 2015, 05:57 PM ZLD Bravo Bjorn! The animation is really great and... Aug 13 2015, 07:48 PM fredk Cool, thanks for that!
About the stretching, ... Aug 13 2015, 09:45 PM Gennady Ionov QUOTE (fredk @ Aug 14 2015, 02:45 AM) Abo... Aug 14 2015, 06:30 AM Gennady Ionov I calculate the average over the angle values of ... Aug 14 2015, 12:42 PM fredk It's not clear that a psf measured from distan... Aug 14 2015, 02:47 PM Gennady Ionov QUOTE (fredk @ Aug 14 2015, 07:47 PM) It... Aug 14 2015, 03:16 PM fredk Yes, absolutely, I meant it will be hard to distin... Aug 14 2015, 04:24 PM Gennady Ionov New simulation shows New Horizons as it went into ... Aug 23 2015, 03:47 PM scalbers Most remarkable simulations with the atmospheric s... Aug 23 2015, 04:47 PM Gennady Ionov QUOTE (scalbers @ Aug 23 2015, 09:47 PM) ... Aug 23 2015, 07:01 PM scalbers Thanks for the update - I now can see the mini-moo... Aug 23 2015, 07:36 PM Gennady Ionov It's the same bug. At one point, I added a sma... Aug 23 2015, 08:43 PM Habukaz In case anyone missed it, the 29 June stellar occu... Sep 8 2015, 10:12 PM fredk The press release caption for PIA19880 says we may... Sep 14 2015, 12:22 AM fred_76 Hello!
Yesterday night I tried to surimpose a... Sep 15 2015, 02:30 PM scalbers That would be interesting to see if a good enough ... Sep 15 2015, 06:24 PM Ian R My attempt to 'unwrap' the hi-phase angle ... Sep 15 2015, 09:38 PM Herobrine Looks like ninjas are nearby, but here's an un... Sep 15 2015, 11:33 PM alan Some topography o the limb visible in these
http:... Oct 2 2015, 06:07 PM Herobrine The weekly SOC release was about 90 minutes ago. 8... Oct 2 2015, 07:00 PM Nafnlaus Tried stacking them to see if I could bring out an... Oct 2 2015, 11:56 PM alan Quote from a recent NASA article
QUOTE In these u... Oct 3 2015, 09:16 PM stevesliva Those hazes are *blue*
http://pluto.jhuapl.edu/New... Oct 8 2015, 04:50 PM scalbers QUOTE (stevesliva @ Oct 8 2015, 04:50 PM)... Oct 8 2015, 11:10 PM Nafnlaus And how blue they are
Such a simple image - the... Oct 8 2015, 07:21 PM ngunn And it vindicates the wonderful coloured version o... Oct 8 2015, 09:06 PM Ian R QUOTE (ngunn @ Oct 8 2015, 10:06 PM) And ... Oct 9 2015, 04:58 PM Bjorn Jonsson The blue color is interesting because it *may* mea... Oct 8 2015, 11:09 PM Gennady Ionov QUOTE (Bjorn Jonsson @ Oct 9 2015, 04:09 ... Oct 9 2015, 08:46 PM fredk QUOTE (Gennady Ionov @ Oct 9 2015, 09:46 ... Oct 9 2015, 10:51 PM remcook Though note that that fractal particles, such as f... Oct 9 2015, 08:05 AM scalbers Yes perhaps it should be bluer. I suppose we can s... Oct 9 2015, 06:24 PM Bjorn Jonsson In hindsight this test render I posted 2 months ag... Oct 9 2015, 07:45 PM ngunn I think you both (Ian and Bjorn) were absolutely s... Oct 9 2015, 08:56 PM Gennady Ionov I can simulate what portion of pixel crescent is s... Oct 10 2015, 12:32 AM fredk QUOTE (Gennady Ionov @ Oct 10 2015, 01:32... Oct 11 2015, 03:41 PM Gennady Ionov QUOTE (fredk @ Oct 11 2015, 08:41 PM) It... Oct 11 2015, 06:48 PM fredk QUOTE (Gennady Ionov @ Oct 11 2015, 07:48... Oct 11 2015, 08:46 PM Gennady Ionov QUOTE (fredk @ Oct 12 2015, 01:46 AM) Do ... Oct 12 2015, 06:38 AM Gennady Ionov If we multiply the green channel by 0.9, and blue ... Oct 11 2015, 07:29 AM scalbers I thought it would be interesting to compare simul... Oct 11 2015, 02:00 PM scalbers That's largely true though I'd be interest... Oct 11 2015, 04:17 PM Gennady Ionov QUOTE (scalbers @ Oct 11 2015, 09:17 PM) ... Oct 11 2015, 06:51 PM remcook A tweet from the Pluto session at the DPS meeting:... Nov 9 2015, 06:48 PM alan QUOTE Other results from the conference showed tha... Nov 9 2015, 10:15 PM scalbers On an AGU poster I recall something like a .0045 o... Dec 20 2015, 03:24 PM |

|
Lo-Fi Version | Time is now: 21st September 2024 - 04:22 PM |
|
RULES AND GUIDELINES Please read the Forum Rules and Guidelines before posting. IMAGE COPYRIGHT |
OPINIONS AND MODERATION Opinions expressed on UnmannedSpaceflight.com are those of the individual posters and do not necessarily reflect the opinions of UnmannedSpaceflight.com or The Planetary Society. The all-volunteer UnmannedSpaceflight.com moderation team is wholly independent of The Planetary Society. The Planetary Society has no influence over decisions made by the UnmannedSpaceflight.com moderators. |
SUPPORT THE FORUM Unmannedspaceflight.com is funded by the Planetary Society. Please consider supporting our work and many other projects by donating to the Society or becoming a member. |
|