KIC 8462852 Observations |

KIC 8462852 Observations |
 Oct 15 2015, 04:45 PM Oct 15 2015, 04:45 PM
Post
#1
|
|
 Senior Member  Group: Members Posts: 2530 Joined: 20-April 05 Member No.: 321 |
Kepler found one very, very strange case:
http://www.theatlantic.com/science/archive...-galaxy/410023/ In a nutshell, while Kepler was observing it, the star (larger and brighter than the Sun) exhibited four dimming events that took place at irregular intervals, blocked a lot more light than a Jupiter-sized planet would block, and had a "shape" that varied in all four cases and did not resemble a planet. This case is attracting some wild speculation in fact, it is seemingly certain that something wild must be going on; it's just a matter of which wild scenario is the correct one. If I had to throw my hat in the ring, I'd guess that a distant collision and breakup has placed big swarms of matter into a very long-period orbit. But there's no hypothesis that's been offered that doesn't seem problematic. |
 |
 
|
 |
|
Jan 21 2016, 04:34 PM
Post
#2
|
||
 Member Group: Members Posts: 723 Joined: 13-June 04 Member No.: 82 |
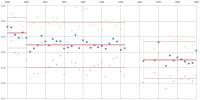
Attached is a diagram I made using 2-year bins. I followed the same protocol as the author, with RMS <0.33 mag, AFLAGS <9000, and the measured magnitude more than 0.2 mag above the quoted plate limit. For each bin, I have a large dot indicating the average reading within that bin, plus smaller dots at one sigma standard deviation above and below that value.
The high reading for the 1969-1970 bin is due to a single high outlier, and for the 1989-1990 bin is due to two high outliers (there were a lot more measurements in the latter bin than in the earlier bin). If I remove those three outliers, those two bin magnitudes drop significantly, and become consistent with the other post-1962 bins. I also added extra lines, indicating the averages plus one sigma standard deviations for all the measurements from 1890-1899, 1900-1952 and 1962-1989. The first time period from 1890 to 1899 definitely shows greater brightness than in the following 1900-1952 plateau. I have it as a plateau, but it visually looks like the brightness is declining over much of that decade. Visually, the chart seems to show long periods of relatively steady brightness, separated by ~0.1 mag drops in the late 1890s and in the 1950s.
Attached thumbnail(s)
|
|
|
|
|
|
 JRehling KIC 8462852 Observations Oct 15 2015, 04:45 PM
 ZLD Yeah, I will be patiently waiting and excited if t... Oct 15 2015, 08:42 PM scalbers Could this be like some of the dense clouds that e... Oct 15 2015, 10:08 PM ngunn Kepler is designed to look for transits - but how ... Oct 15 2015, 10:09 PM
 JRehling The research paper says that the properties of the... Oct 15 2015, 10:29 PM ZLD I think the biggest peculiarity that rules out a l... Oct 16 2015, 12:26 AM JRehling QUOTE (ZLD @ Oct 15 2015, 05:26 PM) I thi... Oct 16 2015, 04:27 AM nprev What spectral class is this star? Higher rotation ... Oct 16 2015, 04:44 AM JRehling QUOTE (nprev @ Oct 15 2015, 09:44 PM) Wha... Oct 16 2015, 04:10 PM ZLD @JReling: Thanks for the correction. I skimmed it ... Oct 16 2015, 05:28 AM silylene We need to account for a few facts here (see the ... Oct 16 2015, 02:43 PM JRehling QUOTE (silylene @ Oct 16 2015, 07:43 AM) ... Oct 16 2015, 04:27 PM HSchirmer QUOTE (JRehling @ Oct 16 2015, 05:27 PM) ... Oct 17 2015, 12:41 PM silylene QUOTE (JRehling @ Oct 16 2015, 05:27 PM) ... Oct 21 2015, 03:33 PM JRehling The biggest problem with the rings hypothesis is t... Oct 21 2015, 04:04 PM HSchirmer QUOTE (silylene @ Oct 21 2015, 03:33 PM) ... Oct 21 2015, 04:31 PM HSchirmer QUOTE (silylene @ Oct 21 2015, 03:33 PM) ... Jan 27 2016, 02:20 AM Gerald QUOTE (HSchirmer @ Jan 27 2016, 03:20 AM)... Jan 27 2016, 11:11 AM HSchirmer QUOTE (Gerald @ Jan 27 2016, 12:11 PM) De... Jan 27 2016, 02:16 PM JRehling QUOTE (HSchirmer @ Jan 26 2016, 07:20 PM)... Jan 27 2016, 06:26 PM scalbers Here's a web page that helps explain Epsilon A... Oct 17 2015, 01:17 PM ngunn Accepting the idea of eclipsing objects of some ki... Oct 17 2015, 08:54 PM HSchirmer QUOTE (ngunn @ Oct 17 2015, 08:54 PM) Acc... Oct 18 2015, 12:07 PM JRehling Interesting thoughts, nprev and HSchirmer. The fir... Oct 19 2015, 08:12 PM ngunn QUOTE (JRehling @ Oct 19 2015, 09:12 PM) ... Oct 19 2015, 09:19 PM HSchirmer QUOTE (JRehling @ Oct 19 2015, 09:12 PM) ... Oct 19 2015, 09:26 PM JRehling Comet Hale-Bopp's tail had a maximum length of... Oct 20 2015, 02:09 AM JRehling Another thought: A comet seen transiting its star ... Oct 20 2015, 05:46 PM HSchirmer QUOTE (JRehling @ Oct 20 2015, 06:46 PM) ... Oct 20 2015, 06:50 PM Hungry4info Look at the light curve. A dark sphere transiting ... Oct 20 2015, 12:48 AM Rittmann I was wondering...
How much obscuring could happe... Oct 20 2015, 08:49 PM ngunn I'm still not buying the comets idea, sorry. Oct 20 2015, 09:54 PM Explorer1 But as long as the parent planet's spin axis i... Oct 21 2015, 04:13 PM Mongo QUOTE (Explorer1 @ Oct 21 2015, 04:13 PM)... Oct 21 2015, 04:35 PM HSchirmer QUOTE (Mongo @ Oct 21 2015, 04:35 PM) But... Oct 21 2015, 05:30 PM Explorer1 And now a star getting 40% of its light blocked: h... Oct 21 2015, 05:43 PM silylene My concept is that the rings are not edge-on to ea... Oct 21 2015, 06:57 PM JRehling QUOTE (silylene @ Oct 21 2015, 11:57 AM) ... Oct 22 2015, 12:40 AM HSchirmer QUOTE (JRehling @ Oct 22 2015, 12:40 AM) ... Oct 23 2015, 12:33 PM alan The asymmetry of one of the transits reminds me of... Oct 21 2015, 07:33 PM AndyG Huge, dense and opaque ring systems that are tilte... Oct 22 2015, 08:37 AM JRehling QUOTE (AndyG @ Oct 22 2015, 01:37 AM) Hug... Oct 22 2015, 08:54 AM Hungry4info The relevant question is angular resolution, but t... Oct 23 2015, 01:10 PM Explorer1 I was browsing the extreme exoplanets list on Wiki... Oct 31 2015, 02:17 AM Hungry4info No, it isn't right at all. The original paper ... Oct 31 2015, 04:27 AM Explorer1 Yes, just as I suspected. I did a quick search t t... Oct 31 2015, 06:52 AM JRehling There are probably some planets made largely/entir... Nov 2 2015, 05:01 PM HSchirmer QUOTE (JRehling @ Nov 2 2015, 05:01 PM) .... Nov 3 2015, 03:44 AM JRehling QUOTE (HSchirmer @ Nov 2 2015, 08:44 PM) ... Nov 3 2015, 04:20 PM HSchirmer QUOTE (JRehling @ Nov 3 2015, 04:20 PM) T... Nov 3 2015, 04:59 PM JRehling QUOTE (HSchirmer @ Nov 3 2015, 09:59 AM) ... Nov 3 2015, 07:19 PM Hungry4info Besides, we know of numerous pulsar+WD binaries. Nov 3 2015, 07:48 PM nprev JRehling is correct. Please stay on topic. Nov 4 2015, 02:24 AM ZLD JPL posted a short article yesterday further sugge... Nov 25 2015, 05:36 PM Mongo Paper is up on ARXIV now:
KIC 8462852 - The Infra... Nov 26 2015, 01:49 AM Mongo KIC 8462852 Faded at an Average Rate of 0.165+-0.0... Jan 14 2016, 02:22 AM JRehling I wonder if the reality is that the dimming occurr... Jan 14 2016, 10:09 PM nprev Interesting. First thing this makes me think of is... Jan 14 2016, 02:33 AM Mongo QUOTE (nprev @ Jan 14 2016, 02:33 AM) Int... Jan 14 2016, 02:54 AM nprev Hmm. Curiouser indeed. Almost seems like it has to... Jan 14 2016, 03:00 AM ZLD Clearly just Starkiller Base finishing checkout te... Jan 14 2016, 03:07 PM Gerald Black holes (besides hypothesized primordial ones)... Jan 14 2016, 04:16 PM Mongo I noticed this statement from the Bradley E. Schae... Jan 16 2016, 06:04 PM Mongo Okay, I've decided to download the full archiv... Jan 16 2016, 06:39 PM JRehling The use of archival data to study the brightness v... Jan 25 2016, 05:50 PM HSchirmer QUOTE (JRehling @ Jan 25 2016, 05:50 PM) ... Jan 25 2016, 08:26 PM JRehling QUOTE (HSchirmer @ Jan 25 2016, 01:26 PM)... Jan 25 2016, 11:27 PM dudley QUOTE (JRehling @ Jan 26 2016, 12:27 AM) ... Jan 26 2016, 01:47 AM JRehling QUOTE (dudley @ Jan 25 2016, 06:47 PM) So... Jan 26 2016, 08:47 AM dudley KIC 8462852 is reportedly being watched for anothe... Jan 23 2016, 05:29 PM HSchirmer QUOTE (dudley @ Jan 23 2016, 06:29 PM) KI... Jan 25 2016, 03:53 PM nprev In order to keep the Kepler topic open for other o... Jan 25 2016, 11:02 AM dudley If I recall correctly, the Kepler Space telescope ... Jan 25 2016, 10:04 PM JRehling Kepler found no planets around this star, but that... Jan 25 2016, 11:29 PM HSchirmer QUOTE (dudley @ Jan 25 2016, 10:04 PM) If... Jan 26 2016, 12:52 AM JRehling QUOTE (HSchirmer @ Jan 25 2016, 05:52 PM)... Jan 26 2016, 09:20 AM HSchirmer QUOTE (JRehling @ Jan 26 2016, 10:20 AM) ... Jan 26 2016, 02:56 PM dudley I wonder if trillions of comets, especially after ... Jan 26 2016, 11:25 PM HSchirmer QUOTE (dudley @ Jan 26 2016, 11:25 PM) I ... Jan 27 2016, 12:21 AM JRehling During the Kepler era, KIC 8462852's brightnes... Jan 27 2016, 12:22 AM stevesliva QUOTE (JRehling @ Jan 26 2016, 08:22 PM) ... Jan 27 2016, 05:38 AM Gerald QUOTE (stevesliva @ Jan 27 2016, 06:38 AM... Jan 27 2016, 11:21 AM dudley I'm aware of two suggestions for how something... Jan 27 2016, 04:32 PM stevesliva I have been thinking a lot about the geometry and ... Jan 27 2016, 08:47 PM JRehling stevesliva, I like your idea, although I don't... Jan 28 2016, 08:08 PM Hungry4info Occam strikes again. Looks like the long-term dimm... Jan 28 2016, 01:27 AM Explorer1 So the modern dimming is just comets after all? Jan 28 2016, 07:32 AM silylene I still think my earlier proposal (prior thread po... Jan 28 2016, 02:44 PM dudley I'd like to see and consider Dr. Schaefer... Jan 28 2016, 05:31 PM Hungry4info Response from Schaefer. Rather direct...
http://ww... Jan 28 2016, 10:11 PM JRehling It seems like Schaefer has a definitively better g... Jan 29 2016, 12:24 AM Gerald Since intrinsic causes are considered unikely, as ... Jan 29 2016, 09:11 AM JRehling A Reddit chat about this phenomenon raised, and su... Jan 29 2016, 07:37 PM JRehling I've found a statement of the problem with an ... Jan 29 2016, 09:39 PM dvandorn A perfectly aligned stream of cometary bodies (or ... Jan 30 2016, 01:38 AM JRehling A problem with comets that are dark and far from a... Jan 30 2016, 03:55 AM Gerald It cannot be anything likely, since otherwise we w... Jan 30 2016, 03:17 AM Gerald The "it cannot be a young star due to the dis... Jan 30 2016, 11:02 AM dudley The luminosity class of KIC 8462852 seems to be co... Jan 30 2016, 05:21 PM
JRehling The research paper says that the properties of the... Oct 15 2015, 10:29 PM ZLD I think the biggest peculiarity that rules out a l... Oct 16 2015, 12:26 AM JRehling QUOTE (ZLD @ Oct 15 2015, 05:26 PM) I thi... Oct 16 2015, 04:27 AM nprev What spectral class is this star? Higher rotation ... Oct 16 2015, 04:44 AM JRehling QUOTE (nprev @ Oct 15 2015, 09:44 PM) Wha... Oct 16 2015, 04:10 PM ZLD @JReling: Thanks for the correction. I skimmed it ... Oct 16 2015, 05:28 AM silylene We need to account for a few facts here (see the ... Oct 16 2015, 02:43 PM JRehling QUOTE (silylene @ Oct 16 2015, 07:43 AM) ... Oct 16 2015, 04:27 PM HSchirmer QUOTE (JRehling @ Oct 16 2015, 05:27 PM) ... Oct 17 2015, 12:41 PM silylene QUOTE (JRehling @ Oct 16 2015, 05:27 PM) ... Oct 21 2015, 03:33 PM JRehling The biggest problem with the rings hypothesis is t... Oct 21 2015, 04:04 PM HSchirmer QUOTE (silylene @ Oct 21 2015, 03:33 PM) ... Oct 21 2015, 04:31 PM HSchirmer QUOTE (silylene @ Oct 21 2015, 03:33 PM) ... Jan 27 2016, 02:20 AM Gerald QUOTE (HSchirmer @ Jan 27 2016, 03:20 AM)... Jan 27 2016, 11:11 AM HSchirmer QUOTE (Gerald @ Jan 27 2016, 12:11 PM) De... Jan 27 2016, 02:16 PM JRehling QUOTE (HSchirmer @ Jan 26 2016, 07:20 PM)... Jan 27 2016, 06:26 PM scalbers Here's a web page that helps explain Epsilon A... Oct 17 2015, 01:17 PM ngunn Accepting the idea of eclipsing objects of some ki... Oct 17 2015, 08:54 PM HSchirmer QUOTE (ngunn @ Oct 17 2015, 08:54 PM) Acc... Oct 18 2015, 12:07 PM JRehling Interesting thoughts, nprev and HSchirmer. The fir... Oct 19 2015, 08:12 PM ngunn QUOTE (JRehling @ Oct 19 2015, 09:12 PM) ... Oct 19 2015, 09:19 PM HSchirmer QUOTE (JRehling @ Oct 19 2015, 09:12 PM) ... Oct 19 2015, 09:26 PM JRehling Comet Hale-Bopp's tail had a maximum length of... Oct 20 2015, 02:09 AM JRehling Another thought: A comet seen transiting its star ... Oct 20 2015, 05:46 PM HSchirmer QUOTE (JRehling @ Oct 20 2015, 06:46 PM) ... Oct 20 2015, 06:50 PM Hungry4info Look at the light curve. A dark sphere transiting ... Oct 20 2015, 12:48 AM Rittmann I was wondering...
How much obscuring could happe... Oct 20 2015, 08:49 PM ngunn I'm still not buying the comets idea, sorry. Oct 20 2015, 09:54 PM Explorer1 But as long as the parent planet's spin axis i... Oct 21 2015, 04:13 PM Mongo QUOTE (Explorer1 @ Oct 21 2015, 04:13 PM)... Oct 21 2015, 04:35 PM HSchirmer QUOTE (Mongo @ Oct 21 2015, 04:35 PM) But... Oct 21 2015, 05:30 PM Explorer1 And now a star getting 40% of its light blocked: h... Oct 21 2015, 05:43 PM silylene My concept is that the rings are not edge-on to ea... Oct 21 2015, 06:57 PM JRehling QUOTE (silylene @ Oct 21 2015, 11:57 AM) ... Oct 22 2015, 12:40 AM HSchirmer QUOTE (JRehling @ Oct 22 2015, 12:40 AM) ... Oct 23 2015, 12:33 PM alan The asymmetry of one of the transits reminds me of... Oct 21 2015, 07:33 PM AndyG Huge, dense and opaque ring systems that are tilte... Oct 22 2015, 08:37 AM JRehling QUOTE (AndyG @ Oct 22 2015, 01:37 AM) Hug... Oct 22 2015, 08:54 AM Hungry4info The relevant question is angular resolution, but t... Oct 23 2015, 01:10 PM Explorer1 I was browsing the extreme exoplanets list on Wiki... Oct 31 2015, 02:17 AM Hungry4info No, it isn't right at all. The original paper ... Oct 31 2015, 04:27 AM Explorer1 Yes, just as I suspected. I did a quick search t t... Oct 31 2015, 06:52 AM JRehling There are probably some planets made largely/entir... Nov 2 2015, 05:01 PM HSchirmer QUOTE (JRehling @ Nov 2 2015, 05:01 PM) .... Nov 3 2015, 03:44 AM JRehling QUOTE (HSchirmer @ Nov 2 2015, 08:44 PM) ... Nov 3 2015, 04:20 PM HSchirmer QUOTE (JRehling @ Nov 3 2015, 04:20 PM) T... Nov 3 2015, 04:59 PM JRehling QUOTE (HSchirmer @ Nov 3 2015, 09:59 AM) ... Nov 3 2015, 07:19 PM Hungry4info Besides, we know of numerous pulsar+WD binaries. Nov 3 2015, 07:48 PM nprev JRehling is correct. Please stay on topic. Nov 4 2015, 02:24 AM ZLD JPL posted a short article yesterday further sugge... Nov 25 2015, 05:36 PM Mongo Paper is up on ARXIV now:
KIC 8462852 - The Infra... Nov 26 2015, 01:49 AM Mongo KIC 8462852 Faded at an Average Rate of 0.165+-0.0... Jan 14 2016, 02:22 AM JRehling I wonder if the reality is that the dimming occurr... Jan 14 2016, 10:09 PM nprev Interesting. First thing this makes me think of is... Jan 14 2016, 02:33 AM Mongo QUOTE (nprev @ Jan 14 2016, 02:33 AM) Int... Jan 14 2016, 02:54 AM nprev Hmm. Curiouser indeed. Almost seems like it has to... Jan 14 2016, 03:00 AM ZLD Clearly just Starkiller Base finishing checkout te... Jan 14 2016, 03:07 PM Gerald Black holes (besides hypothesized primordial ones)... Jan 14 2016, 04:16 PM Mongo I noticed this statement from the Bradley E. Schae... Jan 16 2016, 06:04 PM Mongo Okay, I've decided to download the full archiv... Jan 16 2016, 06:39 PM JRehling The use of archival data to study the brightness v... Jan 25 2016, 05:50 PM HSchirmer QUOTE (JRehling @ Jan 25 2016, 05:50 PM) ... Jan 25 2016, 08:26 PM JRehling QUOTE (HSchirmer @ Jan 25 2016, 01:26 PM)... Jan 25 2016, 11:27 PM dudley QUOTE (JRehling @ Jan 26 2016, 12:27 AM) ... Jan 26 2016, 01:47 AM JRehling QUOTE (dudley @ Jan 25 2016, 06:47 PM) So... Jan 26 2016, 08:47 AM dudley KIC 8462852 is reportedly being watched for anothe... Jan 23 2016, 05:29 PM HSchirmer QUOTE (dudley @ Jan 23 2016, 06:29 PM) KI... Jan 25 2016, 03:53 PM nprev In order to keep the Kepler topic open for other o... Jan 25 2016, 11:02 AM dudley If I recall correctly, the Kepler Space telescope ... Jan 25 2016, 10:04 PM JRehling Kepler found no planets around this star, but that... Jan 25 2016, 11:29 PM HSchirmer QUOTE (dudley @ Jan 25 2016, 10:04 PM) If... Jan 26 2016, 12:52 AM JRehling QUOTE (HSchirmer @ Jan 25 2016, 05:52 PM)... Jan 26 2016, 09:20 AM HSchirmer QUOTE (JRehling @ Jan 26 2016, 10:20 AM) ... Jan 26 2016, 02:56 PM dudley I wonder if trillions of comets, especially after ... Jan 26 2016, 11:25 PM HSchirmer QUOTE (dudley @ Jan 26 2016, 11:25 PM) I ... Jan 27 2016, 12:21 AM JRehling During the Kepler era, KIC 8462852's brightnes... Jan 27 2016, 12:22 AM stevesliva QUOTE (JRehling @ Jan 26 2016, 08:22 PM) ... Jan 27 2016, 05:38 AM Gerald QUOTE (stevesliva @ Jan 27 2016, 06:38 AM... Jan 27 2016, 11:21 AM dudley I'm aware of two suggestions for how something... Jan 27 2016, 04:32 PM stevesliva I have been thinking a lot about the geometry and ... Jan 27 2016, 08:47 PM JRehling stevesliva, I like your idea, although I don't... Jan 28 2016, 08:08 PM Hungry4info Occam strikes again. Looks like the long-term dimm... Jan 28 2016, 01:27 AM Explorer1 So the modern dimming is just comets after all? Jan 28 2016, 07:32 AM silylene I still think my earlier proposal (prior thread po... Jan 28 2016, 02:44 PM dudley I'd like to see and consider Dr. Schaefer... Jan 28 2016, 05:31 PM Hungry4info Response from Schaefer. Rather direct...
http://ww... Jan 28 2016, 10:11 PM JRehling It seems like Schaefer has a definitively better g... Jan 29 2016, 12:24 AM Gerald Since intrinsic causes are considered unikely, as ... Jan 29 2016, 09:11 AM JRehling A Reddit chat about this phenomenon raised, and su... Jan 29 2016, 07:37 PM JRehling I've found a statement of the problem with an ... Jan 29 2016, 09:39 PM dvandorn A perfectly aligned stream of cometary bodies (or ... Jan 30 2016, 01:38 AM JRehling A problem with comets that are dark and far from a... Jan 30 2016, 03:55 AM Gerald It cannot be anything likely, since otherwise we w... Jan 30 2016, 03:17 AM Gerald The "it cannot be a young star due to the dis... Jan 30 2016, 11:02 AM dudley The luminosity class of KIC 8462852 seems to be co... Jan 30 2016, 05:21 PM |

|
Lo-Fi Version | Time is now: 18th June 2024 - 07:37 AM |
|
RULES AND GUIDELINES Please read the Forum Rules and Guidelines before posting. IMAGE COPYRIGHT |
OPINIONS AND MODERATION Opinions expressed on UnmannedSpaceflight.com are those of the individual posters and do not necessarily reflect the opinions of UnmannedSpaceflight.com or The Planetary Society. The all-volunteer UnmannedSpaceflight.com moderation team is wholly independent of The Planetary Society. The Planetary Society has no influence over decisions made by the UnmannedSpaceflight.com moderators. |
SUPPORT THE FORUM Unmannedspaceflight.com is funded by the Planetary Society. Please consider supporting our work and many other projects by donating to the Society or becoming a member. |
|