Juno at Jupiter, mission events as they unfold |

Juno at Jupiter, mission events as they unfold |
 Jul 5 2016, 07:53 PM Jul 5 2016, 07:53 PM
Post
#1
|
|
|
Merciless Robot  Group: Admin Posts: 8784 Joined: 8-December 05 From: Los Angeles Member No.: 602 |
This topic will consist of discussion of Juno operations post-JOI until end of mission, currently anticipated in Feb 2018.
-------------------- A few will take this knowledge and use this power of a dream realized as a force for change, an impetus for further discovery to make less ancient dreams real.
|
 |
 
|
 |
|
Aug 5 2016, 11:47 AM
Post
#2
|
|||||||||
|
Senior Member Group: Members Posts: 2346 Joined: 7-December 12 Member No.: 6780 |
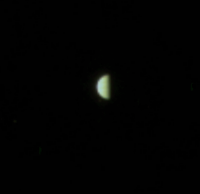
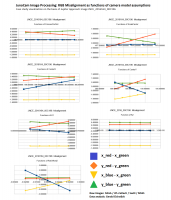
Quantitative measurements of the structure and velocity of Jupiter's cloud top may require a very accurate calibration of JunoCam's geometry.
However, when going well below one raw pixel alignment accuracy, it's hard to measure inaccuracies visually. Here seven animated examples, one for each of seven considered camera parameters, with five frames for each of the animated gifs. You may try to find out in which of the gifs you can perceive a change of color at the limbs, before looking at the graphics below. Varying the assumption of JunoCam frames per Juno rotation:
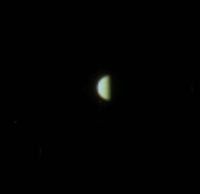
Varying the x/z ratio of the pinhole part of the model:
Varying the x-position of the optical axis:
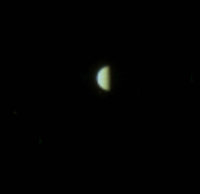
Varying the y-position of the optical axis:
Varying the Brownian radial distortion coefficient K1:
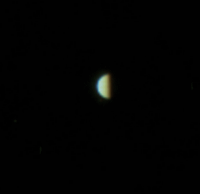
Varying the Brownian radial distortion coefficient K2:
Varying the assumption of the JunoCam CCD being rotated around its optical axis:
The subtle changes of the RGB misalignment can be quantfied more accurately by comparing the positions of the centroids for each color band in the processed images:
The misalignment unit in the graphics and data is 30 arc seconds, or about 1/4 raw pixel. Here the values as csv file:  JNCE_2016164_00C196_V01_proc013.BMP_RGBGradCSV.txt ( 10.09K )
Number of downloads: 232
JNCE_2016164_00C196_V01_proc013.BMP_RGBGradCSV.txt ( 10.09K )
Number of downloads: 232The graphics suggests locally linear dependence of the misalignments on the considered parameters. The misalignment can hence be approximated well by a system of linear equations, eventually written as y=Ax+b, with x,y,b vectors, and A a matrix. Since the number of parameters is 7, but there are only 4 linearly independent measurements, the space of solutions with (close to) perfect alignment is likely to be 3-dimensional for each image. The set of solution spaces for a sequence of images can then undergo statistical analysis. The graphics also suggests, that the x-alignment of the blue channel (yellow lines) can reasonably be obtained only by adjusting the y-position of the optical axis and/or adjusting the rotation of the camera around the optical axis, unless additional parameters are added to the model. |
||||||||
|
|
|
||||||||
 nprev Juno at Jupiter Jul 5 2016, 07:53 PM
 craigmcg Just under 24 hours after JOI, just inside Ganymed... Jul 6 2016, 01:55 AM
 MahFL I am surprised how far out Juno is going on these ... Jul 6 2016, 11:15 AM JohnVV as of right now Jul 6 2016, 06:28 PM tanjent This looks more like a projection of the second 53... Jul 7 2016, 03:13 AM Explorer1 It looks like the Celestia orbit plans ahead a cer... Jul 7 2016, 03:24 AM JohnVV i put a 120 day period for displaying the orbit
o... Jul 7 2016, 04:57 AM Glenn Orton The best Juno mission public site is: https://www.... Jul 9 2016, 10:30 PM nprev MOD NOTE: Big welcome to Glenn! Have moved his... Jul 10 2016, 04:00 AM stevesliva Appreciated! I am also amused by the pull quo... Jul 10 2016, 04:06 AM Explorer1 That quote is sure a blast from the past; interest... Jul 10 2016, 06:14 AM Saturns Moon Titan Can anyone resolve this inconsistency?
Both the w... Jul 10 2016, 09:32 PM mcaplinger QUOTE (Saturns Moon Titan @ Jul 10 2016, 01... Jul 10 2016, 10:05 PM Steve G First in orbit image released.
http://www.nasa.go... Jul 13 2016, 12:27 AM Mr Valiant Oh, the Great (but elusive) Red Spot. For us part ... Jul 13 2016, 10:53 AM Marvin There is a higher resolution version here:
http:/... Jul 13 2016, 12:38 PM Gerald This makes me feeling a mix of happy, curious, exc... Jul 13 2016, 03:06 PM Glenn Orton I'm happy to report that, so far as I know, al... Jul 14 2016, 09:57 PM stevesliva QUOTE (Glenn Orton @ Jul 14 2016, 05:57 P... Jul 15 2016, 04:53 PM nprev Good shooting, Glenn! Jul 15 2016, 07:04 AM Phil Stooke Pioneer 10. Trust me!
Phil Jul 15 2016, 09:47 PM elakdawalla WOOOOO APPROACH MOVIE RAWS Jul 18 2016, 11:01 PM mcaplinger Be warned that these all-spin images are large (16... Jul 19 2016, 01:48 AM Gerald Those images are great! You can actually see f... Jul 19 2016, 12:45 PM elakdawalla I'm trying to figure out how best to serve up ... Jul 20 2016, 08:00 PM mcaplinger QUOTE (elakdawalla @ Jul 20 2016, 12:00 P... Jul 20 2016, 09:28 PM Bjorn Jonsson QUOTE (mcaplinger @ Jul 20 2016, 09:28 PM... Jul 20 2016, 11:57 PM Gerald QUOTE (elakdawalla @ Jul 20 2016, 10:00 P... Jul 24 2016, 10:16 PM Gerald Currently, I'm working on overview products li... Jul 20 2016, 09:21 PM Gerald For those who can't wait, here preliminary ren... Jul 20 2016, 10:23 PM elakdawalla QUOTE (Gerald @ Jul 20 2016, 01:21 PM) Cu... Jul 20 2016, 11:04 PM Gerald QUOTE (elakdawalla @ Jul 21 2016, 01:04 A... Jul 21 2016, 12:20 PM mcaplinger QUOTE (elakdawalla @ Jul 20 2016, 03:04 P... Jul 22 2016, 06:53 PM Gerald Added the drafts for parts 3 and 4 to the same url... Jul 21 2016, 04:04 PM Don1 @Gerald....In the pictures that you posted in Post... Jul 22 2016, 08:45 AM Gerald QUOTE (Don1 @ Jul 22 2016, 10:45 AM) @Ger... Jul 22 2016, 10:29 AM Don1 One more low sun angle picture from ISS. Jupiter h... Jul 22 2016, 09:50 AM mcaplinger QUOTE (Don1 @ Jul 22 2016, 01:50 AM) I th... Jul 22 2016, 02:32 PM Gerald Draft processing of raw images of Jupiter approach... Jul 22 2016, 12:56 PM Gerald Although comprising only parts 1 and 5 of the appr... Jul 24 2016, 12:47 AM Gerald ... while rendering part 4 of the approach movie .... Jul 24 2016, 01:30 PM Gerald Rendition of Jupiter approach movies completed.
E... Jul 24 2016, 05:26 PM Brian Burns QUOTE (Gerald @ Jul 24 2016, 12:26 PM) Re... Jul 25 2016, 07:19 PM Phil Stooke Brilliant - well done!
Phil Jul 24 2016, 11:13 PM Gerald Thanks, Phil! It has been an easy exercise com... Jul 25 2016, 03:43 PM Floyd Gerald,
Very nice work. Question, where does the... Jul 25 2016, 08:08 PM Gerald @Brian Burns: Thanks! I hope so, too.
I'm ... Jul 25 2016, 08:39 PM mcaplinger QUOTE (Gerald @ Jul 25 2016, 12:39 PM) I... Jul 25 2016, 09:25 PM Gerald QUOTE (mcaplinger @ Jul 25 2016, 11:25 PM... Jul 31 2016, 12:39 AM Gerald Thanks, well I had almost three years time to expe... Jul 25 2016, 09:49 PM Gerald Animated gif of 4 images showing Ganymede's sh... Jul 25 2016, 10:51 PM Gerald The annotated image showing Ganymede as source of ... Jul 25 2016, 11:21 PM Gerald To find out the limiting magnitude for stars and p... Jul 27 2016, 11:09 AM craigmcg moderators - might be good to have a separate thre... Jul 27 2016, 06:11 PM elakdawalla Thanks, Gerald, for posting all your processed ima... Jul 29 2016, 03:29 PM mcaplinger QUOTE (elakdawalla @ Jul 29 2016, 07:29 A... Jul 29 2016, 05:00 PM elakdawalla QUOTE (mcaplinger @ Jul 29 2016, 09:00 AM... Aug 9 2016, 05:43 PM Gerald Thanks Emily, for taking this part! You're... Jul 29 2016, 04:41 PM wildespace I took the liberty of colour-balancing Gerald... Jul 31 2016, 09:14 AM Gerald The success of JunoCam outreach depends largely on... Jul 31 2016, 11:33 AM Gerald A refined Jupiter Approach AVI.
I've removed i... Aug 1 2016, 03:30 PM Gerald Added still images of refined version.
Besides im... Aug 2 2016, 03:45 AM JohnVV Juno is on it's way back to Jupiter Aug 2 2016, 04:13 AM wildespace If Juno will be passing over the night side of Jup... Aug 2 2016, 09:02 AM Gerald Juno's trajectory will likely be suitable to p... Aug 2 2016, 11:23 AM Bjorn Jonsson I have been experimenting with the color in the Ju... Aug 2 2016, 08:28 PM Gerald QUOTE (Bjorn Jonsson @ Aug 2 2016, 10:28 ... Aug 2 2016, 09:08 PM scalbers Interesting to see the version that matches the gl... Aug 2 2016, 08:41 PM scalbers I think the bright Earth clouds would be a better ... Aug 2 2016, 10:44 PM Gerald Ah, yes, this could resolve the discrepancy. I... Aug 3 2016, 12:54 AM scalbers Nice to see your updated large Earth view. It is t... Aug 9 2016, 05:47 PM Gerald Based on images JNCE_2016164_00C196 to JNCE_201616... Aug 8 2016, 11:18 PM Gerald Image JNCE_2016164_00C200 is sensitive to the numb... Aug 9 2016, 05:04 PM mcaplinger To be honest, I'm not really sure what you... Aug 9 2016, 05:29 PM Gerald QUOTE (mcaplinger @ Aug 9 2016, 07:29 PM)... Aug 9 2016, 07:35 PM mcaplinger QUOTE (Gerald @ Aug 9 2016, 11:35 AM) for... Aug 9 2016, 08:36 PM JohnVV juno's location as of now
-- some pretty pict... Aug 9 2016, 06:52 PM JohnVV it has been ten days , juno is getting closer in i... Aug 20 2016, 02:09 AM Decepticon Juno has started imagine correct? Aug 20 2016, 05:07 AM MahFL No NASA TV coverage of the first science pass ?
In... Aug 27 2016, 09:16 AM Bjorn Jonsson Juno's closest approach occurred several hours... Aug 27 2016, 07:44 PM JohnVV a repost of mine from a different forum
from 6 am... Aug 27 2016, 07:59 PM Bjorn Jonsson The flyby was a success!! Jupiter at range... Aug 27 2016, 09:40 PM Gerald A roughly linearized version enhances the beauty o... Aug 27 2016, 10:20 PM ZLD My take on the new image.
Aug 28 2016, 02:26 AM wildespace Lookin' good! But what is that vertical co... Aug 28 2016, 08:29 AM climber QUOTE (wildespace @ Aug 28 2016, 10:29 AM... Aug 28 2016, 11:41 AM Marvin Saturn's north pole hexagon may be unique.
Th... Aug 28 2016, 03:06 PM Ian R Let's not forget that Pioneer 11 got our first... Aug 28 2016, 03:31 PM JRehling Keep in mind that Jupiter's cloud deck is very... Aug 28 2016, 04:11 PM antipode QUOTE Let's not forget that Pioneer 11 got our... Aug 28 2016, 10:32 PM nprev Worth remembering that Jupiter only has an axial i... Aug 28 2016, 10:57 PM Bjorn Jonsson I doubt there is a hexagon at Jupiter's poles.... Aug 28 2016, 11:09 PM mcaplinger https://www.missionjuno.swri.edu/news/next-jupiter... Oct 15 2016, 05:09 AM Explorer1 Better safe than sorry, of course! And on the ... Oct 15 2016, 06:58 AM mcaplinger QUOTE (Explorer1 @ Oct 14 2016, 10:58 PM)... Oct 15 2016, 04:29 PM tanjent In some respects the issues faced by the mission m... Oct 15 2016, 02:57 PM B Bernatchez Would there be any problem with pressurizing the s... Oct 18 2016, 03:59 PM
MahFL I am surprised how far out Juno is going on these ... Jul 6 2016, 11:15 AM JohnVV as of right now Jul 6 2016, 06:28 PM tanjent This looks more like a projection of the second 53... Jul 7 2016, 03:13 AM Explorer1 It looks like the Celestia orbit plans ahead a cer... Jul 7 2016, 03:24 AM JohnVV i put a 120 day period for displaying the orbit
o... Jul 7 2016, 04:57 AM Glenn Orton The best Juno mission public site is: https://www.... Jul 9 2016, 10:30 PM nprev MOD NOTE: Big welcome to Glenn! Have moved his... Jul 10 2016, 04:00 AM stevesliva Appreciated! I am also amused by the pull quo... Jul 10 2016, 04:06 AM Explorer1 That quote is sure a blast from the past; interest... Jul 10 2016, 06:14 AM Saturns Moon Titan Can anyone resolve this inconsistency?
Both the w... Jul 10 2016, 09:32 PM mcaplinger QUOTE (Saturns Moon Titan @ Jul 10 2016, 01... Jul 10 2016, 10:05 PM Steve G First in orbit image released.
http://www.nasa.go... Jul 13 2016, 12:27 AM Mr Valiant Oh, the Great (but elusive) Red Spot. For us part ... Jul 13 2016, 10:53 AM Marvin There is a higher resolution version here:
http:/... Jul 13 2016, 12:38 PM Gerald This makes me feeling a mix of happy, curious, exc... Jul 13 2016, 03:06 PM Glenn Orton I'm happy to report that, so far as I know, al... Jul 14 2016, 09:57 PM stevesliva QUOTE (Glenn Orton @ Jul 14 2016, 05:57 P... Jul 15 2016, 04:53 PM nprev Good shooting, Glenn! Jul 15 2016, 07:04 AM Phil Stooke Pioneer 10. Trust me!
Phil Jul 15 2016, 09:47 PM elakdawalla WOOOOO APPROACH MOVIE RAWS Jul 18 2016, 11:01 PM mcaplinger Be warned that these all-spin images are large (16... Jul 19 2016, 01:48 AM Gerald Those images are great! You can actually see f... Jul 19 2016, 12:45 PM elakdawalla I'm trying to figure out how best to serve up ... Jul 20 2016, 08:00 PM mcaplinger QUOTE (elakdawalla @ Jul 20 2016, 12:00 P... Jul 20 2016, 09:28 PM Bjorn Jonsson QUOTE (mcaplinger @ Jul 20 2016, 09:28 PM... Jul 20 2016, 11:57 PM Gerald QUOTE (elakdawalla @ Jul 20 2016, 10:00 P... Jul 24 2016, 10:16 PM Gerald Currently, I'm working on overview products li... Jul 20 2016, 09:21 PM Gerald For those who can't wait, here preliminary ren... Jul 20 2016, 10:23 PM elakdawalla QUOTE (Gerald @ Jul 20 2016, 01:21 PM) Cu... Jul 20 2016, 11:04 PM Gerald QUOTE (elakdawalla @ Jul 21 2016, 01:04 A... Jul 21 2016, 12:20 PM mcaplinger QUOTE (elakdawalla @ Jul 20 2016, 03:04 P... Jul 22 2016, 06:53 PM Gerald Added the drafts for parts 3 and 4 to the same url... Jul 21 2016, 04:04 PM Don1 @Gerald....In the pictures that you posted in Post... Jul 22 2016, 08:45 AM Gerald QUOTE (Don1 @ Jul 22 2016, 10:45 AM) @Ger... Jul 22 2016, 10:29 AM Don1 One more low sun angle picture from ISS. Jupiter h... Jul 22 2016, 09:50 AM mcaplinger QUOTE (Don1 @ Jul 22 2016, 01:50 AM) I th... Jul 22 2016, 02:32 PM Gerald Draft processing of raw images of Jupiter approach... Jul 22 2016, 12:56 PM Gerald Although comprising only parts 1 and 5 of the appr... Jul 24 2016, 12:47 AM Gerald ... while rendering part 4 of the approach movie .... Jul 24 2016, 01:30 PM Gerald Rendition of Jupiter approach movies completed.
E... Jul 24 2016, 05:26 PM Brian Burns QUOTE (Gerald @ Jul 24 2016, 12:26 PM) Re... Jul 25 2016, 07:19 PM Phil Stooke Brilliant - well done!
Phil Jul 24 2016, 11:13 PM Gerald Thanks, Phil! It has been an easy exercise com... Jul 25 2016, 03:43 PM Floyd Gerald,
Very nice work. Question, where does the... Jul 25 2016, 08:08 PM Gerald @Brian Burns: Thanks! I hope so, too.
I'm ... Jul 25 2016, 08:39 PM mcaplinger QUOTE (Gerald @ Jul 25 2016, 12:39 PM) I... Jul 25 2016, 09:25 PM Gerald QUOTE (mcaplinger @ Jul 25 2016, 11:25 PM... Jul 31 2016, 12:39 AM Gerald Thanks, well I had almost three years time to expe... Jul 25 2016, 09:49 PM Gerald Animated gif of 4 images showing Ganymede's sh... Jul 25 2016, 10:51 PM Gerald The annotated image showing Ganymede as source of ... Jul 25 2016, 11:21 PM Gerald To find out the limiting magnitude for stars and p... Jul 27 2016, 11:09 AM craigmcg moderators - might be good to have a separate thre... Jul 27 2016, 06:11 PM elakdawalla Thanks, Gerald, for posting all your processed ima... Jul 29 2016, 03:29 PM mcaplinger QUOTE (elakdawalla @ Jul 29 2016, 07:29 A... Jul 29 2016, 05:00 PM elakdawalla QUOTE (mcaplinger @ Jul 29 2016, 09:00 AM... Aug 9 2016, 05:43 PM Gerald Thanks Emily, for taking this part! You're... Jul 29 2016, 04:41 PM wildespace I took the liberty of colour-balancing Gerald... Jul 31 2016, 09:14 AM Gerald The success of JunoCam outreach depends largely on... Jul 31 2016, 11:33 AM Gerald A refined Jupiter Approach AVI.
I've removed i... Aug 1 2016, 03:30 PM Gerald Added still images of refined version.
Besides im... Aug 2 2016, 03:45 AM JohnVV Juno is on it's way back to Jupiter Aug 2 2016, 04:13 AM wildespace If Juno will be passing over the night side of Jup... Aug 2 2016, 09:02 AM Gerald Juno's trajectory will likely be suitable to p... Aug 2 2016, 11:23 AM Bjorn Jonsson I have been experimenting with the color in the Ju... Aug 2 2016, 08:28 PM Gerald QUOTE (Bjorn Jonsson @ Aug 2 2016, 10:28 ... Aug 2 2016, 09:08 PM scalbers Interesting to see the version that matches the gl... Aug 2 2016, 08:41 PM scalbers I think the bright Earth clouds would be a better ... Aug 2 2016, 10:44 PM Gerald Ah, yes, this could resolve the discrepancy. I... Aug 3 2016, 12:54 AM scalbers Nice to see your updated large Earth view. It is t... Aug 9 2016, 05:47 PM Gerald Based on images JNCE_2016164_00C196 to JNCE_201616... Aug 8 2016, 11:18 PM Gerald Image JNCE_2016164_00C200 is sensitive to the numb... Aug 9 2016, 05:04 PM mcaplinger To be honest, I'm not really sure what you... Aug 9 2016, 05:29 PM Gerald QUOTE (mcaplinger @ Aug 9 2016, 07:29 PM)... Aug 9 2016, 07:35 PM mcaplinger QUOTE (Gerald @ Aug 9 2016, 11:35 AM) for... Aug 9 2016, 08:36 PM JohnVV juno's location as of now
-- some pretty pict... Aug 9 2016, 06:52 PM JohnVV it has been ten days , juno is getting closer in i... Aug 20 2016, 02:09 AM Decepticon Juno has started imagine correct? Aug 20 2016, 05:07 AM MahFL No NASA TV coverage of the first science pass ?
In... Aug 27 2016, 09:16 AM Bjorn Jonsson Juno's closest approach occurred several hours... Aug 27 2016, 07:44 PM JohnVV a repost of mine from a different forum
from 6 am... Aug 27 2016, 07:59 PM Bjorn Jonsson The flyby was a success!! Jupiter at range... Aug 27 2016, 09:40 PM Gerald A roughly linearized version enhances the beauty o... Aug 27 2016, 10:20 PM ZLD My take on the new image.
Aug 28 2016, 02:26 AM wildespace Lookin' good! But what is that vertical co... Aug 28 2016, 08:29 AM climber QUOTE (wildespace @ Aug 28 2016, 10:29 AM... Aug 28 2016, 11:41 AM Marvin Saturn's north pole hexagon may be unique.
Th... Aug 28 2016, 03:06 PM Ian R Let's not forget that Pioneer 11 got our first... Aug 28 2016, 03:31 PM JRehling Keep in mind that Jupiter's cloud deck is very... Aug 28 2016, 04:11 PM antipode QUOTE Let's not forget that Pioneer 11 got our... Aug 28 2016, 10:32 PM nprev Worth remembering that Jupiter only has an axial i... Aug 28 2016, 10:57 PM Bjorn Jonsson I doubt there is a hexagon at Jupiter's poles.... Aug 28 2016, 11:09 PM mcaplinger https://www.missionjuno.swri.edu/news/next-jupiter... Oct 15 2016, 05:09 AM Explorer1 Better safe than sorry, of course! And on the ... Oct 15 2016, 06:58 AM mcaplinger QUOTE (Explorer1 @ Oct 14 2016, 10:58 PM)... Oct 15 2016, 04:29 PM tanjent In some respects the issues faced by the mission m... Oct 15 2016, 02:57 PM B Bernatchez Would there be any problem with pressurizing the s... Oct 18 2016, 03:59 PM |

|
Lo-Fi Version | Time is now: 25th June 2024 - 04:58 AM |
|
RULES AND GUIDELINES Please read the Forum Rules and Guidelines before posting. IMAGE COPYRIGHT |
OPINIONS AND MODERATION Opinions expressed on UnmannedSpaceflight.com are those of the individual posters and do not necessarily reflect the opinions of UnmannedSpaceflight.com or The Planetary Society. The all-volunteer UnmannedSpaceflight.com moderation team is wholly independent of The Planetary Society. The Planetary Society has no influence over decisions made by the UnmannedSpaceflight.com moderators. |
SUPPORT THE FORUM Unmannedspaceflight.com is funded by the Planetary Society. Please consider supporting our work and many other projects by donating to the Society or becoming a member. |
|