Combining data from many perijoves, For images/mosaics that are not perijove-specific |

Combining data from many perijoves, For images/mosaics that are not perijove-specific |
 Apr 6 2018, 09:08 PM Apr 6 2018, 09:08 PM
Post
#1
|
||
 IMG to PNG GOD  Group: Moderator Posts: 2254 Joined: 19-February 04 From: Near fire and ice Member No.: 38 |
This thread is for images/mosaics that combine data from more than one perijove pass or compare data (e.g. the appearance of specific features on Jupiter) from two or more perijoves. In other words, it is for images and related stuff not specific to a single perijove.
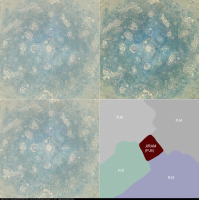
It is possible to use the JIRAM infrared images to attempt to guess what areas not imaged by JunoCam might look like at visual wavelengths. Below is a montage showing versions of a mosaic of JunoCam images from perijoves 1, 3, 4 and 5. The effects of the varying global illumination have been removed. The mosaic shows Jupiter's north polar region in orthographic projection from directly above. Because the north pole is in darkness, an inverted, heavily processed and colorized JIRAM mosaic was used to fill the gap at the north pole. This represents an attempt to guess what this area might look like in visible light. Small scale details in the cloud morphology should be fairly accurate/realistic but the overall contrast, brightness and color are based partially on a visual comparison of the JunoCam and JIRAM data farther from the pole where useful data from both instruments is available. It is difficult to guess how accurate this is but it is definitely far better than leaving this area blank! The JIRAM data appears a bit different from the JunoCam data in the mosaic but this is mainly because the JIRAM images suggest that the overall color and brightness in the area very near the pole (including the central cyclone) really are different from areas farther from the pole. Another factor is that the JIRAM data is of somewhat higher resolution. Also unlike JunoCam, the difficult illumination conditions in the polar region do not affect the JIRAM images. And here is the montage:
The montage shows the following: Upper left: An approximately true color/contrast mosaic of Jupiter's north polar region. Upper right: A mosaic of Jupiter's north polar region with enhanced colors and contrast. Lower left: The approximately true color/contrast version with a latitude/longitude grid. Latitudes are planetographic. Lower right: A diagram showing the areas covered by the different source images/data. Unless otherwise noted the data is from JunoCam. |
|
 |
 
|
|
 |
|
Apr 6 2018, 11:27 PM
Post
#2
|
|
|
Newbie Group: Members Posts: 10 Joined: 17-February 16 Member No.: 7899 |
I got the second one, too. Thanks for your email. For some reason, my reply to your email is bouncing back.
|
|
|
|
 Bjorn Jonsson Combining data from many perijoves Apr 6 2018, 09:08 PM
 Glenn Orton Hey, Bjorn,
May I show this at a Juno team meetin... Apr 6 2018, 09:33 PM Gerald That's maybe the thread where I should provide... Apr 6 2018, 09:49 PM Bjorn Jonsson Here is a comparable montage featuring a mosaic co... Apr 6 2018, 10:16 PM Bjorn Jonsson My Internet service provider has been having probl... Apr 6 2018, 11:33 PM Bjorn Jonsson A big map of Jupiter that combines the Juno polar ... May 15 2018, 11:36 PM
Glenn Orton Hey, Bjorn,
May I show this at a Juno team meetin... Apr 6 2018, 09:33 PM Gerald That's maybe the thread where I should provide... Apr 6 2018, 09:49 PM Bjorn Jonsson Here is a comparable montage featuring a mosaic co... Apr 6 2018, 10:16 PM Bjorn Jonsson My Internet service provider has been having probl... Apr 6 2018, 11:33 PM Bjorn Jonsson A big map of Jupiter that combines the Juno polar ... May 15 2018, 11:36 PM
 PaulH51 QUOTE (Bjorn Jonsson @ May 16 2018, 07:36... May 16 2018, 12:49 AM Sean Here are some portraits rendered with Bjorn's ... May 16 2018, 11:45 AM Brian Swift PJ00 through preliminary downlink of PJ20 animated... May 30 2019, 11:15 PM Brian Swift I've uploaded as set of 8K by 4K equirectangul... Jun 6 2019, 08:18 PM Bjorn Jonsson So far the Great Red Spot (GRS) has been well imag... Jul 7 2019, 10:08 PM Bjorn Jonsson Below is the latest addition to the series of Grea... Aug 13 2019, 10:03 PM Gerald Recently, John Rogers showed, that the north polar... Aug 21 2020, 01:11 AM
 |

|
Lo-Fi Version | Time is now: 22nd September 2024 - 12:00 AM |
|
RULES AND GUIDELINES Please read the Forum Rules and Guidelines before posting. IMAGE COPYRIGHT |
OPINIONS AND MODERATION Opinions expressed on UnmannedSpaceflight.com are those of the individual posters and do not necessarily reflect the opinions of UnmannedSpaceflight.com or The Planetary Society. The all-volunteer UnmannedSpaceflight.com moderation team is wholly independent of The Planetary Society. The Planetary Society has no influence over decisions made by the UnmannedSpaceflight.com moderators. |
SUPPORT THE FORUM Unmannedspaceflight.com is funded by the Planetary Society. Please consider supporting our work and many other projects by donating to the Society or becoming a member. |
|