Endeavour Drive - Drivability analysis |

  |
Endeavour Drive - Drivability analysis |
 Dec 18 2008, 05:18 PM Dec 18 2008, 05:18 PM
Post
#751
|
|
 Member  Group: Members Posts: 276 Joined: 11-December 07 From: Dar es Salaam, Tanzania Member No.: 3978 |
QUOTE (wbutler @ Dec 18 2008, 07:38 PM)  I also saw lots of 'Anatolia' features that could be a whole different kind of drivability hazard. Nice work Bill. But I doubt if those Anatolia features would give Opportunity much trouble (that is as long as it isn't 'hollow' underneath  ). ).
-------------------- |
 |
 
|
|
Dec 18 2008, 06:19 PM
Post
#752
|
|
|
Newbie Group: Members Posts: 16 Joined: 24-September 08 Member No.: 4351 |
Yes, I remember a description of a conversation between the scientists and the drivers when they discussed the original Anatolia:
Drivers - "Wait a minute, explain again what you said about 'falling in'". In any case I think they are difficult to cross and so the rover will have to weave around them. |
|
|
|
|
Dec 18 2008, 09:07 PM
Post
#753
|
|
|
Newbie Group: Members Posts: 16 Joined: 24-September 08 Member No.: 4351 |
The color map I chose when doing Victoria does a poor job of showing the Anatolia features - they all ended up green. Maybe I was too optimistic. But they are there in the data, and can be clearly seen in the grayscale image, for example image3a.png.
|
|
|
|
|
Dec 19 2008, 03:55 AM
Post
#754
|
|
|
Member Group: Members Posts: 808 Joined: 10-October 06 From: Maynard Mass USA Member No.: 1241 |
Does anyone know where/how to get the MOLA pings for Victoria to Endeavor?
My analysis has lingered for technical and time reasons (sigh!) but my DEM method would really spark up if I could see that data (registered to the Hires images?) any help would be appreciated! cheers Merry Christmas to all UMSFers and lurkers! -------------------- CLA CLL
|
|
|
|
|
Dec 19 2008, 10:33 AM
Post
#755
|
|
|
Founder Group: Chairman Posts: 14432 Joined: 8-February 04 Member No.: 1 |
Go with the HRSC data instead, higher res than the MOLA data.
Doug |
|
|
|
|
Dec 19 2008, 04:08 PM
Post
#756
|
|
|
Member Group: Members Posts: 808 Joined: 10-October 06 From: Maynard Mass USA Member No.: 1241 |
Doug,
I have looked at the HRSC data and all I can say is ....Brilliant! thanks! -------------------- CLA CLL
|
|
|
|
|
Dec 23 2008, 02:42 PM
Post
#757
|
||
 Senior Member Group: Moderator Posts: 2785 Joined: 10-November 06 From: Pasadena, CA Member No.: 1345 |
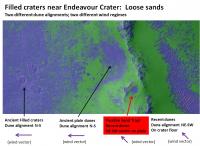
QUOTE (wbutler @ Dec 18 2008, 11:38 AM) I have finally completed my analysis of the new Endeavor image.... Nice job, Bill! Here is a crop at the edge of Endeavour Crater from your combined analysis image that illustrates some interesting features:
On the left there are some filled in craters that have extra large ripples in them. The N-S dune aligment indicates that these were filled in (and bigger dunes heaped up) back when the rest of the N-S aligned Meridiani ripples were set. So it probably happened long ago. (Why bigger dunes in the filled craters - maybe the sands filling the craters were loose-filled sands and didn't have as many armoring blueberries?) In the middle are regular N-S trending dunes like we see all over this region. At the far left is the interior of Endeavour crater. The dunes here are aligned differently, indicating a different wind regime. These are parallel to the recent dune alignment indicated in Sullivan et al., so one interpretation is that these are recently moved dunes (i.e. potential sand traps), [Another interpretation is that the crater interior funneled the local wind direction, but other filled craters with similar alignments in the "floor dunes" just to the N argue agains that possibility.] Indicated with a red arrow is a small patch of dunes outside the crater with a NE-SW alignment. This is parallel to the recently emplaced dunes. My interpretation is that these are recently emplaced dunes made of fine loose material that escaped the crater floor, only to fetch up against the low ridge (indicated in the Butler model in red). This patch could be a potential deathtrap for Opportunity. -Mike -------------------- Some higher resolution images available at my photostream: http://www.flickr.com/photos/31678681@N07/
|
|
|
|
|
|
|
Jan 20 2009, 04:32 AM
Post
#758
|
|
 Member Group: Members Posts: 236 Joined: 5-June 08 From: Udon Thani Member No.: 4185 |
QUOTE (PDP8E @ Dec 19 2008, 11:08 PM) I have looked at the HRSC data and all I can say is ....Brilliant! I just returned home last week, and have just browsed through the HRSC data also, and indeed it looks very good. There must be a way to combine this with the HiRISE images and find a method to identify for instance the various types of sand in sanddunes. I have some ideas, if I find the time I'll see if I can work them out. Regards, Geert. |
|
|
|
|
Jan 25 2009, 04:56 PM
Post
#759
|
|
|
Member Group: Members Posts: 428 Joined: 21-August 06 From: Northern Virginia Member No.: 1062 |
THEMIS'll give ideas as to the size of sand grains, but unfortunately it's a rather low res... Maybe CRISM data might help?
|
|
|
|
|
Jan 26 2009, 01:49 AM
Post
#760
|
||||
|
Member Group: Members Posts: 236 Joined: 5-June 08 From: Udon Thani Member No.: 4185 |
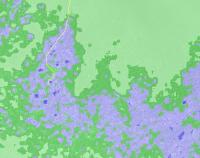
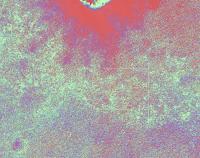
QUOTE (tuvas @ Jan 25 2009, 11:56 PM) THEMIS'll give ideas as to the size of sand grains, but unfortunately it's a rather low res... Maybe CRISM data might help? CRISM data is indeed easy accessible, I have to search to find a way to best match the data we are looking for. Low res is not too much of a problem, as in this case it is not about individual sand dunes but about surface material in general. Just to give an impression, I originally started with calculating 'roughness' of the surface based on variance in brightness, on the assumption that a lot of variance in brightness will indicate a rough surface. If I make this calculation for the present area Oppy is travelling in, you get the following map:
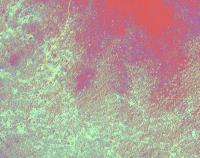
(lightgreen is best, dark red is worst). As has been mentioned before, this leaves the problem that bedrock area's are shown as 'rough' area's, as the software does not make a distinction between rock and sand. I can get this distinction if I follow the earlier suggestion of Mike and more or less make an inverted false color image of surface brightness, this SEEMS to make a distinction between rock and sand:
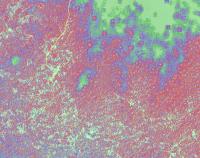
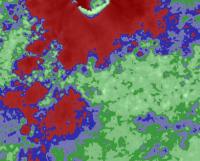
Now the 'yellow brick road' nicely stands out as lightgreen and sandy area's and anatolia features turn out red. However, this leaves the problem that nice flat sand area's are not distinguished from rough sanddunes. So, finally, once again conform Mike's suggestion, I can combine both analyzes, giving the following chart:
Now flat sandy area's turn out green, the yellow brick road turns out lightgreen, and sand dunes turn red. The actual mix of how you define the colors is all a bit subjective, just a bit of playing with some parameters, but it is getting somewhere. What leaves me uncomfortable is that this is all a lot about surface brightness (as defined by the HiRISE filters used), I much rather use a multi spectral scan and see if there is somewhere somehow a correlation between surface composition and 'drivability'. Whenever I find the time I'll just see where this leads me. Regards, Geert. Software tool (requires Windows with .NET 3.5): http://www.navtools.nl/deployment/roverrouter/installnow.htm |
|||
|
|
|
|||
|
Jan 26 2009, 06:32 AM
Post
#761
|
|
|
Member Group: Admin Posts: 976 Joined: 29-September 06 From: Pasadena, CA - USA Member No.: 1200 |
QUOTE (Geert @ Jan 25 2009, 05:49 PM) .... What leaves me uncomfortable is that this is all a lot about surface brightness (as defined by the HiRISE filters used), I much rather use a multi spectral scan and see if there is somewhere somehow a correlation between surface composition and 'drivability'. Whenever I find the time I'll just see where this leads me. ... Interesting. I did use a variance filter as well and it gave the similar results. Your observation about the intensity playing a role is true. If you think about it, the DC component of the fourier transform is in fact the average brightness of the patch. Since these algorithms are applied to the map projected HiRISE images, which are radiometrically corrected, it is quite possible we are all impressed by classifying mostly image brightness! I think I need to refresh my memory on co-occurrence matrix texture classification. Paolo -------------------- Disclaimer: all opinions, ideas and information included here are my own,and should not be intended to represent opinion or policy of my employer.
|
|
|
|
|
Jan 26 2009, 09:13 AM
Post
#762
|
|||
|
Member Group: Members Posts: 236 Joined: 5-June 08 From: Udon Thani Member No.: 4185 |
If I compare the 'sandtrap-analysis' between our 'normal' HiRISE image and the CRISM IR2 data there do seem to be some interesting differences, mainly in the south-eastern portion of the image:
Topmost is HiRISE, and below CRISM of same area and same scale. Difference in resolution is offcourse clearly visible, but surface brightness as seen by CRISM seems to differ quite a lot mainly in the south and south-east area. Don't know what to make of it, might be just chasing ghosts... Regarding the technique: I stopped using 'absolute' values some time ago in my tool, what it does is it first calculates average pixel brightness across the complete image, and then creates a dataset of pixelbrightness as a percentage of the average value. Colors are then related to this percentages, so 'red' does not relate to a specific pixel brightness, but instead to a brightness relative to the average brightness of the whole picture. In fact I do the same with the variance, which is also defined as a relative value (so even in an image of a very rough terrain the color green might be seen as 'less rough then average'). This makes it easier to compare images. Calculating variance-values or a FFT analysis of the CRISM data is useless, as its resolution is too low to catch any sanddunes, I'm just looking if there is any way to catch differences in surface material in relation to "drivability". Regards, Geert |
||
|
|
|
||
|
Jan 26 2009, 10:01 AM
Post
#763
|
|
|
Member Group: Members Posts: 713 Joined: 30-March 05 Member No.: 223 |
QUOTE (RoverDriver @ Jan 26 2009, 07:32 AM) I think I need to refresh my memory on co-occurrence matrix texture classification. Paolo Speaking of texture classification: I've been playing with various texture classification methods (mostly self-written, experimental C-implementations of Co-occurence matrices, Gabor filters, Texture energy based filter banks and others). The problem I see with most of those methods is that the spatial resolution of the additional information that is gained with the filters (e.g. directional trend of dune crests) will be by far less than the spatial resolution of the original intensity information. To obtain some significant texture information requires local windows at least 10 pixels wide (or even much more, depending on the method). Another problem is that of reducing the very high dimensionality of the output of texture filter banks (For example with co-occurence-matrices, we will have one individual band (image) for each direction and each pixel-spacing). Usually there will be dozens (or hundreds) of dimensions that must be mapped to a lower dimensionl space in order to become practical for further processing/visualization. I have tried various PCA-based and SOM neural networks (Self Organized feature Maps) methods, but many of those require a lot of tuning parameters themselves and therefore further increasing the dimensionality (dgrees-of-freedom) of the original problem. (So from the point of view of spatial resolution, I think the approach to use additional (low resolution ) spectral bands ( CRISM/THEMIS ) could be more promising than the even lower resolution texture classification approach) Also, I think as far as the incorporation of textural information in the surface analysis is concerned, we already have a very good coverage by James Canvin's Fourier-based mapping approach. I doubt that any other texture operator could add much additional classifying strength to those maps 
|
|
|
|
|
Jan 26 2009, 03:13 PM
Post
#764
|
|
|
Member Group: Admin Posts: 976 Joined: 29-September 06 From: Pasadena, CA - USA Member No.: 1200 |
QUOTE (Nirgal @ Jan 26 2009, 02:01 AM) ... The problem I see with most of those methods is that the spatial resolution of the additional information that is gained with the filters (e.g. directional trend of dune crests) will be by far less than the spatial resolution of the original intensity information. Of course! But put this in perspective, if I had to schedule a drive where I need to guarantee the rover position within small margins, I would probably increse the risk factor way too much. 10x10/pix on a HiRISE is only 2.5x2.5m, just above one rover size. QUOTE To obtain some significant texture information requires local windows at least 10 pixels wide (or even much more, depending on the method). Another problem is that of reducing the very high dimensionality of the output of texture filter banks (For example with co-occurence-matrices, we will have one individual band (image) for each direction and each pixel-spacing). Usually there will be dozens (or hundreds) of dimensions that must be mapped to a lower dimensionl space in order to become practical for further processing/visualization. I have tried various PCA-based and SOM neural networks (Self Organized feature Maps) methods, but many of those require a lot of tuning parameters themselves and therefore further increasing the dimensionality (dgrees-of-freedom) of the original problem. That is correct and that is why I did not try this method yet. Maybe applying feedback from past drives to the classifier would help? I dont know, just thinking out loud. QUOTE (So from the point of view of spatial resolution, I think the approach to use additional (low resolution ) spectral bands ( CRISM/THEMIS ) could be more promising than the even lower resolution texture classification approach) Besides the much lower resolution of this data, the problem I see is registration of these maps with HiRISE. But this would probably be the method I prefer if I had the means to pursue it. QUOTE Also, I think as far as the incorporation of textural information in the surface analysis is concerned, we already have a very good coverage by James Canvin's Fourier-based mapping approach. I doubt that any other texture operator could add much additional classifying strength to those maps It might be so, but as I was saying, I would not be surprised if even the FT was somehow mostly influenced by intensity rather than texture. Ihave to think about it. Paolo -------------------- Disclaimer: all opinions, ideas and information included here are my own,and should not be intended to represent opinion or policy of my employer.
|
|
|
|
|
Jan 26 2009, 06:49 PM
Post
#765
|
|
|
Senior Member Group: Moderator Posts: 2785 Joined: 10-November 06 From: Pasadena, CA Member No.: 1345 |
QUOTE (RoverDriver @ Jan 26 2009, 10:13 AM) It might be so, but as I was saying, I would not be surprised if even the FT was somehow mostly influenced by intensity rather than texture. I've been wondering about this too... I wonder what the James Canvin FT map would look like using Geert's dataset of %pixel brightness to a moving localized (regional) average? Would it balance out the natural brightness variation and give a better result? I've been wondering how to create an artificial "background" gradient, then superimpose (or subtract away) a search for brightness variations with the regular big-dune wavelength. For the last several weeks Oppy has been driving in an area where the brightness and roughness seems to correlate pretty well. Assuming Oppy turns to the E, in the next few km, Oppy will go into an area where some of our terrain models diverge big-time. (This is the region smack dab in the middle of the HiRise images we've been using) This new region, and points south should make a really good test of the different models. -Mike -------------------- Some higher resolution images available at my photostream: http://www.flickr.com/photos/31678681@N07/
|
|
|
|
|

|
Lo-Fi Version | Time is now: 28th May 2024 - 02:00 PM |
|
RULES AND GUIDELINES Please read the Forum Rules and Guidelines before posting. IMAGE COPYRIGHT |
OPINIONS AND MODERATION Opinions expressed on UnmannedSpaceflight.com are those of the individual posters and do not necessarily reflect the opinions of UnmannedSpaceflight.com or The Planetary Society. The all-volunteer UnmannedSpaceflight.com moderation team is wholly independent of The Planetary Society. The Planetary Society has no influence over decisions made by the UnmannedSpaceflight.com moderators. |
SUPPORT THE FORUM Unmannedspaceflight.com is funded by the Planetary Society. Please consider supporting our work and many other projects by donating to the Society or becoming a member. |
|