Temperature and pressure at Gale, Suitable (for short periods) for liquid water? |

  |
Temperature and pressure at Gale, Suitable (for short periods) for liquid water? |
 Mar 8 2013, 12:57 PM Mar 8 2013, 12:57 PM
Post
#76
|
||
|
Senior Member  Group: Members Posts: 2346 Joined: 7-December 12 Member No.: 6780 |
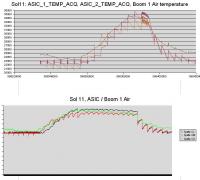
QUOTE (jmknapp @ Mar 7 2013, 10:01 PM)  ... One thing that strikes me is the frequent spikes/dips of up to about 10 degrees over a short period of time. Could these be "real"? Maybe warmer air from the RTG fins wafts over from time to time? A hint may give, whether shorter-term changes of air temperature is correlated with temperature in the interior of the rover. I assumed, that the ASIC values measure some interior temperature of the rover. Therefore I put the three sol 11 uncalibrated temperature curves (ASIC 1, ASIC 2, and Boom 1 Air) into one diagram (the first by timestamps, the second by records), the more jiggered are the ASICs.
To my eyes there is some correlation of temperature changes between ASICs and Air, best visible in "the evening" of the second diagram, although I didn't investigate this quantitatively. This may support your idea to a certain degree. But it doesn't exclude influence of "true" short-term changes of air temperature. EDIT: I'm a bit confused, because the file is internally called sol 11 (MSL:LOCAL_MEAN_SOLAR_TIME = "Sol-00011M10:08:40:097"), but it's in subdirectory for sol 10. So there seem to be two different counters for sols. |
|
 |
 
|
|
|
Mar 8 2013, 03:25 PM
Post
#77
|
|
|
Member Group: Members Posts: 279 Joined: 19-August 07 Member No.: 3299 |
QUOTE (jmknapp @ Mar 7 2013, 04:01 PM) It'll be interesting to compare to the calibrated results to see how involved that process is, or if it's just linear. One thing that strikes me is the frequent spikes/dips of up to about 10 degrees over a short period of time. Could these be "real"? Maybe warmer air from the RTG fins wafts over from time to time? Yes it is a good question since the mini-variations of temperature only occurs anything different than the sun's heat. |
|
|
|
|
Mar 8 2013, 06:27 PM
Post
#78
|
||
 Senior Member Group: Members Posts: 1465 Joined: 9-February 04 From: Columbus OH USA Member No.: 13 |
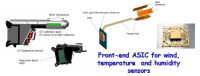
Gerald, it may be correlated because the ASIC chip isn't very far into the interior of the rover, according to this diagram:
That's from this document: Mixed-Signal ASIC for Rover Environmental Monitoring System Showing the trend over multiple sols would take some data massaging, as each day can have something like 30,000 samples, which would be a lot of overkill. There are some apparent glitches here and there that might have to be dealt with. Maybe best to wait for the calibrated data! Specifically the ground temperature daily swing would be interesting--isn't that what they used to show the transition between the high and low thermal inertial units as they entered Glenelg? -------------------- |
|
|
|
|
|
|
Mar 8 2013, 07:30 PM
Post
#79
|
|
|
Senior Member Group: Members Posts: 2346 Joined: 7-December 12 Member No.: 6780 |
You are right: It's hard to tell, in which way the counter values are composed. Looks, as if we had to wait for calibrated data to assess those small fluctuations.
Ground temperatures will also be the more interesting data to estimate the possibility of liquid water at Gale. Probably the thermopile data will be better-suited for this purpose. And thanks for pointing to the docu of the locations of the sensors! |
|
|
|
|
Mar 12 2013, 10:21 AM
Post
#80
|
|||
|
Senior Member Group: Members Posts: 1465 Joined: 9-February 04 From: Columbus OH USA Member No.: 13 |
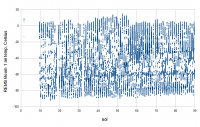
Here's a quick-and-dirty chart of the temperature over sols 1-89:
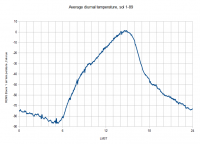
Actual calibration may vary, but we can safely say that, baby, it's cold up there. Another potentially interesting way to look at the data is to average the sols together to get an average temperature curve over the course of the day:
That's a little dodgy because the sun rise and set times vary over the time period, but not by much: sol 0: rise 5:31 set 17:23 sol 89: rise 5:18 set 17:24 -------------------- |
||
|
|
|
||
|
Aug 14 2013, 10:46 AM
Post
#81
|
|
|
Senior Member Group: Members Posts: 1465 Joined: 9-February 04 From: Columbus OH USA Member No.: 13 |
A couple of plots generated from the REMS data feed, which appears to be kept current within a few sols:
Daily temperature Daily pressure Those are set up to automatically update from the feed every day. -------------------- |
|
|
|
|
Aug 15 2013, 09:46 AM
Post
#82
|
|
 Senior Member Group: Members Posts: 1088 Joined: 19-February 05 From: Close to Meudon Observatory in France Member No.: 172 |
QUOTE (jmknapp @ Aug 14 2013, 12:46 PM) Those are set up to automatically update from the feed every day. Thanks a lot for those useful links and for this real good work  For the temperatures, could they be generated, please, also with °Celsius (or °Kelvins) : this could really be of a great help for the rest of the planet using the metric system... Thanks again so much and cheers ! 
|
|
|
|
|
Aug 15 2013, 10:02 AM
Post
#83
|
|
 Senior Member Group: Members Posts: 2429 Joined: 30-January 13 From: Penang, Malaysia. Member No.: 6853 |
QUOTE (jmknapp @ Aug 14 2013, 06:46 PM) Joe, great work as always, will you be adding links to these charts and data on your rover links page? (http://curiosityrover.com/links.html) Paul. |
|
|
|
|
Aug 15 2013, 12:16 PM
Post
#84
|
|
|
Senior Member Group: Members Posts: 1465 Joined: 9-February 04 From: Columbus OH USA Member No.: 13 |
Paul-- Good idea--I was trying to see how I could fit another button ("REMS weather") on the main page, but for now I put the urls in the links page.
VikingMars-- Aww, I suppose you also want the pressure graph in Pascals. I'll work on adding a selectable dropdown for C, F, K.As for the data itself, it's been mentioned before, but still very interesting that if you take the phase chart of water (with the triple point, etc.) it looks like there are times at this site when liquid water could theoretically exist on the surface. -------------------- |
|
|
|
|
Aug 15 2013, 03:57 PM
Post
#85
|
|
|
Senior Member Group: Members Posts: 1465 Joined: 9-February 04 From: Columbus OH USA Member No.: 13 |
-------------------- |
|
|
|
|
Aug 15 2013, 09:23 PM
Post
#86
|
|
 Senior Member Group: Members Posts: 2173 Joined: 28-December 04 From: Florida, USA Member No.: 132 |
QUOTE (jmknapp @ Aug 15 2013, 10:57 AM) OK, here are the plots with selectable units... One thing that leaps out on the Centigrade scale is how the freezing point of water looks like a rough mean for the highs. The lack of a 32 degree line makes it less obvious on the Fahrenheit scale. Never heard of the Rankine scale before. Interesting.
|
|
|
|
|
Aug 16 2013, 07:02 PM
Post
#87
|
|
|
Senior Member Group: Members Posts: 1465 Joined: 9-February 04 From: Columbus OH USA Member No.: 13 |
I put in a dotted line to mark the H2O freezing point for all the scales. Also a button on the main page to see the weather (temperature and pressure anyway) on one page: Weather
-------------------- |
|
|
|
|
Aug 16 2013, 08:16 PM
Post
#88
|
|
|
Senior Member Group: Members Posts: 2086 Joined: 13-February 10 From: Ontario Member No.: 5221 |
Looks like the colors at around sol 73 or so are switched, with the max in blue and minimum in red; just a glitch?
Very nice chart otherwise, it will become more and more interesting as long term observations come in. |
|
|
|
|
Aug 16 2013, 08:30 PM
Post
#89
|
|
|
Senior Member Group: Members Posts: 1465 Joined: 9-February 04 From: Columbus OH USA Member No.: 13 |
QUOTE (Explorer1 @ Aug 16 2013, 04:16 PM) Looks like the colors at around sol 73 or so are switched, with the max in blue and minimum in red; just a glitch? Very nice chart otherwise, it will become more and more interesting as long term observations come in. That's the way it is in the data file from http://data.marsweather.com/rems_climate.xml (sol 73). I was thinking of filtering that out, but there's also the weird dip lasting several sols around sol 295, which can't be real (can it?). So maybe it's best to just leave it as is. The pressure plot is interesting because of the local minimum of pressure--like there will be at least two minimums a year, assuming it's due to the solar cycle and not some other factor. -------------------- |
|
|
|
|
Aug 16 2013, 09:17 PM
Post
#90
|
|
 Member Group: Members Posts: 105 Joined: 13-July 05 From: The Hague, NL Member No.: 434 |
The dotted line at 32 F is too pessimistic when you're thinking about liquid water on Mars. A reasonable quantity of dissolved (soluble) salts would easily drop the freezing point to 25 F or lower, which brings most of the measured temps "above the line".
But pls. bear in mind that all the mentioned triple point- and other liq-vap data for water are measured in what's called a "closed system", i.e. 100% water inside a cylinder with a moving piston. An equivalent closed system at Mars would have to be underground. At the surface of Mars we have an open system with such an extremely low partial pressure of water (%water vapor in Mars atmosphere * abs. pressure at the surface of Mars) that we're nowhere near liq/vap equilibrium. Any water pushed to the surface of Mars would "explode" into vapor. |
|
|
|
|

|
Lo-Fi Version | Time is now: 23rd May 2024 - 12:50 PM |
|
RULES AND GUIDELINES Please read the Forum Rules and Guidelines before posting. IMAGE COPYRIGHT |
OPINIONS AND MODERATION Opinions expressed on UnmannedSpaceflight.com are those of the individual posters and do not necessarily reflect the opinions of UnmannedSpaceflight.com or The Planetary Society. The all-volunteer UnmannedSpaceflight.com moderation team is wholly independent of The Planetary Society. The Planetary Society has no influence over decisions made by the UnmannedSpaceflight.com moderators. |
SUPPORT THE FORUM Unmannedspaceflight.com is funded by the Planetary Society. Please consider supporting our work and many other projects by donating to the Society or becoming a member. |
|