Dawn approaches Ceres, From opnav images to first orbit |

  |
Dawn approaches Ceres, From opnav images to first orbit |
 Mar 4 2015, 03:52 PM Mar 4 2015, 03:52 PM
Post
#646
|
|
|
Senior Member  Group: Members Posts: 2346 Joined: 7-December 12 Member No.: 6780 |
Ceres maps normalized to about the same local solar time, animated in 5-degree steps (corresponding to 20 "Ceres minutes"),
based on the 27 RC2 frames of pia18920.gif:  Light curves are smoothed/interpolated by Gauss curve of standard deviation 9.3 degrees. |
 |
 
|
|
Mar 4 2015, 07:56 PM
Post
#647
|
|
|
Member Group: Members Posts: 153 Joined: 20-December 14 From: Eastbourne, UK Member No.: 7372 |
QUOTE (algorimancer @ Mar 4 2015, 01:47 PM)  I have the impression that "something" has formed deposits in the south polar regions (less clear in the north). Color would be really helpful in guessing what this might be. CO2 occurred to me (thinking of Mars as an example), though it could simply be water ice with a different texture, perhaps deposited near the poles following sublimation near the equator. Could be something else -- perhaps simply dust? Here's a good example, outlined in red. The albedo of this region remains lower than in adjacent regions independently of variations in lighting as Ceres rotates. I have doubled the image size, with lanczos3 smoothing. [attachment=35241:pia18920_frame18x2.png] The Northern edge of the area you have highlighted looks to be a boundary marked by a change in elevation resulting from a resurfacing event. The lighter material to the North having flowed over an earlier resurfacing event. Much of the dark colour of Ceres can be attributable to dust and dust catalysed photochemical reactions of the volatiles slowly sublimating through the dust to form complex organics. The longer a surface has been exposed the darker its appearance. If there was once, or even still is, a subsurface liquid ocean, it would remain for longest in the equatorial regions and any resurfacing events or convection mixing of the sub-surface ices would be more recent than nearer the poles. Salts dissolved in the liquid/ice and left behind by sublimation, would also one suspects contribute to a lighter surface colour. One would expect therefore the surface in the polar regions to appear darker. The Hubble colours suggest the equatorial regions are a sort of orange/red colour normally associated with Thollins, but the evidence from the moons of Jupiter, Saturn and Uranus and most recently from comet 67P, is that long term exposure to higher levels of UV radiation from the Sun gradually turns these organics a very dark brown colour. Kuiper belt objects such as Pluto still retain much of the red colour suggesting either fresher surfaces or insufficient radiation intensity to completely "cook" the organics. Titan with its suggested liquid/gas Methane cycle, constantly refreshes the volatiles available for new Thollin formation, hence the continuing orange haze in its atmosphere. Europa where surface recycling is thought to be a lot slower and longer process than on Enceladus, there is time for significant amounts of coloured organics to build up on the surface, concentrated near the fractures where volatiles from below have reached the surface probably dissolved in liquid water. All this might suggest that through some process, probably convection in the ice layer, the surface in the coloured equatorial and mid-lattitude regions of Ceres, is slowly being recycled and there may still be sub-surface seas rather than a global ocean. The big caveat to that is the way the Hubble "colours" were attributed to Ceres, they are not true colours and some of the above speculation could be proved completely wrong. Dawn is able to take true colour images when closer, so we will have to wait and see I suppose. |
|
|
|
|
Mar 4 2015, 08:10 PM
Post
#648
|
||
 Member Group: Members Posts: 656 Joined: 20-April 05 From: League City, Texas Member No.: 285 |
QUOTE (Sherbert @ Mar 4 2015, 01:56 PM) ...dark colour of Ceres can be attributable to dust and dust catalysed photochemical reactions of the volatiles slowly sublimating through the dust to form complex organics... That was a great post, and clarifies many things. I decided to play with Gerald's light curves animation. Focusing on the pixels with data for all frames between frames 17 to 28, I determined the slope of the light curve over that range for each pixel, then did a color projection of that slope onto the red and green channels. Here's the result, which should provide some sense of different surface properties per the light curve slope. Gerald, I'm sure you could do something rather more sophisticated since you have more complete data (and rather more expertise), but this is a start.
|
|
|
|
|
|
|
Mar 4 2015, 09:20 PM
Post
#649
|
|
|
Senior Member Group: Members Posts: 2346 Joined: 7-December 12 Member No.: 6780 |
Great first step in analysing the light curves!
Slope of the light curves may be correlated to albedo. To separate slope and albedo of the terrain properly, I guess two or three parameters of the light curve need to be inferred. I can't yet predict how successful this will be, but I'm intending to work on it the next days. Nice to see others working on the analysis, too! 
|
|
|
|
|
Mar 4 2015, 11:02 PM
Post
#650
|
|
 Member Group: Members Posts: 423 Joined: 13-November 14 From: Norway Member No.: 7310 |
Those 'twin craters' that were very visible in the first OpNav sessions still look pretty intriguing. The biggest of them (the one to the right) is not properly within the field of view for any of the 27 RC2 pictures that have been released (and they are both inconveniently low on Ceres' sphere from Dawn's RC2 vantage point, obviously).
In the map rotation movie, the biggest one still looks like a double crater, and there does appear to be some sort of valleys in the area of the original linear features (visible to the left and to the bottom in frame 27). In the event that the brightest spots turn out to be just two small impacts, I think this part of Ceres might just be the most exciting one. Those craters (if that's what they actually are) look pretty strange, and the grooves are right above them; apparently extending all the way down to the biggest crater.  A big area above those craters is also very smooth (as can be verified as it moves into the nightside), and it also contains the chevron-like feature I posted earlier. Something is going on there (or rather: has gone on). -------------------- |
|
|
|
|
Mar 4 2015, 11:46 PM
Post
#651
|
|||
 Member Group: Members Posts: 714 Joined: 3-January 08 Member No.: 3995 |
A possible process of producing straight valleys on Ceres....
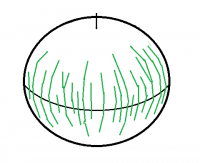
Ceres' oblateness and density have been interpreted as evidence of an icy envelope around a rocky core. What then would have happened to the relatively brittle crust above the plastic/fluid mantle as Ceres transformed into an ellipsoid? Longitudinal cracks should have formed (I think) as tensional forces stretched the equator:
Grabens may have formed as some blocks were displaced:
(Dimensions and extent of features are not necessarily to scale.) In recent imagery, there seem to be some longitudinal valleys (grabens?) in a few places, but they are pretty degraded. It would be interesting to see if there is (more) evidence of a fracture pattern as Dawn moves in for a closer look. Of course this process may be completely wrong; I'm just trying to make sense of what we've seen so far. |
||
|
|
|
||
|
Mar 5 2015, 11:33 AM
Post
#652
|
|
 Member Group: Members Posts: 495 Joined: 12-February 12 Member No.: 6336 |
Tomorrow 6/3 Dawn will start 'officially' to orbit Ceres.
Max Planck institute have a nice summary of what lies ahead. It can be noted that when they talk about the white features, they say the reflectivity is over 40% of the infalling light and that both ice and salts is a possible explanation. The latter mentioned since the possibility of salts have been mentioned in this thread. |
|
|
|
|
Mar 5 2015, 02:05 PM
Post
#653
|
|
 Member Group: Members Posts: 241 Joined: 22-August 05 From: Stockholm Sweden Member No.: 468 |
QUOTE (Gerald @ Mar 4 2015, 10:20 PM) Great first step in analysing the light curves! Slope of the light curves may be correlated to albedo. To separate slope and albedo of the terrain properly, I guess two or three parameters of the light curve need to be inferred. I can't yet predict how successful this will be, but I'm intending to work on it the next days. Nice to see others working on the analysis, too! I am impressed with the registration of the images in the animation. good work! You can use the light curve to estimate the X component of the surface normal direction. (A good brdf model would help here) But you have no per pixel info on the Y component so getting an albedo value is not fully constrained. But if you assume that the local albedo between local pixel lines is constant you can estimate the Y component of the normal vector. From there it is possible to get a resonable good estimate of albedo. Fun stuff. |
|
|
|
|
Mar 5 2015, 02:29 PM
Post
#654
|
|
|
Member Group: Members Posts: 656 Joined: 20-April 05 From: League City, Texas Member No.: 285 |
I can estimate the albedo as the maximum value of the light curve. Doing this, I find a correlation of -.92 with the slopes of the light curves (over frames 17-28, as before). Looking at it as r^2, we might estimate that 85% of the variance in the slopes of the light curve is explained by the albedo. This is of course rather simplistic -- many things are not accounted for.
|
|
|
|
|
Mar 5 2015, 02:53 PM
Post
#655
|
|
|
Member Group: Members Posts: 423 Joined: 13-November 14 From: Norway Member No.: 7310 |
The currently available key dates (more or less) from now until December this year:
6 March: Dawn's orbital capture by Ceres (61,000 km) 10 April: OpNav 6 (21,000 km, 306 pixels) 14 April: OpNav 7 (14,000 km, 453 pixels) 23 April: Dawn reaches RC3 orbit (13,500 km) May: Dawn reaches survey orbit (4,400 km) July: Dawn reaches high-altitude mapping orbit, HAMO (1,470 km) December: Dawn reaches low-altitude mapping orbit, LAMO (375 km) (from here and the usual table) So Dawn's mapping orbit starts the same month that New Horizon's Pluto flyby occurs. -------------------- |
|
|
|
|
Mar 5 2015, 03:10 PM
Post
#656
|
|
|
Senior Member Group: Members Posts: 2346 Joined: 7-December 12 Member No.: 6780 |
QUOTE (Malmer @ Mar 5 2015, 03:05 PM) I am impressed with the registration of the images in the animation. good work! You can use the light curve to estimate the X component of the surface normal direction. (A good brdf model would help here) But you have no per pixel info on the Y component so getting an albedo value is not fully constrained. But if you assume that the local albedo between local pixel lines is constant you can estimate the Y component of the normal vector. From there it is possible to get a resonable good estimate of albedo. Fun stuff. Thanks! I'm thinking at inferring the topography from the X component allone plus some stereo correlation, if necessary. That way (I hope) it's possible to retrieve the y slope without additional assumptions about albedo, since albedo is one information I'm hoping to be able to infer. Fortunately Ceres isn't quite as irregular as 67P/C-G such that it's possible to add constraints about the overall shape, e.g. there shouldn't be global jumps between the ellipses of constant latitude. I've already done some investigation about the brdf model with OpNav3, but got values not really compatible with Phong models of a smooth surface. I think, there are ways to find a solution without a-priori knowledge of the brdf, but just assuming the mere existence of a pointwise brdf with some general additional properties like one local maximum and negative second derivative along x. After comparing the DLR version of the RC2 map with my version I see a global summed longitude error in my map of about 17 degrees (hence two images less lacking than I first calculated). So some of my assumptions about the image geometry or the shape of Ceres may be inaccurate (I guess my 920 km pole to pole diameter assumption). With the reference map I'm very confident to be able to pin this down. The result should be an even better registration, hence better light curve data. |
|
|
|
|
Mar 5 2015, 04:23 PM
Post
#657
|
|
 Administrator Group: Admin Posts: 5172 Joined: 4-August 05 From: Pasadena, CA, USA, Earth Member No.: 454 |
QUOTE (Gladstoner @ Mar 4 2015, 03:46 PM) Ceres' oblateness and density have been interpreted as evidence of an icy envelope around a rocky core. What then would have happened to the relatively brittle crust above the plastic/fluid mantle as Ceres transformed into an ellipsoid? This assumes that Ceres started out a sphere with the same spin rate it has now, or that it spun up for some reason. But there's no reason to assume either of those things. Icy moons of giant planets are thought to have experienced forces like this because they would have started out spinning relatively fast (like Ceres does now), and then spun down as a result of tidal forces until they reached their present-day rotation rates, becoming more spherical in the process -- it causes global compression at the equator and extension near the poles. But there are no tidal forces on Ceres so you wouldn't get tectonics related to despinning. Now one thing that can cause global tectonics on a body that lacks moons or a planet is global reorientation. If you have a body like Ceres (or Mars!) that experiences a big impact or major volcanic event that causes a major shift in the center of gravity, the spin axis may reorient to a more stable position, putting excess mass at the equator. That may have happened to center the Tharsis province across the equator at Mars. The preexisting rotational bulge would then be in the wrong position, and spin-related stresses would act to reshape the planet to match the new location of the spin axis. -------------------- My website - My Patreon - @elakdawalla on Twitter - Please support unmannedspaceflight.com by donating here.
|
|
|
|
|
Mar 5 2015, 05:22 PM
Post
#658
|
|
|
Senior Member Group: Members Posts: 3516 Joined: 4-November 05 From: North Wales Member No.: 542 |
QUOTE (elakdawalla @ Mar 5 2015, 04:23 PM) or that it spun up for some reason. Presumably it would have spun up somewhat as gravitational differentiation of the interior progressed. (But maybe that happened too early to be related to these surface features?) |
|
|
|
|
Mar 5 2015, 06:23 PM
Post
#659
|
|
|
Member Group: Members Posts: 714 Joined: 3-January 08 Member No.: 3995 |
QUOTE (ngunn @ Mar 5 2015, 11:22 AM) Presumably it would have spun up somewhat as gravitational differentiation of the interior progressed. (But maybe that happened too early to be related to these surface features?) That's kind of what I was visualizing (edit: progression of the differentiation, that is). |
|
|
|
|
Mar 5 2015, 06:26 PM
Post
#660
|
||
|
Member Group: Members Posts: 656 Joined: 20-April 05 From: League City, Texas Member No.: 285 |
QUOTE (Habukaz @ Mar 4 2015, 05:02 PM) Those 'twin craters' that were very visible in the first OpNav sessions still look pretty intriguing.... Something is going on there (or rather: has gone on). I'm assuming this refers to the two prominent depressions visible south and east of the bright spot, as in the lower portion of this image:
It seems like this region was omitted from both the most recent image/movie releases. Would any of Dawn the team members care to comment on whether this was intentional? Perhaps something they'd like to interpret and publish/publicize prior to a more general release? That's not an unreasonable prerogative, I'd just like to clarify where we stand. |
|
|
|
|
|
|

|
Lo-Fi Version | Time is now: 1st June 2024 - 10:56 AM |
|
RULES AND GUIDELINES Please read the Forum Rules and Guidelines before posting. IMAGE COPYRIGHT |
OPINIONS AND MODERATION Opinions expressed on UnmannedSpaceflight.com are those of the individual posters and do not necessarily reflect the opinions of UnmannedSpaceflight.com or The Planetary Society. The all-volunteer UnmannedSpaceflight.com moderation team is wholly independent of The Planetary Society. The Planetary Society has no influence over decisions made by the UnmannedSpaceflight.com moderators. |
SUPPORT THE FORUM Unmannedspaceflight.com is funded by the Planetary Society. Please consider supporting our work and many other projects by donating to the Society or becoming a member. |
|