Experimental Rhea DEM animation, Generated from stereo images |

Experimental Rhea DEM animation, Generated from stereo images |
 Jul 21 2007, 09:10 PM Jul 21 2007, 09:10 PM
Post
#1
|
||||||
 IMG to PNG GOD  Group: Moderator Posts: 2251 Joined: 19-February 04 From: Near fire and ice Member No.: 38 |
It works!! For months I've been trying to get my program for generating DEMs from stereo images to work properly. A recent 'rant' of mine can be found here.
Well, to make a long story short my software now at last works:
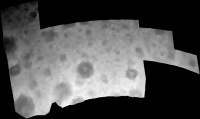
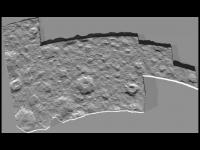
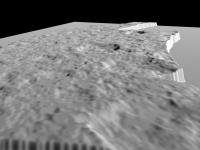
The only drawback is that the DEM has a somewhat 'contoured' appearance. This shows up in renderings of the DEM, even after I smoothed it considerably using Photoshop. Still this is much better than the infamous horizontal lines I got in my shape from shading experiments. A rendering showing the DEM:
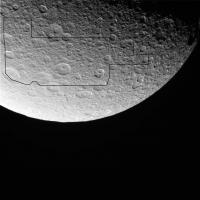
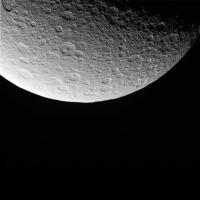
However, 2-3 meters away from the monitor this looks very nice (the thumbnail image also looks nice  ). It turns out that the software has managed to detect most of the craters except for the really small ones. If someone finds a way to process the DEM image and remove the 'contours' without excessive loss of details I'd like to know. Please note that the DEM is a 16 bits/pixel image. ). It turns out that the software has managed to detect most of the craters except for the really small ones. If someone finds a way to process the DEM image and remove the 'contours' without excessive loss of details I'd like to know. Please note that the DEM is a 16 bits/pixel image.Some additional notes on the DEM: The DEM is a section from a 4320x2160 pixel simple cylindrical map and has an altitude range of approximately 16 km. The lowest points (black) are 778.6 km from Rhea's center and the highest ones (white) are 794.5 km from Rhea's center. This is odd (Rhea's dimensions are 768x763x763 km) and is probably due to inaccuracies in the viewing geometry information that came with the PDS files I used. The overall lower elevation of the upper part of the DEM compared to the lower part is probably another manifestation of this. I used these two images obtained in January 2005:
North is to the right in the images. Looking at the images it is apparent that the DEM's heavily contoured appearance at upper left is (probably) due to the fact that there wasn't a very big difference in the viewing geometry in that area whereas in the lower part of the DEM the difference is significant. Taking a section of Steve Albers' map and draping it over the DEM produces interesting results (The crater at ~(315,260) in the DEM is at ~(3440,1160) in Steve's map). Here is a quick-and-dirty animation: Rhea experimental DEM animation (4.6 MB) In contrast, without Steve's map things get less realistic:
However, now the lightsource can be anywhere. Needless to say I'm happy. The only problem is the huge number of DEMs I want to do: All of Saturn's major satellites (everything that can be done - global if at all possible), various sites on Mars etc. This is a lot of work, the DEM of Rhea required 100+ manually measured control points and then took almost 4 hours to compute on a 3 GHz machine. Also the viewing geometry needs to be refined. |
|||||
 |
 
|
|||||
 Bjorn Jonsson Experimental Rhea DEM animation Jul 21 2007, 09:10 PM
 ugordan It's probably saying something you already kno... Jul 21 2007, 09:17 PM scalbers Interesting work Bjorn. For the contouring, perhap... Jul 21 2007, 10:15 PM Bjorn Jonsson Regarding possible quantized elevations there are ... Jul 22 2007, 01:43 AM MouseOnMars Well, that's great. I've been frustrated b... Jul 22 2007, 01:46 AM angel1801 I downloaded the the .avi file and it runs perfect... Jul 22 2007, 03:23 PM scalbers Great - winamp works well for me. And that's a... Jul 22 2007, 06:53 PM edstrick "...I downloaded the the .avi file and it run... Jul 23 2007, 06:49 AM algorimancer Bjorn, that is indeed very nifty - impressive even... Jul 24 2007, 02:42 AM Bjorn Jonsson Generating DEMs for MSL the way route maps are gen... Jul 27 2007, 05:34 PM
 algorimancer QUOTE (Bjorn Jonsson @ Jul 27 2007, 12:34... Jul 28 2007, 01:14 PM
 tfisher QUOTE This is one of the things frustrating me - t... Jul 28 2007, 02:53 PM Michael Capobianco Perhaps not surprisingly, I vote for the Iapetus S... Jul 27 2007, 09:27 PM FordPrefect Bjorn, this is VERY interesting! Your results ... Jul 28 2007, 06:45 PM Bjorn Jonsson This is a preliminary DEM of Mimas' Herschel c... Aug 4 2007, 05:08 PM malgar QUOTE (Bjorn Jonsson @ Jun 20 2007, 02:10... Aug 22 2007, 08:56 AM Bjorn Jonsson This looks very impressive but it would be very in... Aug 23 2007, 12:33 AM malgar QUOTE (Bjorn Jonsson @ Aug 23 2007, 02:33... Aug 23 2007, 11:26 AM Bjorn Jonsson QUOTE (malgar @ Aug 22 2007, 08:56 AM) Ca... Aug 24 2007, 11:54 PM Bjorn Jonsson Here is a fairly big DEM of Mimas:
This is a se... Aug 28 2007, 12:13 AM um3k QUOTE (Bjorn Jonsson @ Aug 27 2007, 08:13... Aug 28 2007, 01:01 AM
tfisher QUOTE This is one of the things frustrating me - t... Jul 28 2007, 02:53 PM Michael Capobianco Perhaps not surprisingly, I vote for the Iapetus S... Jul 27 2007, 09:27 PM FordPrefect Bjorn, this is VERY interesting! Your results ... Jul 28 2007, 06:45 PM Bjorn Jonsson This is a preliminary DEM of Mimas' Herschel c... Aug 4 2007, 05:08 PM malgar QUOTE (Bjorn Jonsson @ Jun 20 2007, 02:10... Aug 22 2007, 08:56 AM Bjorn Jonsson This looks very impressive but it would be very in... Aug 23 2007, 12:33 AM malgar QUOTE (Bjorn Jonsson @ Aug 23 2007, 02:33... Aug 23 2007, 11:26 AM Bjorn Jonsson QUOTE (malgar @ Aug 22 2007, 08:56 AM) Ca... Aug 24 2007, 11:54 PM Bjorn Jonsson Here is a fairly big DEM of Mimas:
This is a se... Aug 28 2007, 12:13 AM um3k QUOTE (Bjorn Jonsson @ Aug 27 2007, 08:13... Aug 28 2007, 01:01 AM  |

|
Lo-Fi Version | Time is now: 28th May 2024 - 11:20 PM |
|
RULES AND GUIDELINES Please read the Forum Rules and Guidelines before posting. IMAGE COPYRIGHT |
OPINIONS AND MODERATION Opinions expressed on UnmannedSpaceflight.com are those of the individual posters and do not necessarily reflect the opinions of UnmannedSpaceflight.com or The Planetary Society. The all-volunteer UnmannedSpaceflight.com moderation team is wholly independent of The Planetary Society. The Planetary Society has no influence over decisions made by the UnmannedSpaceflight.com moderators. |
SUPPORT THE FORUM Unmannedspaceflight.com is funded by the Planetary Society. Please consider supporting our work and many other projects by donating to the Society or becoming a member. |
|