Temperature and pressure at Gale, Suitable (for short periods) for liquid water? |

  |
Temperature and pressure at Gale, Suitable (for short periods) for liquid water? |
 May 12 2014, 01:43 AM May 12 2014, 01:43 AM
Post
#121
|
|
 Senior Member  Group: Members Posts: 1465 Joined: 9-February 04 From: Columbus OH USA Member No.: 13 |
FYI, the SETI Institute has a talk scheduled for 12:00pm Pacific on Tuesday May 13th:
Carbon dioxide snowfalls, polar caps, and the climate of Mars -------------------- |
 |
 
|
|
Sep 12 2014, 02:27 AM
Post
#122
|
|
|
Senior Member Group: Members Posts: 1465 Joined: 9-February 04 From: Columbus OH USA Member No.: 13 |
FWIW, the high temperature for the last few sols has been flirting with or above freezing:
Temperature/pressure plot -------------------- |
|
|
|
|
Sep 12 2014, 02:57 AM
Post
#123
|
|
|
Senior Member Group: Members Posts: 1043 Joined: 17-February 09 Member No.: 4605 |
Those anomalous dips in both max and min temperatures for periods around around sol 292 and sol 500 have got to draw attention. MSL was stationary over the period sol 494 to 503 and so there should be no external or movement related reason for that drop. The correlation between max and min deviations is pretty loose. Is this sensor unreliability or something else? The temptation is of course to ignore these outliers and admire the smoothly plotted curves but we learned a bitter lesson on that approach with respect to the Antarctic ozone layer attenuation.
|
|
|
|
|
Sep 12 2014, 03:29 AM
Post
#124
|
|
|
Merciless Robot Group: Admin Posts: 8783 Joined: 8-December 05 From: Los Angeles Member No.: 602 |
The data could've been corrupted in a variety of ways aloft or on the ground. I'd say it's safe to ignore the extreme outliers.
I wonder what the actual ground temperatures are since the meteorological instrumentation is a meter or more above that. Seem to recall reading that temps right at the surface might be some ridiculously disparate number like 50 deg F or so greater than that of the air in the daytime. -------------------- A few will take this knowledge and use this power of a dream realized as a force for change, an impetus for further discovery to make less ancient dreams real.
|
|
|
|
|
Sep 12 2014, 05:23 AM
Post
#125
|
|
|
Member Group: Members Posts: 202 Joined: 9-September 08 Member No.: 4334 |
QUOTE (jmknapp @ Sep 12 2014, 03:27 AM)  The difference between the daily high and low temperatures is huge! Looks like almost 80 degrees Celsius difference... (And why does the air pressure vary so much over the seasons? Is that because of CO2 freezing out of the atmosphere onto the polar cap in winter?) |
|
|
|
|
Sep 12 2014, 09:25 AM
Post
#126
|
|
|
Senior Member Group: Members Posts: 2346 Joined: 7-December 12 Member No.: 6780 |
QUOTE (nprev @ Sep 12 2014, 05:29 AM) I wonder what the actual ground temperatures are since the meteorological instrumentation is a meter or more above that. Besides air temperature sensors, REMS also has three thermopiles for remote measurement of the ground temperature. But just thermopile A returns data with a reasonable noise level (as far as I've seen). Data of thermopiles B and C haven't been cleaned of all systematic measurement errors. But they've made good progress with the calibration of the thermopile A data. Warm-up, shadowing, and maybe other effects needed to be considered. Since one of the two booms has been damaged, there isn't as much redundancy left as originally planned. See the posts about PDS REMS data, starting here. QUOTE (Vultur @ Sep 12 2014, 07:23 AM) And why does the air pressure vary so much over the seasons? Is that because of CO2 freezing out of the atmosphere onto the polar cap in winter? Yes, mainly. Overview, detailed. Maybe, some regional or local effect is superposed. |
|
|
|
|
Sep 12 2014, 09:31 AM
Post
#127
|
|
|
Senior Member Group: Members Posts: 1465 Joined: 9-February 04 From: Columbus OH USA Member No.: 13 |
The link to ground temperature on that page will show plots from the first 180 sols. Looking at sol 170, the high air temp was about 6°C while the high ground temp (brightness temp) was 0°C. That's interesting. I suppose on Earth it's the same--on a hot day the ground will be cooler. Maybe it's a factor of how brightness temperature is defined though, or a calibration issue. I need to get updated PDS data on that page for sols in the winter. Maybe it's only on cold days that the ground temp is far above the air temp?
The extreme outliers are easy to dismiss as anomalous (although current Mars weather would become infinitely more interesting if they were real) but I find the smaller blips more intriguing. Like at around sol 680, did the high temperature really drop around 10-15°C for a week or so? Ten degrees here, ten degrees there, pretty soon you're talking real weather. -------------------- |
|
|
|
|
Sep 12 2014, 09:47 AM
Post
#128
|
|
|
Senior Member Group: Members Posts: 2346 Joined: 7-December 12 Member No.: 6780 |
Near the boundary of high- and low-thermal-inertia, e.g. rock and sand, a change in the wind direction may easily change the air temperature. Same near shadows or inclined terrain with varying sun exposure. Another effect may be the relation between RTG and wind. Or changes in voltage during arm, camera, or SAM activities, which may affect REMS data. Data for low temperatures tend to be noisier than data for higher temperatures.
Proper interpretation of the data and modeling won't be easy. |
|
|
|
|
Sep 12 2014, 10:15 AM
Post
#129
|
|
|
Senior Member Group: Members Posts: 1465 Joined: 9-February 04 From: Columbus OH USA Member No.: 13 |
Ah, those are good points. Around sol 678 here's the position of the rover:
http://curiosityrover.com/tracking/drivetr...hp?drivenum=209 ...in a sandy depression. So maybe it's less weather and more finding a cool spot, so to speak. -------------------- |
|
|
|
|
Sep 17 2014, 12:15 PM
Post
#130
|
||
|
Senior Member Group: Members Posts: 1465 Joined: 9-February 04 From: Columbus OH USA Member No.: 13 |
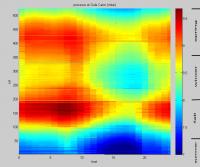
Pressure throughout the day over the first ~540 sols:
That's not quite a full Mars year, but all that's in the PDS so far. The seasons are for the northern hemisphere. -------------------- |
|
|
|
|
|
|
Sep 17 2014, 01:03 PM
Post
#131
|
|
|
Senior Member Group: Members Posts: 2346 Joined: 7-December 12 Member No.: 6780 |
Wow, what a lot of work, scanning through all these files!
Interesting, that there is a peak in the morning near 8 a.m. Maybe a superposition of harmonics of the diurnal tide. Or might be related to slope winds. |
|
|
|
|
Sep 17 2014, 05:27 PM
Post
#132
|
||
|
Senior Member Group: Members Posts: 1465 Joined: 9-February 04 From: Columbus OH USA Member No.: 13 |
And the peak is higher in the northern hemisphere fall than the spring--consistent with the north polar cap giving up its CO2 and H2O to the atmosphere, more than the south polar cap? On the other hand, MSL is some 60m higher than at the start of the mission, so maybe that accounts for some of the difference.
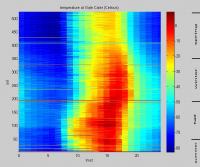
Here's a similar chart for temperature:
-------------------- |
|
|
|
|
|
|
Sep 17 2014, 08:43 PM
Post
#133
|
|
|
Senior Member Group: Members Posts: 2346 Joined: 7-December 12 Member No.: 6780 |
Due to the eccentricity of Mars' orbit around the Sun, and the larger distance in southern winter, we've more CO2 freeze-out in the southern winter than in the northern.
This will account for most of the annual pressure oscillation, and the higher amplitude between southern winter and southerm spring. The pressure difference due to an altitude difference of 60 m should be roughly 0.55%, or 0.05 mbar: According to the barometric formula the decrease of the pressure with height is roughly proportional to the gravitational acceleration, the molar mass of the air, and to the height difference, inversely proportional to the temperature, for small height differences. With a gravitational acceleration of 0.376 g, a molar mass of 12 + 2*16 = 44 for CO2 on Mars and 0.8 * 2 * 14 + 0.2 * 2 * 16 = 28.8 for 80% N2 and 20% O2 on Earth, meaning a factor of 1.53 for Mars relative to Earth, 210 K mean surface temperature for Mars and 288 K for Earth, we get a factor of 1.37 for the inverted temperature of Mars relative to Earth, together 0.376 * 1.53 * 1.37 = 0.788 times the value on Earth for the relative decrease of pressure for the same (small) height difference. Or divide the scale height of Earth (8.5 km) by the scale height of Mars (11.1 km), 8.5 / 11.1 = 0.766 as a cross-check. The atmospheric pressure on Earth on sea level varies 1.2 kPa for every 100 m, meaning 1.2 kPa / 101.32 kPa = 1.18%, hence for Mars and 60 m height difference 1.18% * 0.60 * 0.78 = 0.55%. 0.55% of 8.5 mbar are about 0.047 mbar. That's about one color step in your graphics. |
|
|
|
|
Sep 17 2014, 10:03 PM
Post
#134
|
|
|
Senior Member Group: Members Posts: 3516 Joined: 4-November 05 From: North Wales Member No.: 542 |
QUOTE (Gerald @ Sep 17 2014, 09:43 PM) According to the barometric formula the decrease of the pressure with height is roughly proportional to the gravitational acceleration, the molar mass of the air, and to the height difference, inversely proportional to the temperature, for small height differences. With a gravitational acceleration of 0.376 g, a molar mass of 12 + 2*16 = 44 for CO2 on Mars and 0.8 * 2 * 14 + 0.2 * 2 * 16 = 28.8 for 80% N2 and 20% O2 on Earth, meaning a factor of 1.53 for Mars relative to Earth, 210 K mean surface temperature for Mars and 288 K for Earth, we get a factor of 1.37 for the inverted temperature of Mars relative to Earth, together 0.376 * 1.53 * 1.37 = 0.788 times the value on Earth for the relative decrease of pressure for the same (small) height difference. Or divide the scale height of Earth (8.5 km) by the scale height of Mars (11.1 km), 8.5 / 11.1 = 0.766 as a cross-check. This takes me back. One of the first things I posted here was this hand drawn diagram comparing four atmospheres. (The topic didn't catch on - it's a one post thread!) QUOTE (ngunn @ May 22 2006, 03:53 PM) Thought I'd try starting a new place for this as our discussions on the subject so far have been popping up all over the place. I find them hard to locate afterwards, and it must be even worse for newcomers trying to follow the topic.
To kick off here is the diagram I use for comparing the atmospheres of Titan and the terrestrial planets: http://www.unmannedspaceflight.com/index.p...ost&id=5799 |
|
|
|
|
Sep 21 2014, 05:36 AM
Post
#135
|
|
|
Member Group: Members Posts: 202 Joined: 9-September 08 Member No.: 4334 |
|
|
|
|
|

|
Lo-Fi Version | Time is now: 18th April 2024 - 05:40 AM |
|
RULES AND GUIDELINES Please read the Forum Rules and Guidelines before posting. IMAGE COPYRIGHT |
OPINIONS AND MODERATION Opinions expressed on UnmannedSpaceflight.com are those of the individual posters and do not necessarily reflect the opinions of UnmannedSpaceflight.com or The Planetary Society. The all-volunteer UnmannedSpaceflight.com moderation team is wholly independent of The Planetary Society. The Planetary Society has no influence over decisions made by the UnmannedSpaceflight.com moderators. |
SUPPORT THE FORUM Unmannedspaceflight.com is funded by the Planetary Society. Please consider supporting our work and many other projects by donating to the Society or becoming a member. |
|