Printable Version of Topic
Click here to view this topic in its original format
Unmanned Spaceflight.com _ MSL _ MSL statistics
Posted by: dilo Sep 6 2012, 05:37 PM
After first month on Mars, I think it's time to start a topic similar to MER one...
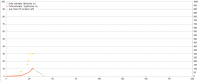
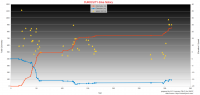
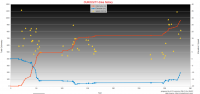
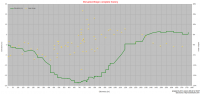
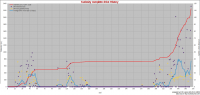
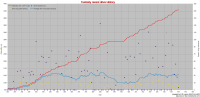
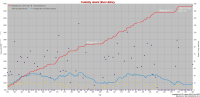
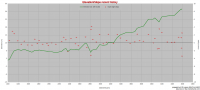
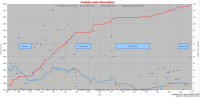
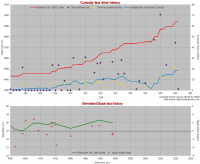
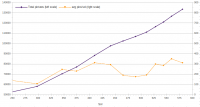
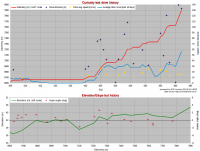
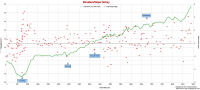
First odometry plot to start:
|
Posted by: climber Sep 10 2012, 08:42 PM
Thank you dilo! I was about to send you a PM to know when we'll opened up this topic 
As Curiosity jumped one step (from nil to n°8 position), I put this uptade in MSL's.
I also changed the second title from "from landing base" to "from landing place" since the term was no longer the right one.
I have no means where I am to check Oppy's distance to the landing place but I guess she get closer to Eagle since sol 2654 instead of further. If I'm wrong I'll correct it later unless someone give me the info. Thanks.
Actual total odometry
1. Lunokhod 2 37.00 km
2. Apollo 17 rover 35.89 km
3. Opportunity (3056) 35.02 km
4. Apollo 15 rover 27.76 km
5. Apollo 16 rover 26.55 km
6. Lunokhod 1 10.50 km
7. Spirit 7.73 km
8. Curiosity (29) 0.11 km
9. Sojourner 0.085 km
Actual maximum distance from landing place
1. Opportunity (2743) 19.48 km
2. Lunokhod 2 14.39 km
3. Apollo 17 rover 7.2 km
4. Apollo 15 rover 5.0 km
5. Apollo 16 rover 4.6 km
6. Spirit 3.62 km
7. Lunokhod 1 2.26 km
8. Curiosity (29) 0.08 km
9. Sojourner 0.01 km
Posted by: dilo Sep 10 2012, 09:03 PM

Corrected, thanks!
About Oppy maximum distance from landing point, using Theseiner map on Google Earth I found 19.48 km on Sol2703 (Chester lake).
Posted by: climber Sep 11 2012, 01:25 AM
About Oppy maximum distance from landing point, using Theseiner map on Google Earth I found 19.48 km on Sol2703 (Chester lake).
Thanks, also corrected
Posted by: dilo Sep 29 2012, 05:16 AM
Cannot wait the end of the month...
|
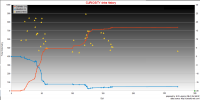
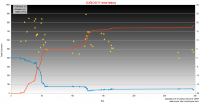
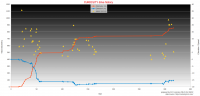
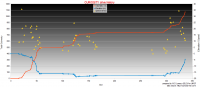
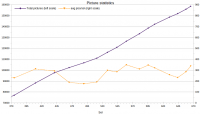
2nd plot on picture statistics is based on figures reported on top of MSL "row images" pages and should include also thumbnails...
Posted by: dilo Oct 30 2012, 08:59 AM
Update:
|
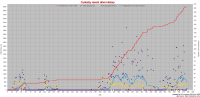
Posted by: dilo Nov 29 2012, 04:32 PM
Update:
|
Posted by: dilo Dec 26 2012, 08:56 AM
Update:
|
Posted by: dilo Jan 20 2013, 09:59 AM
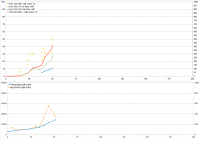
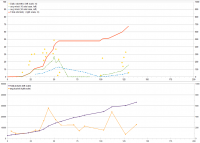
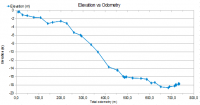
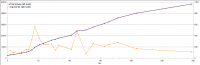
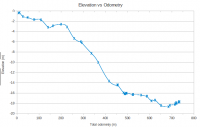
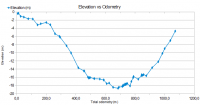
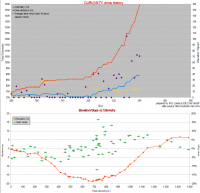
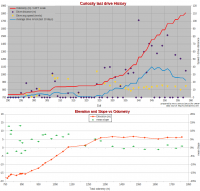
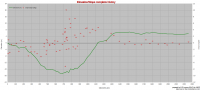
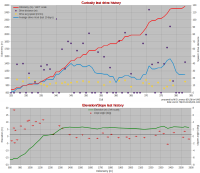
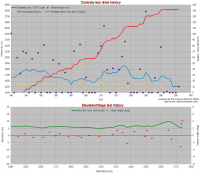
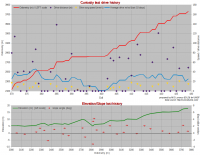
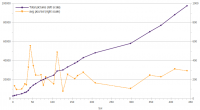
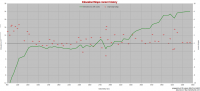
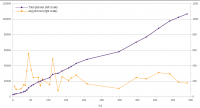
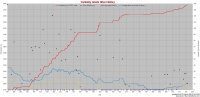
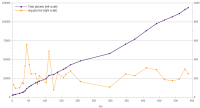
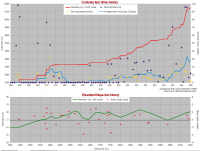
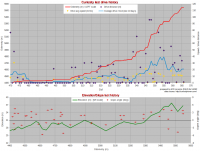
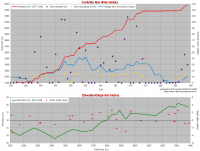
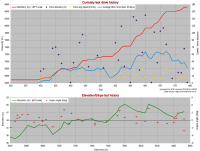
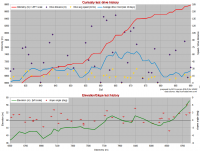
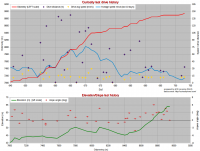
This time I used the "drive log" in the http://curiositymsl.com/ for a new plot containing also elevation (referred to Bradbury station) and "instant" speed (actually, average speed during each single drive):
|
UPDATE on Jan,25: I added last drive (#42)
LAST UPDATE on Feb,24
Posted by: jmknapp Jan 21 2013, 06:21 PM
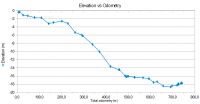
It's tempting to think of the descent as going down a series of terraces.
Posted by: djellison Jan 21 2013, 06:23 PM
Of course - that's a plot against time, not distance. But I think we would see a stair-step entering the Yellowknife Bay area.
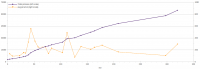
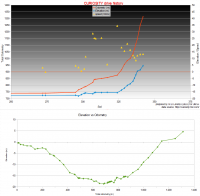
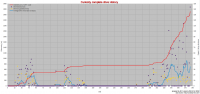
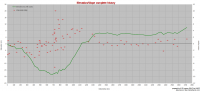
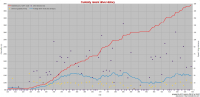
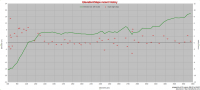
Posted by: dilo Jan 22 2013, 09:43 PM
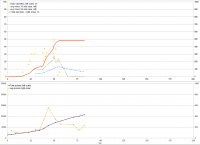
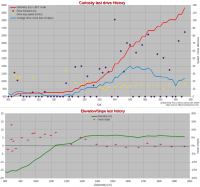
This plot confirms Doug's words:
|
PS: Further update on the odometry plot above highlight drive transitions.
Posted by: PaulH51 Feb 4 2013, 12:38 PM
Hi all,
I have searched through this thread as well as the internet and can not locate any statistics from the REMs weather station package on the MSL rover. I use the marsweatherdotcom page but this only provides selected information (max / min etc). If anyone knows where I can find the detailed archives or the site where I can see a wider range of raw data I would be eternally grateful.
TIA, Paul
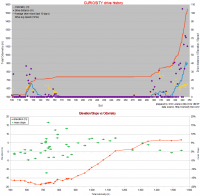
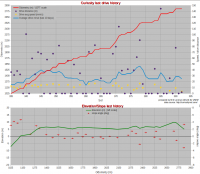
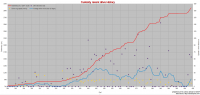
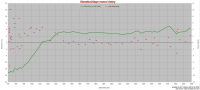
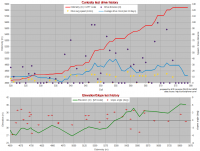
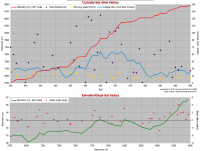
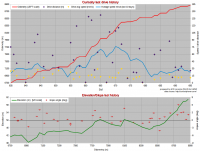
Posted by: dilo Feb 23 2013, 09:23 PM
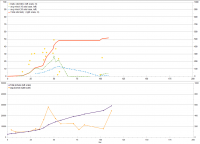
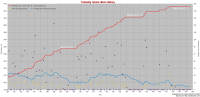
New Odometry/pictures plots, based solely on JPL-MSL press release info:
|
In the meantime, I noticed Odometry fugures in the http://curiosityrover.com/tracking/drivelog.html were retouched (-1%) and now they are consistent with cumulative drive distance; perhaps, original NAIF data files were somehow refined (see updated plot http://www.unmannedspaceflight.com/index.php?showtopic=7457&view=findpost&p=197064)
Posted by: jmknapp Feb 25 2013, 09:16 PM
Yes, I fixed the drive log page so there's no longer a discrepancy between the odometer reading and the sum of the individual drives.
One thing that's kind of interesting philosophically though is how to exactly measure distance in the first place. The actual path of a point on the rover (say, the MSL_ROVER frame origin) in the "real world" can be quite complicated, akin to a fractal on smaller and smaller scales. For instance, say the whole vehicle is vibrating--intuitively we wouldn't want to count that toward an odometer reading, but it is moving!
My code samples the rover position as given in the NAIF data every second. I take the x,y and z coordinates of the rover and get the distance from the prior sample. Sampling at different intervals could well give different results, although probably not too different, particularly with somewhat idealized NAIF data.
Posted by: dilo Feb 28 2013, 05:01 PM
Thanks for explaination, Joe (your log is fantastic!  ).
).
I suspected that difference was due to wheels slippage, now I understand real cause is another...
Posted by: dilo May 13 2013, 08:14 PM
New, long awaited update with Sol272 drive:
|
Posted by: dilo Jun 7 2013, 07:35 AM
Updated to drive 46 (Sol297), and waiting for the next "big jump" :
|
Added: elevation and picture statistic updated too:
|
|
Posted by: dilo Jun 14 2013, 05:55 PM
Changed scales:
|
Edit: last update on drive#53, Sol 313
Posted by: dilo Jun 18 2013, 04:55 PM
Looking to plot above, during drive #50 MSL established the highest average speed after initial, unsurpassed record on drive #2 (Sol21): almost 2.9 cm/s. Looking to http://curiosityrover.com/tracking/speedplot.php?drivenum=50, this is due to almost continuous drive at "cruise" speed around 3.5 cm/s... Curiosity is definitively heating her wheels! 
Edit: note also three consecutive "high speed" drives (aboout 1 inch/sec) after mentioned drive #50.
Posted by: dilo Jul 1 2013, 05:16 AM
New month, new plots:
|
|
|
Posted by: dilo Jul 7 2013, 08:32 AM
Update:
|
Drive #55 established a new speed record, 34.5mm/s, slightly below the absolute record of Sol21 (35.8 mm/s) and, for sure, the http://curiosityrover.com/tracking/speedplot.php?drivenum=55! If we imagine for a moment she can hold such a speed for a 1.5 hours "long drive" (like the ones done in Sol 120 or 297), this would bring almost 200m in a sol, close to Opportunity drive record...
Edit: Plot updated to Sol 331 / drive #58
Posted by: dilo Jul 17 2013, 05:55 PM
last important drives deserves a new post:
|
|
Posted by: dilo Jul 25 2013, 05:04 PM
New plots with new scales (zooming on last progresses):
|
Updated to Sol343/drive#66
Posted by: fredk Jul 25 2013, 05:16 PM
That shows us about 5m higher than at landing, our highest point yet. Promising for views.
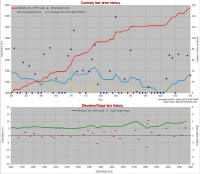
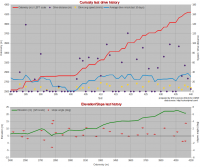
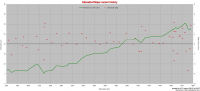
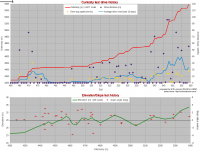
Posted by: dilo Jul 26 2013, 06:33 AM
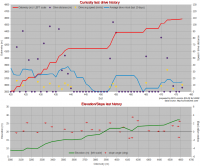
Yes, fredk; in the following plots I also added last 10 Sol average distance (similar to MER stat plot) and average slope in each drive (bottom plot):
|
(updated to Sol345 / drive #68)
Posted by: dilo Jul 30 2013, 07:01 AM
Update with a longer time baseline:
|
Interestingly, average speed in last "long" drives tends to steady increase from 12 to 15 mm/sec...
(updated to Sol347 / drive #69
Posted by: dilo Aug 2 2013, 10:54 AM
Update with zoom on last drives:
|
With last huge drive (#71, 85m) Curiosity is now at her farthest point from Bradbury landing station: 481m (203° azimut), compared to previous 444m record (sol 125)!
Elevation is slightly decreasing (negative slope in last two drives) and average speed is quite stable, both within each drive both on a 10 sol base...
Posted by: dilo Aug 5 2013, 02:59 PM
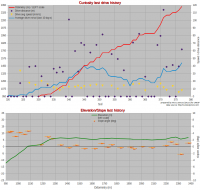
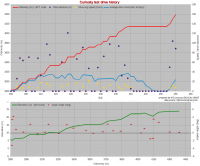
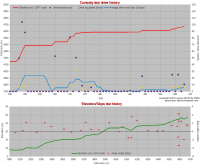
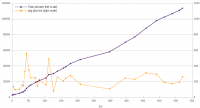
Landing anniversary deserves full history plots:
|
|
Updated to drive #72 (Sol 354)
Posted by: dilo Aug 8 2013, 11:39 AM
Update based on new drive-log data by Joe:
|
Edit: Updated to Sol 358
Posted by: CosmicRocker Aug 9 2013, 04:40 AM
Very nice. Thanks for these statistical updates, Marco.
Posted by: jmknapp Aug 10 2013, 09:52 AM
I like the running average of the per-sol distance, to answer the are-we-there-yet question, i.e., 8 km, 40 m/sol = 200 days to go.
Posted by: dilo Aug 12 2013, 03:39 PM
Thanks to Joe and CosmicRocker for appreciations!
|
Edit: Update to Sol 363:
Posted by: RoverDriver Aug 12 2013, 03:49 PM
Marco, I'm confused about how you compute average speed and average slope. Regarding speed, there's really only one speed: slow ;-) The effective speed depends by what driving mode we use, some of which take 3D images and do on-board processing which takes time. But my question is, how do you know when the drive starts and when the drive ends? Is this data published? Secondly, I'm confused how you compute the average slope, how can it be negative? Is this the difference in elevation divided by the odometry?
Paolo
Posted by: dilo Aug 15 2013, 09:34 AM
Paolo, scusa/sorry for late reply but I was out for vacation...
I based my calculation on the data reported in Joe's http://www.curiosityrover.com/tracking/drivelog.html, which is extracting data from NAIF web site (he can explain better!). I simply divide total distance by drive duration (2nd and 3dh columns) and this is an average within the drive; however, Joe reports also instant speed/elevation plots (see last column).
Exact, due to moderate slopes I assumed this figure (which can be negative if elevation decreases); I am considering to report slope angle in the next plots... Obviously, elevation is referred to Bradbury station.
Posted by: jmknapp Aug 15 2013, 11:59 AM
I guess it's kind of a loose definition, since the rover speed apparently tends to be binary--zero or "full," where full is lately about 3.5 cm/sec, in the past sometimes a little over 2.5 cm/sec, which appears to be a bit of english units behind the curtain (1 inch/sec)!
But when it's going it often proceeds in something like one-minute bursts with briefer pauses in between, with longer pauses (maybe 8 minutes) at intervals. For example, the http://curiosityrover.com/tracking/speedplot.php?drivenum=75. Seems to me that it's useful to group all those bursts into one "drive" even though it's discontinuous. What my code does is consider any movements separated by less than 15 minutes of stop time as part of the same drive. To date, that algorithm hasn't split any sol's driving into more than one drive. That makes sense because they probably don't command more than one drive sequence per sol.
The drive time then is the time of last movement minus the time of first movement. Dividing the total distance traveled by the drive time gives an average speed of sorts, but the result may have more to do with the drive mode (visodom, etc.) than the literal speed of the rover.
Posted by: RoverDriver Aug 15 2013, 02:51 PM
Understood. The 8 min pause between some steps is the DAN / RHAZ observation. It is interspersed during the drive. I did not know that the drive details were published! Yes the wheels ether are off or full speed.
Paolo
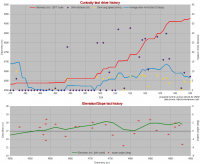
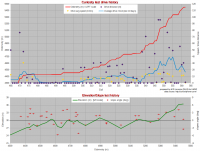
Posted by: dilo Aug 20 2013, 04:17 PM
New Update.
Now lower plot reports slope angle in degree (right scale):
|
Edit: updated to Sol 370
Posted by: dilo Aug 22 2013, 08:24 PM
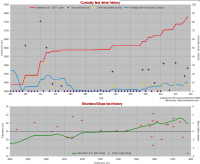
The new drive record (116m on Sol 371) deserves updated total-odometry plots!
|
|
Posted by: dilo Aug 26 2013, 05:06 AM
Plots of last odometry:
|
(updated to Sol 377 - Aug,28)
Posted by: dilo Aug 28 2013, 12:39 PM
After an "hot" summer of almost continuous roving, it's time for a resume:
in the last 6 weeks, MSL moved with an average speed of almost 33m/Sol (odometry increased by 1.34 km in 41 Sols); in this timeframe, Curiosity didn't move for 18 Sol (44% of total) while in "drive Sols" she always covered more than 25 m (58m on average). These figures are impressive if compared to first part of mission, when she covered less than 3m/Sol on average...
Going to real shift, in the following picture one can see that MSL is now 1080m from "starting point" (Sol 335/336 position), so the "effective" shift was 81% of odometry due to deviations from stright line.
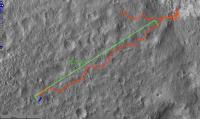
|
Looking to http://mars.jpl.nasa.gov/msl/images/PIA17355_RTRmap_Sol-376-br2.jpg published yesterday, we are now 6.5 km from "entry point" at the base of Aeolis; the "rapid transit route" in the JPL image is 7.2 km long while, if we assume the previous degree of non-linearity in the path, this brings to almost 8km of additional odometry. Assuming same average velocity of last drives, this means 220-240 days to Mount Sharp; obviously, I didn't consider longer stops for geology (in particular the 5 "geology waypoints" anticipated in the article) but this delay could be compensated by the new autonomous driving software potentialities... let's see!
Posted by: dilo Aug 29 2013, 10:11 PM
Updated (more readable) plots:
|
Last update: Sol 383
Posted by: dilo Sep 6 2013, 05:57 AM
New impressive drive record on Sol 385 deserves updated historic plots!
|
|
Posted by: fredk Sep 6 2013, 06:16 PM
We're now at our highest elevation yet, sitting near the top of a small hill as you can see from Phil's map. I hope we get some horizon imagery from here...
Posted by: ngunn Sep 6 2013, 08:46 PM
I was thinking the same thing. Looking at the route of that drive on Phil's map made me think of exploring on foot. "Let's head for the top of that little rise and see what we can see."
Posted by: dilo Sep 9 2013, 05:41 AM
Update (Sol 392):
|
Posted by: dilo Sep 18 2013, 01:34 PM
Post-Waypoint1 update (Sol 396):
|
Posted by: dilo Sep 23 2013, 08:54 PM
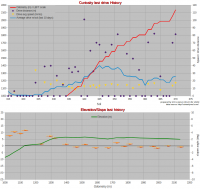
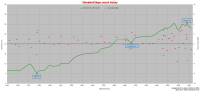
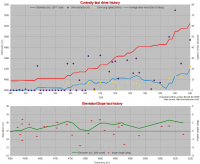
Update with wider timeframe (starting from Glenelg depart):
|
|
Last update: Sol 404
Posted by: RoverDriver Sep 23 2013, 11:14 PM
Has anyone added up the odometry of all rovers (Sojourner, Spirit, Opportunity and Curiosity)?
Posted by: djellison Sep 24 2013, 12:31 AM
100 + 7,730 + 38,340 + 2,852 = 49,022
50km here we come
D
Posted by: climber Sep 24 2013, 10:39 AM
and I find 142 kms on the Moon once Lunakhod distances have been revised (42 and 9,93). Well, this will improve by year end, eventually.
Posted by: dilo Sep 27 2013, 08:50 PM
Update Sol 410:
|
Edit: on Sol 410, new positive elevation milestone above Bradbury station (+10.26 m)!
Posted by: dilo Oct 4 2013, 09:54 AM
Update Sol 429:
|
Note1: total Odometry doubled (from 1 to 2 miles) in last 2 months!
Note2: on Sol 413, new elevation record +12.8 m above Bradbury station!
Note3: on Sol 417, another elevation record +14.2 m (during 100th drive!)
Note4: on Sol419, 2nd longest drive distance (125.8m!)
Note5: on Sol426, new elevation record +17.5 m above Bradbury station!
Note6: on Oct,19 last 6 drive distances were corrected based on new drive log...
Posted by: dilo Oct 16 2013, 11:57 AM
Medium-term plots (last update on Sol 429) :
|
|
Note : in the next week, I will frequently update both short-term plots (previous post) and medium-term plots...
Posted by: dilo Oct 25 2013, 08:01 PM
Short-term plots (last update on Sol 440) :
|
Note1: on Sol433, elevation above landing point reached +22 m!
Note2: on Sol436, odometry surpassed 4 km milestone!
Note3: Sol436-39, 4 consecutive drive sols!
Posted by: Harder Oct 25 2013, 10:16 PM
Since sol 402 the graph moves up in a straight line, about 30 m/sol. Can anybody comment on this average? Emily mentions in her blog that there is pressure to drive, drive, drive, but I also remember NASA's own Curiosity brochure that mentions "On average, Curiosity is expected to travel 200 m per driving day, depending on power levels, slippage, steepness of terrain, visibility.."
After more than 400 sols of building up experience with terrain, auto-nav etc. it may be possible to review this - on the face of it - 7-fold difference between "design" and "actual". Until then, every day I open the stats and the maps messages in UMSF I'm hoping to see this 200 m mark..
Posted by: Explorer1 Oct 25 2013, 10:30 PM
The terrain is just too rough for now; they can't see far enough to plan things out, no matter the autonav. If this was Meridiani, then sure, but it's not, at least until they get closer to the dunes, see how much better that corridor is.
Posted by: djellison Oct 25 2013, 11:39 PM
Look more closely at that graph - there are many days in that graph that are not drive days. The last 10 drives have averaged more than 70 meters each. ( thank you http://curiositylog.com/ )
That brochure should be considered...a brochure. It's not an engineering analysis, it's not a peer reviewed paper in an engineering journal - it's just...a shiny brochure.
200M represents a round number near the upper limit of what Curiosity may eventually reach given full deployment of Autonav, smoother terrain with better visibility etc etc.
We may not see 200M in a sol - but in a perfect scenario we might.
Posted by: dilo Nov 1 2013, 06:36 AM
New medium-term Odometry/Elevation plots (last 4 months):
|
|
|
(last update: Nov,02 - Sol 440)
Note: added also integral picture statistics
Posted by: dilo Nov 15 2013, 02:46 PM
New short-term plots after Waypoint 2 break:
|
(last update: Nov,17 - Sol 455)
Posted by: dilo Nov 27 2013, 11:16 AM
New medium-term Odometry/Elevation plots, with annotated stops:
|
|
(last update: Nov,26 - Sol 465)
Posted by: dilo Dec 2 2013, 09:28 PM
New short-term Odometry/Elevation plots:
|
(last update: Dec,09 - Sol 477)
Note: The drive #118 (Sol 472) was the third fastest drive (32.3 mm/s) and the longest one with average speed above 3 cm/s! (look to the instantaneous speed http://curiosityrover.com/tracking/speedplot.php?drivenum=118 to understand why...)
Posted by: dilo Dec 22 2013, 09:46 AM
Monthly odometry/elevation/picture plots (up to Sol 488 / Dec, 21):
|
|
|
Posted by: dilo Dec 30 2013, 04:07 PM
Short-term update (up to Sol 508 / Jan, 09):
|
Posted by: dilo Jan 13 2014, 09:32 PM
Short-term update (up to Sol 519 / Jan, 21):
|
(changed vertical scale)
Posted by: dilo Jan 23 2014, 09:42 PM
Medium term update (up to Sol 521 / Jan, 23):
|
|
|
(after more than 1.5 months, we are now back above 10 m/Sol average...)
Posted by: dilo Jan 26 2014, 11:00 PM
Short term update (up to Sol 535 / Feb,6):
|
(changed vertical scales again)
Posted by: dilo Feb 10 2014, 11:19 AM
Now that Curiosity is leaving Dingo Gap, here below the updated medium term plots, with indication of main stops (up to Sol 538 / Feb,9):
|
|
|
(I know that WP-3 wasn't really explored, is only to have an indicative position)
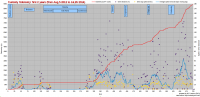
Posted by: dilo Feb 12 2014, 08:52 PM
Short term update (up to Sol 545 / Feb,16):
|
Great drive on Sol540, surpassing 5 km milestone!
Posted by: dilo Feb 18 2014, 06:46 PM
New short-term update based on new, http://www.unmannedspaceflight.com/index.php?showtopic=7442&view=findpost&p=207641 Odometry by Joe:
|
At this point, the 5 km milestone is still to reach...
Posted by: Gerald Feb 19 2014, 12:48 AM
There is certainly some space for interpretation about the driven distance. The https://twitter.com/MarsCuriosity/status/434059801278951424/photo/1 seems to be, that the 5 km mark has been passed.
There is always some difference between "http://en.wikipedia.org/wiki/Ground_speed" and http://en.wikipedia.org/wiki/Wheel_speed_sensor.
Posted by: PaulH51 Feb 19 2014, 03:50 AM
Joe was correctly reporting in excess of 5km but when he aligned his traverse map the odometer was adjusted to the figures Dilo published. Joe is working on this resolving this issue, refer to his post from yesterday http://www.unmannedspaceflight.com/index.php?showtopic=7442&view=findpost&p=207641
Posted by: dilo Feb 19 2014, 05:04 PM
Another great drive on Sol 546, the longest in last 3 months:
|
Edit1: changed time interval to 100 days in order to show previous drive record...
Edit2: finally we are back to more than 30m/Sol on a 20-Sol base!
Posted by: dilo Feb 25 2014, 03:58 AM
Update to Sol 559/Mar,3:
|
Posted by: dilo Mar 5 2014, 04:33 PM
Update:
|

|
Posted by: dilo Mar 9 2014, 07:02 AM
Update to Sol566/Mar,10
|
Posted by: dilo Mar 13 2014, 06:16 PM
Short-term update to Sol579/Mar,23
|
Posted by: dilo Mar 26 2014, 01:56 PM
Major Odometry update in Joe drive log (+7.5% on the average, higher on last drives) so I updated both short and long-term plots below (picture plot is a bonus...):
|
|
|
Posted by: jmknapp Mar 27 2014, 01:54 AM
Do we have a "ground truth" on the official odometry to date from JPL?
Posted by: jmknapp Mar 27 2014, 09:31 AM
All right, someone tells me that as of sol 581 the odometer reading is 6029.095 meters. The total on my drive log is 6286, about 4% high. That's based on the rover position data at http://naif.jpl.nasa.gov/pub/naif/MSL/misc/icarrasco/ with some fudge factors applied.
Possible sources of error:
1) Not sure how "official" the NAIF data is, whether it has been corrected for wheel slippage, etc.
2) My code samples the rover position given by these files every second and sums up the distance from these short straight-line segments. Since the rover travels only a few cm/s that probably doesn't introduce very much error?
3) When the track as shown on my map deviates significantly from the Phil Stooke or JPL-reported positions, I apply a correction to make it line up better. Maybe that's where the greatest error lies, as it might relate to some warpiness of the HiRISE map, bugs in my mapping code, who knows.
Posted by: PaulH51 Mar 27 2014, 09:53 AM
Not sure if this will help verify the data you received... The last JPL report I can locate is this one http://mars.jpl.nasa.gov/msl/news/whatsnew/index.cfm?FuseAction=ShowNews&NewsID=1605 This report was issued after the sol 546 drive....
Posted by: dilo Apr 1 2014, 03:04 PM
While waiting for eventual further adjustments, this is the update based on current Joe's table:
|
Posted by: mcaplinger Apr 1 2014, 03:55 PM
Are you familiar with the coastline paradox? http://en.wikipedia.org/wiki/Coastline_paradox
There are so many error sources for odometry that it may not be physically meaningful to even discuss the "true" value. Even figuring out where the rover is at any given moment isn't free of ambiguity.
I think you're doing a great job with the data you have.
Posted by: Phil Stooke Apr 1 2014, 04:10 PM
Odometry can also be reported in different ways. If Curiosity makes a 360 degree spin in place its wheels have moved 10 m but the rover hasn't moved at all. Which value do you use?
Phil
Posted by: jmknapp Apr 1 2014, 09:05 PM
Yes! Benoit Mandelbrot's book had a chapter titled "How Long is the Coast of Britain" and the answer was: infinite, if you use a small enough ruler.
It's more important for me to keep the map position more or less right, because when it deviates I definitely start getting emails. And now the rover is poised to travel beyond the bounds of my initial HiRISE map tiles. I'm working to add another set of tiles--hopefully it'll be done before the rover moves much further, now just a couple hundred meters from the edge.
"There be dragons!"
Posted by: jmknapp Apr 1 2014, 11:40 PM
[
The number above from Paolo doesn't include the turns, or visodom updates. For my part I take the position reported by SPICE for "MSL"--here is the call:
spkezr_c("MSL",et,"MSL_TOPO",CORR,"MSL_LANDING_SITE",topostate,<) ;
So that gives the the position of MSL (center of rover frame) in the local topographic coordinates relative to the landing site. The rover frame is centered between the middle wheels so I don't think turns in place would add to the total. This is from the frames file msl.tf:
---------------------------
.-----. .-----. .-----.
| | | | | |
| | | | |
`--|--' `-- Yr `--|--'
`----------o- ^ -----o------'
..-.------- | ------.
RSM || | | |--------.
|| | | |-------.|
RA |`- <-------x | || RTG
| | Xr HGA |-------'|
-o---------|--------|o-| =====-o---------'
| `-------------------'
.----------o---------o------.
.--|--. .--|--. .--|--.
| | | | | |
| | | | | |
`-----' `-----' `-----'
Zr is into the page.
Posted by: fredk Apr 2 2014, 01:37 AM

But the point about resolution-dependence is well taken. Presumably if someone cared enough they could smooth the sampled path on some particular standard length scale and call that the path length.
Posted by: RoverDriver Apr 2 2014, 01:50 AM
The number above from Paolo doesn't include the turns, or visodom updates.
...
The number I gave you *does* include VO updates (nut not turn in place commands).
Paolo
Posted by: jmknapp Apr 2 2014, 09:11 AM
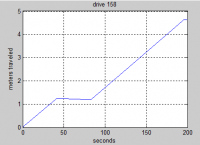
The SPICE data appears to be smoothed piecewise linear--here's the first 200 seconds of a recent drive where the rover speed when moving was about 3 cm/sec:
|
That's asking for the position every 10 msec, so evidently it doesn't get any more fractally than that.
Posted by: mcaplinger Apr 2 2014, 04:03 PM
I don't know how the SPICE location is updated with information from outside the rover system. The rover basically can't know its absolute location in the Mars frame all by itself to good accuracy over a long time scale. The team uses map products that have the current site as the origin, so we never really use the SPICE location for anything in absolute terms as far as I know.
Then there's the question of how well the orbital mosaic was georectified in the first place. All in all, I suspect that putting the location on a map in an automated fashion using just the SPICE would be difficult, if not impossible (but I haven't really tried it, so I can't be sure.)
Posted by: dilo Apr 9 2014, 04:25 PM
New plots (up to Sol 597/Apr11):

|
Posted by: dilo Apr 18 2014, 05:57 AM
Updated plots (up to Sol 609/Apr23):

|
Posted by: dilo May 16 2014, 05:20 PM
Update of long term and short term plots, leaving Kimberley:

|
|

|
update to Sol 637:

|
Posted by: dilo May 27 2014, 04:53 AM
update to Sol 641:

|
Posted by: jmknapp May 29 2014, 11:20 AM
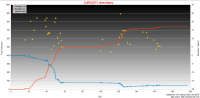
Histogram of CHEMCAM shots by sol:

|
Just for fun, here are some 'heatmaps' of the MR and ML pointing:
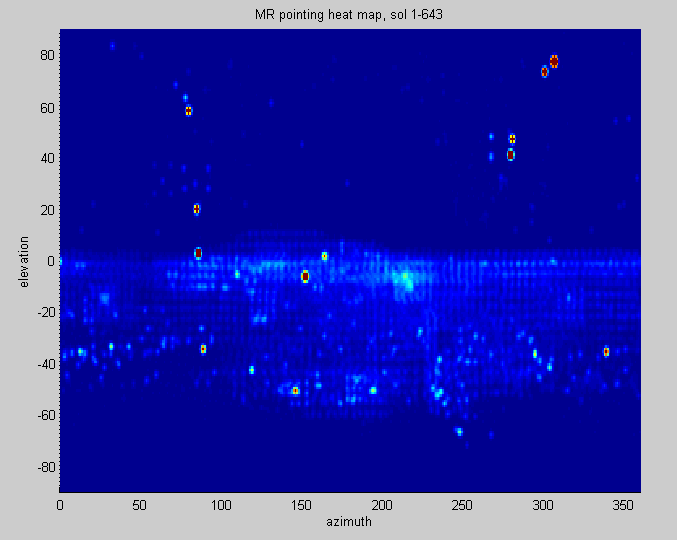
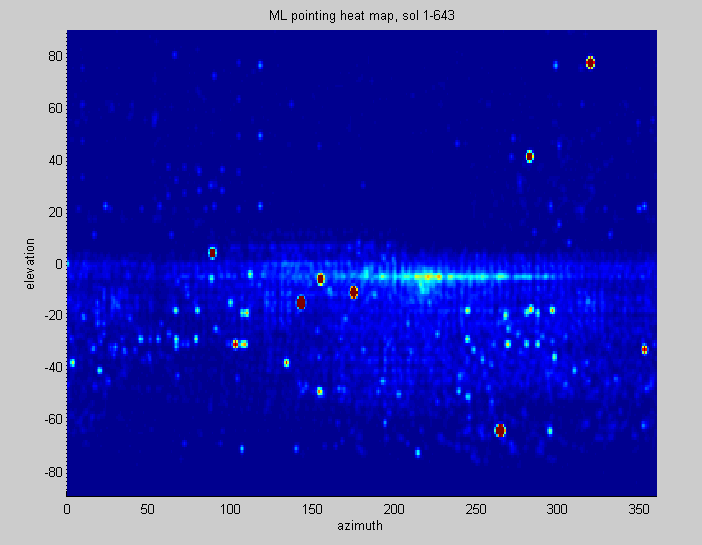
Seems to be a little concentration in the direction of the destination to the southwest. Shots are expectedly mostly at or below the horizon, with a little bump around Mt. Sharp particularly noticeable in the MR map, along with scattered sky shots.
Posted by: fredk May 29 2014, 02:44 PM
Very cool. It does look like drive direction around azimuth 220. I wonder if we can identify some of the "hotspots" - some may correspond to many-frame video imaging, eg sample vibration or moon transits.
What is your "temperature" scale and what is your bin/pixel size? In the MR plot especially, we can see discrete spots on a regular grid - is that your binning/resolution or are we actually seeing typical absolute azimuths for the mosaics?
Posted by: jmknapp May 29 2014, 05:14 PM
The binning is per degree 360x180 so I think the observed steps are real since they're bigger than that. Maybe it has to do with the habit of the mastcams to take panoramas?
I'm not sure what could be said quantitatively about the "temperature." Considering each image data point as an azimuth/elevation pair, a simple plot would be a constellation of points. So to make it a heat map (like they do with http://espn.go.com/blog/statsinfo/post/_/id/20326/michael-pinedas-pinpoint-accuracy) each point is spread out into a little gaussian bump, standard deviation one degree, which allows the temperature at any point in the grid to be summed up with some contribution from neighbors. The height of the gaussian is 1, so if 1000 images were taken with exactly the same pointing, the temperature at the center would be 1000, but if they were in a slightly looser cluster the temperature would be less, depending on the shape of the bump. So it's kind of arbitrary. As you noted, there are many-frame events that really skew the averages. Here's a 3D view of the ML map that has the temperature value clipped at 100:

|
For example, the peak at about azimuth 265, elevation -65 is the imaging of the vibrating scoop on http://www.midnightplanets.com/web/MSL/sol/00074.html.
Posted by: fredk May 29 2014, 06:10 PM
Thanks for clarifying the heat map. What I was imagining was what I'd call a "hit map", where you pixelize the full map (1x1 degree or whatever) and then simply count the number of "hits", ie pointing centres, in each pixel. In that case the final pixel value would have a clear meaning, although you'd still be subject to arbitrariness when a cluster of pointings straddles pixel boundaries.
The regular grid showing up (more obviously in MR) is interesting. I measure a rougly 4.5 degree spacing in azimuth. Looking at some recent mosaic sequences, the pointings are indeed roughly that far apart in azimuth, which is basically set by the field of view. But your plot shows that more is going on: it shows the azimuths tend to lie near discrete absolute values 4.5 degrees apart. Had the left edge (eg) of each sequence been at a random azimuth, the 4.5 deg spacing would tend to average away. So it appears that the left edge is not random, but is chosen to lie near one of a particular set of values (ie near a fixed 4.5 deg spaced set of values).
Posted by: mcaplinger May 29 2014, 07:08 PM
Interesting, but somewhat confused by the fact that many images are of stuff on the rover (all of the cal target images, for example.) I assume you didn't filter these out.
Posted by: fredk May 29 2014, 08:21 PM
On the other hand it might be interesting to transform to coordinates fixed to the rover, and then filter out the frames not looking at the rover. That way you could see what parts of the rover have been most imaged. Of course you could pretty much guess what those parts are. And the moving arm might confuse things as well.
Either way I guess doing that kind of filtering would be more work than it's worth.
Posted by: jmknapp May 29 2014, 11:54 PM
Yep, that's just all the shots regardless of the purpose. Filtering would be tricky & presents a problem of definition--like there are many shots that just incidentally include a bit of the hardware.
Posted by: dilo May 30 2014, 07:57 AM
Beautiful plots, Joe!
Meanwhile, this is the updated odometry:

|
Posted by: jmknapp May 30 2014, 04:09 PM
dilo: you may notice that there was a little glitch in the drive numbering for the last drive. Looks like with the recent SPICE data one of the two miniscule bumps the other day is no longer there, so I'm just leaving it as drive 168 repeated. Luckily these things don't happen very often.
Meanwhile, just again for fun, here's a heatmap of the MR pointing relative to the rover:
|
0 azimuth is straight ahead and elevation is relative to the rover frame as it rests on uneven ground, which makes the pattern overall a little bit wonky. The spot labeled in the center is the imaging of the sundial calibration target. Probably not very much rover imaging with MR due to inability to focus close? That would explain why there are few shots at low elevation looking back. The 3x3 matrix of dots is imaging of the sample inlet which they took anyway even though out of focus.
I'm guessing the the hot spots near 0 azimuth looking down are of the robotic arm imaging.
--edited to fix image per fredk's post below
Posted by: fredk May 30 2014, 05:01 PM
Cool. Is there a chance the coordinates have been reflected? Viewed from mastcam, the sample inlets should be to the lower right of the sundial.
The rover appears as a shadow. There's more imaging in the forward than in the reverse direction just below the (blurred, as you point out) horizon. That shows that we tend to orient facing towards the following drive direction when taking those images.
Posted by: jmknapp May 30 2014, 05:50 PM
I think you're right about the reflection. It makes sense too that the rover would be more 'in the way' looking left than looking right. I fixed the image above.
Posted by: dilo May 31 2014, 04:42 AM
Yes, I noticed and I ignored it in the previous plot.

|
Posted by: dilo Jun 11 2014, 12:45 PM

|
Posted by: dilo Jun 17 2014, 07:45 AM
Great drive on Sol 661, the longest one in last 9 months as showed in the plot below:
|

|

|
Posted by: algorithm Jun 17 2014, 08:18 PM
I wasn't sure where to post this question, so a place with lots of graphs seemed like a good idea.
If curiosity were on Earth it would be possible for it (him/her) to ascertain it's (his/her) position above/below seal level(assuming it had the correct instrument), is the same measurement possible for the rover on Mars?
Has a 'sea level' been calculated?
Does Curiosity have that capability?
Posted by: Phil Stooke Jun 17 2014, 08:46 PM
REMS measures pressure:
http://mars.jpl.nasa.gov/msl/mission/instruments/environsensors/rems/
And an equipotential surface corresponding to 'sea level' is defined for measuring elevations. But I don't think the pressure measurements would be very useful for measuring elevation. They would give a rough idea, but not much more.
Phil
Posted by: dilo Jun 17 2014, 08:57 PM
Does Curiosity have that capability?
It would be great to have a sea or even a small lake! For planets other than Earth, height is normally referred to the average radius. For plots reported in this thread, height refers to Bradbury landing site. In my knowledge, Oppy doesn't have any instrument able to directly measure height (here on Earth we do through altimeter or GPS antenna), so its position is measured indirectly,based on odometry+visual match+height maps from satellite... at least, this is what I know!
PS: another great drive on Sol 662, with record height too:
|
Posted by: dvandorn Jun 18 2014, 01:09 AM
I've seen the Martian equivalent of "sea level" called the "mean elevation" but, more appropriately in a scientific sense, it is called a "zero-elevation datum" and defined as an air pressure of something like 610 Pa, or about 6 mB, which is basically the triple-point that defines the pressure required for liquid water to exist.
Since air pressure does regularly vary on Mars (bi-annually, in fact, as the CO2 sublimates from the thawing spring pole and refreezes at the autumn pole), it's not the best way to define a specific altitude. As Phil mentioned, the best way to do this is to have orbital assets define actual elevation against a concrete mean zero elevation and then use inertial devices (platform plus accelerometers) to keep track of subsequent changes as the rover moves around.
-the other Doug (with my shield, and, after another visit to the hospital and operating room, just resting on it for a while but still not on it for good)
Posted by: algorithm Jun 18 2014, 09:02 PM
As Phil mentioned, the best way to do this is to have orbital assets define actual elevation against a concrete mean zero elevation and then use inertial devices (platform plus accelerometers) to keep track of subsequent changes as the rover moves around.
-the other Doug (with my shield, and, after another visit to the hospital and operating room, just resting on it for a while but still not on it for good)
Doug, best wishes to you and your, slightly bent shield.(Hopefully the nurses gave it a good buffing!)
This..'concrete mean zero'..has it been agreed upon?
Posted by: dilo Jun 19 2014, 05:14 AM
Further update (I am not substituting plots in previous posts because Joe's odometry underwent major revision in last days, you can notice it by comparing total Odometry figures!).
|
Posted by: dilo Jun 20 2014, 06:55 PM
Updated long-term odometry plot after last major revision :

|

|
|
Edit: added/updated to Sol665
Posted by: dilo Jun 24 2014, 07:50 PM
Update:

|
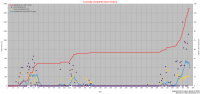
Posted by: dilo Jul 2 2014, 04:50 AM
These integral odometry plots to celebrate recent milestones (1 martian year and landing ellipse overcoming):

|

|

|
Notice that in the last weeks Curiosity average speed (the 20-days moving average) was, by far, the highest one!
Short-term update (Sol 676):

|
Posted by: jmknapp Jul 2 2014, 11:40 AM
I had a feeling that the average speed lately was setting records. If it continues [insert standard disclaimers] we could be at the entrance to Mt. Sharp (always sounds Tolkienesque) in a couple of months.
Posted by: fredk Jul 2 2014, 02:56 PM
Dilo - Cooperstown should be around sol 445, not above 480.
Posted by: dilo Jul 2 2014, 04:46 PM
Just corrected plot. Thx!
Posted by: dilo Jul 2 2014, 05:50 PM
Joe, it would be a nice way to celebrate the second landing anniversary!
Posted by: dilo Jul 3 2014, 03:57 PM
Updated to Sol 679:
|
Posted by: dilo Jul 9 2014, 10:16 PM
Updated to Sol 690:
|
Posted by: dilo Jul 17 2014, 04:25 PM
Updated to Sol 695:
|
Posted by: dilo Jul 22 2014, 07:28 AM
I just discovered a bug in the computation of "last 10 days average speed", it was slightly underestimated.
This is the corrected short-term plot updated to Sol 695:
|
[/quote]
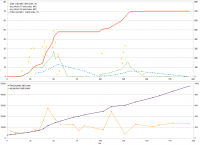
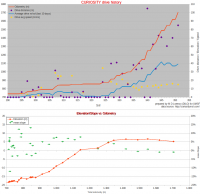
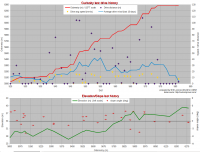
Posted by: dilo Jul 27 2014, 03:05 AM
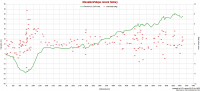
Last two years Odometry and Elevation plots!
|
|
Posted by: dilo Jul 29 2014, 05:47 PM
Short-term update:
|
Powered by Invision Power Board (http://www.invisionboard.com)
© Invision Power Services (http://www.invisionpower.com)