Reprocessing Galileo Io Images |

  |
Reprocessing Galileo Io Images |
 Mar 30 2007, 10:00 PM Mar 30 2007, 10:00 PM
Post
#16
|
||
|
Member  Group: Members Posts: 378 Joined: 21-April 05 From: Portugal Member No.: 347 |
Well, you should start by looking into something that's called the sRGB color space. It's a relationship between wavelengths and two X,Y values. Photoshop has a function to define and convert between colorspaces. The best thing is that you can edit the image in it's native color space. This means that once it's defined and applied, a Violet filter image becomes... well, violet on your screen, so you can balance histograms, keeping all the original data while seeing the correct output.
The "magic" of this is that the data that fall outside of our normal visible screen color space are discarded, so false colors are reduced. The tricky part is to create the Galileo color space. I just find the appropriate XY values from the CIE diagram wavelength line. Some of them (like IR) aren't marked, so there's some guessing involved. So I don't know if its really 100% accurate, but it's better than simples channel mixing if you are missing a Red or Blue filter. For Galileo IR756, G and V my XY values are: gl_IR756 1,00 0,10 gl_g 0,08 0,83 gl_v 0,17 0,01 I've attached the result of this processing to Volcano Pele's image (reduced 50%). The only thing I did after color space conversion was a general histogram manipulation for a general sulfur yellow on the brightest parts as opposed to white.
-------------------- _______________________
www.astrosurf.com/nunes |
|
 |
 
|
|
|
Mar 30 2007, 10:04 PM
Post
#17
|
|
 Senior Member Group: Members Posts: 2530 Joined: 20-April 05 Member No.: 321 |
QUOTE (volcanopele @ Mar 30 2007, 02:48 PM)  Bjorn has a good write-up on how to create "true" color images of Io: http://www.mmedia.is/bjj/3dtest/io/index.html I never really like the results this produces and far prefer my false color images... With places like Venus and Uranus (and above-the-haze Titan), it's just obvious that the more informative images aren't true color. So no one confuses the "informative" presentation of the data with the true color one. With Europa or the Moon, it doesn't much matter which wavelength you pick I guess we can say that Io is in between the extremes: a discrepancy is there, but it's less extreme so that the true color might seem like a plausible option for scientific scrutiny. It seems to me that HST images do a good job of "ground truthing" the true colors. The data set that led to this image could do a decent job of giving us the answers (ie, mapping the Galileo observations onto the "true" colors). At a decent spatial resolution, anyway. |
|
|
|
|
Mar 30 2007, 10:38 PM
Post
#18
|
|
 Administrator Group: Admin Posts: 5172 Joined: 4-August 05 From: Pasadena, CA, USA, Earth Member No.: 454 |
QUOTE (4th rock from the sun @ Mar 30 2007, 03:00 PM) For Galileo IR756, G and V my XY values are: gl_IR756 1,00 0,10 gl_g 0,08 0,83 gl_v 0,17 0,01 Cool. I just played with this and before your histogram fudging, the image does look quite a bit more like Bjorn's versions. One question -- when I tried to set the X and Y values for the red channel to 1 and 0.1 as you specified above, Photoshop told me they couldn't add up to more than 1. (Why not?) Just wanted to check that those were the numbers you meant to write. And another question -- I don't suppose you have X and Y values handy for Cassini IR1/GRN/UV3? Those are 752 nm, 568 nm, and 338 nm...my guess based on the CIE diagram would be something like: IR1 0.95 0.05 GRN 0.45 0.55 UV3 0.18 0 Would you concur? --Emily -------------------- My website - My Patreon - @elakdawalla on Twitter - Please support unmannedspaceflight.com by donating here.
|
|
|
|
|
Mar 30 2007, 10:47 PM
Post
#19
|
|
 Senior Member Group: Moderator Posts: 3231 Joined: 11-February 04 From: Tucson, AZ Member No.: 23 |
Okay, this goes beyond what I know to do in Photoshop. Any pointers on how to make the changes?
-------------------- &@^^!% Jim! I'm a geologist, not a physicist!
The Gish Bar Times - A Blog all about Jupiter's Moon Io |
|
|
|
|
Mar 30 2007, 11:10 PM
Post
#20
|
|
|
Administrator Group: Admin Posts: 5172 Joined: 4-August 05 From: Pasadena, CA, USA, Earth Member No.: 454 |
I'm just barely comprehending it myself, but this is a big help:
 This is a diagram of the CIE color space (it's also got a line on it showing where a black body at various temperatures, in Kelvin, would plot). In Photoshop CS2, which is what I have, to make these changes I go to Edit > Color Settings and then under Working Spaces > RGB I selected Custom RGB. Under Primaries, there are boxes where you can plug in the x and y values listed above. Basically, a color space on your monitor can be described by a mix of three primary colors. The three primary colors that are the default in Photoshop have these values: red .64 .33 green .3 .6 blue .15 .06 You can see where these plot on the CIE diagram above. The only colors you can get on your monitor are the ones that plot inside the triangle defined by those three spots. Here's a much cruddier diagram showing that: 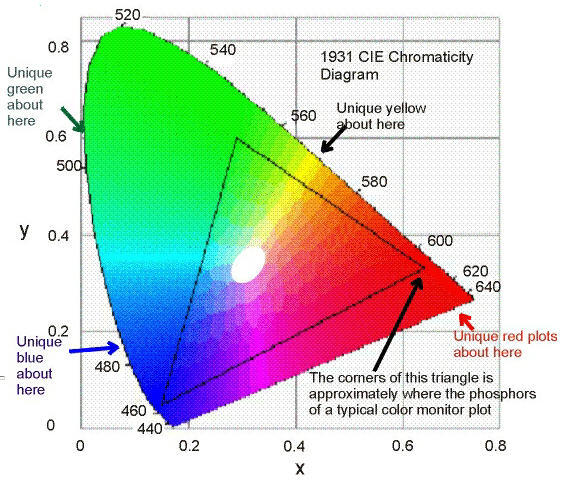 What you're doing by changing the x and y values is to define a new triangle, saying where your three new primaries are on the CIE diagram. (In the case of the infrared channel, it's off the colored-in area; you have to make a guess as to the best spot to pick.) When you convert the image back to sRGB, Photoshop will recalculate the pixel values in the channels to match the sRGB color space. What I'm not at all sure about is that I'm making these conversions between color spaces happen correctly. There are menu commands in Photoshop saying "Edit > Assign Profile" and "Edit > Convert to Profile" but I'm not sure when to change the profile in the color settings, when to assign, and when to convert. I need to download that full-globe image of Io and see if I can make it look yellow with the regular filter combination and more like Bjorn's with this fancy color space manipulation.... EDIT: 4th rock: I just answered my own question on the values for the red channel. Looking at the first CIE diagram, you can see that the color space is asymptotic to a line with slope -1 tracing from corner to corner across the graph. It appears you can't have points plotting above that line, or in other words the X and Y coordinates must add to less than 1. I'm still not sure why that is, but it seems you have to pick a point below that line. --Emily -------------------- My website - My Patreon - @elakdawalla on Twitter - Please support unmannedspaceflight.com by donating here.
|
|
|
|
|
Mar 30 2007, 11:10 PM
Post
#21
|
|
|
Founder Group: Chairman Posts: 14431 Joined: 8-February 04 Member No.: 1 |
 Edit > Convert to Profile > Custom RGB... what Emily said  I've only just discovered that....I'm thinking it might be a better way to do home-grown L257 to true-ish-colour conversions for MER data than channel mixer..hmmm.... BJORN....HELP
|
|
|
|
|
Mar 30 2007, 11:24 PM
Post
#22
|
|
|
Administrator Group: Admin Posts: 5172 Joined: 4-August 05 From: Pasadena, CA, USA, Earth Member No.: 454 |
Can I just comment on how great UMSF is? Where else could I be in an instant conversation with a few of the only other people in the world who actually care about this stuff?
--Emily -------------------- My website - My Patreon - @elakdawalla on Twitter - Please support unmannedspaceflight.com by donating here.
|
|
|
|
|
Mar 30 2007, 11:29 PM
Post
#23
|
|
 Senior Member Group: Members Posts: 3648 Joined: 1-October 05 From: Croatia Member No.: 523 |
This is certainly an interesting way to do color, might try that myself. As for x+y being >1, that might be a problem with extreme filters such as IR756 or Cassini's UV filters where their intrinsic "color" can't be fit into the sRGB colorspace. Whether this method would work then I don't know, I'm guessing there would be problems with any filter that has a substantial amount of spectral transmittance outside the visible wavelength range that's integrated through the CIE XYZ matching functions.
I'll try running Cassini IR1, RED, GRN, BL1 and UV3 filter response curves through my VIMS code tomorrow to see if I can get "empirical" values for X and Y. I'm intrigued about the way color composites will turn out this way. RED, GRN, BL1 and IR1 seem to be pretty well contained inside the 400-800 nm window important for CIE XYZ functions. UV3 is a little iffy, running straight from 300 to 400 nm, but it might be okay too. -------------------- |
|
|
|
|
Mar 31 2007, 01:04 PM
Post
#24
|
|||||
|
Senior Member Group: Members Posts: 3648 Joined: 1-October 05 From: Croatia Member No.: 523 |
OK, this probably warrants another thread since it's running a bit off-topic.
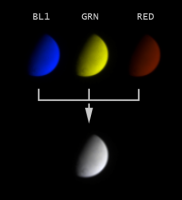
Here are the results I got for Cassini's often used narrow-angle filters when I ran their transmittance curves through my color matching code: CODE X Y ---------------- RED 0.627 0.373 GRN 0.435 0.539 BL1 0.135 0.065 IR1 0.731 0.268 UV3 0.171 0.009 This is not necessarily correct and it assumes the D65 whitepoint, so leave that at 6500 K in Photoshop. The numbers above are pretty similar to default sRGB ones, with one exception of GRN X value, which I'll address below. I haven't yet tried to see what this produces when one uses the IR1/GRN/UV3 combo, but here's the result I got for Enceladus NAC RGB (it's a white body so it's pretty illustrative):
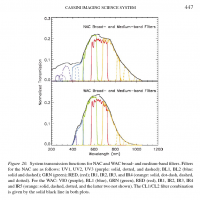
The most striking difference w/ respect to classic RGB channels is the "green" filter isn't exactly green. Neither is the red filter all red. The reason to this is these two have a substantial amount of bandpass overlap, 40% I'd say. The fact is nicely shown in this graph:
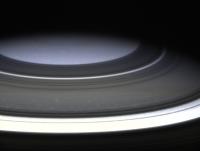
This alone is the reason I'm a bit wary of CICLOPS processing techniques where they stuff 3 RGB filters together and basically call it "natural" color. The fact the green filter is actually yellowish accounts for the unusual X value above. Note that if you want to get "accurate" color this way, you still need calibrated images that retain physical relationship of relative target brightnesses throughout each filter used. Raw stretched images just don't cut it here. I'll have to play around with Saturn and Jupiter images a bit, but the results I got so far seem even duller than my usual processing. I'm not entirely sure this is the right way to get accurate colors, but the above results at least show the intrinsic color the filters would look to human eyes. EDIT: Here are two quick-n-dirty results with this concept:
Compare to this release and this release. -------------------- |
||||
|
|
|
||||
|
Mar 31 2007, 04:37 PM
Post
#25
|
|
|
Member Group: Members Posts: 169 Joined: 17-March 06 Member No.: 709 |
Thank you Malmer for that Big Io image -- that is truly amazing!
I believe that that was the one that I had seen before. You've done some great work stitching that together and allowing one to "fly" over the surface of Io. The number and variety of volcanoes on Io is astounding. Do you have a website with more space images? Another Phil |
|
|
|
|
Mar 31 2007, 05:54 PM
Post
#26
|
|
 Senior Member Group: Members Posts: 1625 Joined: 5-March 05 From: Boulder, CO Member No.: 184 |
QUOTE (volcanopele @ Mar 27 2007, 08:44 AM) Here are some random Io images before I head off to bed. I'll post details in the morning. [attachment=9858:attachment][attachment=9861:attachment] I'll try to look more closely as to whether your two images I'm quoting might improve the lower res areas on my map, say the NE part of Media Regio near 50W longitude. The current version of my map (once the server comes up) is here: http://laps.noaa.gov/albers/sos/sos.html#IO A separate idea I'm entertaining is adding in some higher res B&W images of Tvashtar to the existing lower res color. -------------------- Steve [ my home page and planetary maps page ]
|
|
|
|
|
Mar 31 2007, 10:54 PM
Post
#27
|
|
 Member Group: Members Posts: 241 Joined: 22-August 05 From: Stockholm Sweden Member No.: 468 |
QUOTE (PhilHorzempa @ Mar 31 2007, 06:37 PM) Thank you Malmer for that Big Io image -- that is truly amazing! Do you have a website with more space images? Another Phil Thanx! Well, I dont really have a real homepage for my images. But I have this "folder" on my company webpage where i dump space images that are in different states of work in progress to show friends and stuff. Some of the pictures are really cool. the venus pictures are my favorites. www.syndicate.se/image/space/ the good the bad and the ugly... please dont link directly to those pictures because they are not intended for a wider audience just yet... (stupid thing to say on the net i guess...) Mattias |
|
|
|
|
Mar 31 2007, 11:12 PM
Post
#28
|
||
|
Member Group: Members Posts: 241 Joined: 22-August 05 From: Stockholm Sweden Member No.: 468 |
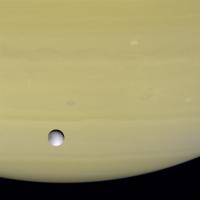
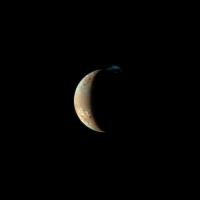
used some data on the NH site to make a slightly more interesting color image.
lowres color from mvic highres luminance from lorri
/M |
|
|
|
|
|
|
Mar 31 2007, 11:31 PM
Post
#29
|
|||
|
Senior Member Group: Moderator Posts: 3231 Joined: 11-February 04 From: Tucson, AZ Member No.: 23 |
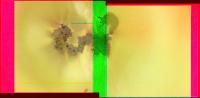
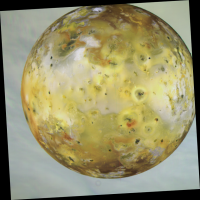
Here are a couple of additional RGV color views of Io:
This image is from the 2nd Galileo orbit (G2). This image is composed of a full-frame green filter image and summed red and violet filter images. Compare this image to the press released version of this image: http://photojournal.jpl.nasa.gov/catalog/PIA00494 . This color view was taken on September 7, 1996 from a distance of 486,800 km. This view has a pixel scale of 4.9 km/pixel.
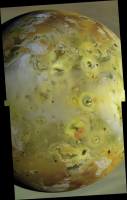
This 2-frame, 3-color mosaic is from the 14th Galileo orbit (E14). This image is compared of three mosaics consisting of violet, green, and red filter images. Compared this image to the press released version of this sequence: http://photojournal.jpl.nasa.gov/catalog/PIA01604. This color view was taken almost 9 years ago today, on March 29, 1998, from a distance of 295,800 km. This view has a pixel scale of 2.96 km/pixel. -------------------- &@^^!% Jim! I'm a geologist, not a physicist!
The Gish Bar Times - A Blog all about Jupiter's Moon Io |
||
|
|
|
||
|
Apr 1 2007, 01:50 AM
Post
#30
|
||
|
Member Group: Members Posts: 378 Joined: 21-April 05 From: Portugal Member No.: 347 |
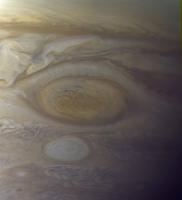
QUOTE (elakdawalla @ Mar 30 2007, 11:38 PM) ...my guess based on the CIE diagram would be something like: IR1 0.95 0.05 GRN 0.45 0.55 UV3 0.18 0 Would you concur? --Emily Sorry I couldn't help help with this sooner, I'm really really buzzy right now, but I'll look for a file I have somewhere with some calculated values... I guess that there might be a formula for accurate results, I'm just making educate guesses anyway. From you posts I see that you got it anyway ;-) One thing to consider is that filter bandpass is not considered, that is, we are finding XY values for the peak filter transmittance disregarding how broad in the spectrum that transmittance is. This will affect color saturation I guess. Anyway, when I have time I'll try to post my values and processing results with them. For now, I'll just leave you with a Voyager OGB image of the Great Red Spot processed with colorspace transformation (Ok, this is going very very off topic but at least is Jupiter related!).
-------------------- _______________________
www.astrosurf.com/nunes |
|
|
|
|
|
|

|
Lo-Fi Version | Time is now: 20th April 2024 - 04:21 AM |
|
RULES AND GUIDELINES Please read the Forum Rules and Guidelines before posting. IMAGE COPYRIGHT |
OPINIONS AND MODERATION Opinions expressed on UnmannedSpaceflight.com are those of the individual posters and do not necessarily reflect the opinions of UnmannedSpaceflight.com or The Planetary Society. The all-volunteer UnmannedSpaceflight.com moderation team is wholly independent of The Planetary Society. The Planetary Society has no influence over decisions made by the UnmannedSpaceflight.com moderators. |
SUPPORT THE FORUM Unmannedspaceflight.com is funded by the Planetary Society. Please consider supporting our work and many other projects by donating to the Society or becoming a member. |
|