Distant vistas, Endeavour, Iazu, and beyond |

  |
Distant vistas, Endeavour, Iazu, and beyond |
 Feb 14 2010, 08:03 PM Feb 14 2010, 08:03 PM
Post
#106
|
|||
 Senior Member  Group: Members Posts: 1628 Joined: 5-March 05 From: Boulder, CO Member No.: 184 |
I see on Google Mars that Bopolu rim rises about 1000 feet above the local terrain, and the crater is about 5000' deep. Google Mars can reproduce the view along the horizon seen from Opportunity. Bopolu is the smaller double bump in the center (left of a larger bump).
Here's another view from much closer.
-------------------- Steve [ my home page and planetary maps page ]
|
||
 |
 
|
||
|
Feb 16 2010, 08:00 PM
Post
#107
|
|
|
Junior Member Group: Members Posts: 27 Joined: 22-September 08 Member No.: 4349 |
What's the tasty morsel in the "upper right hand corner" at http://qt.exploratorium.edu/mars/opportuni...XP2373L7M1.JPG?!
|
|
|
|
|
Feb 16 2010, 08:20 PM
Post
#108
|
|
|
Senior Member Group: Moderator Posts: 4279 Joined: 19-April 05 From: .br at .es Member No.: 253 |
The answer is just a few post before yours.

|
|
|
|
|
Feb 16 2010, 09:41 PM
Post
#109
|
|
 Senior Member Group: Members Posts: 4246 Joined: 17-January 05 Member No.: 152 |
That morsel is a bit of Iazu - compare it with the Iazu images earlier in this thread.
|
|
|
|
|
Feb 16 2010, 09:59 PM
Post
#110
|
|
|
Senior Member Group: Moderator Posts: 4279 Joined: 19-April 05 From: .br at .es Member No.: 253 |
Ooops! Fredk is right.
I thought that image was pointing SW towards Bopolu but it's actually to the SE. |
|
|
|
|
Feb 22 2010, 10:42 PM
Post
#111
|
|
|
Senior Member Group: Members Posts: 3516 Joined: 4-November 05 From: North Wales Member No.: 542 |
There's a hill (maybe two) on the horizon to the left here. Is it one we've seen already?
http://qt.exploratorium.edu/mars/opportuni...66P2369L7M1.JPG |
|
|
|
|
Feb 23 2010, 01:21 AM
Post
#112
|
|
|
Senior Member Group: Members Posts: 4246 Joined: 17-January 05 Member No.: 152 |
That's Bopolu Crater. From these new images, I don't see any more bits of it compared with our last views, so this will be our best view for the time being.
|
|
|
|
|
Feb 23 2010, 01:48 AM
Post
#113
|
||
|
Member Group: Senior Member Posts: 136 Joined: 8-August 06 Member No.: 1022 |
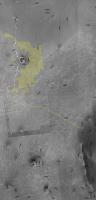
QUOTE (Phil Stooke @ Jan 28 2010, 05:06 AM)  Ngunn, I was just about to say the same thing. The labels are not very clear, but the contours don't make sense any other way. Phil Sorry for the confusion about this, folks! The files got compressed so brutally when converting to a PDF format small enough to send, that even I can't read the numbers. Attached is the original figure. The "-1370" that was referred to is labeling an isolated line (right under the number). Sadly, Arcmap doesn't make such purdy contours! The HiRISE wide baseline stereo pair over this region verifies the general aspects of the topography in the MOLA data, but of course is higher in spatial frequency. We are right on the NW edge of a small rise that's probably only a meter or so high and about 200 or so across. Once we finish with Concepcion and head south, we should start to see to the southeast better! -Tim.
Attached thumbnail(s)
|
|
|
|
|
|
|
Feb 23 2010, 04:49 AM
Post
#114
|
|
|
Newbie Group: Members Posts: 14 Joined: 9-November 09 Member No.: 5032 |
With respect to "Sadly, Arcmap doesn't make such purdy contours!", there are some techniques to improve contour output with ArcMap. This blog post has some tips:
http://blogs.esri.com/Dev/blogs/geoprocess...e-analysis.aspx If you are using a terrain dataset (a multi-resolution TIN), it is generally recommended to convert the next to lowest pyramid level to a raster and then contour against that raster. It's a balancing act between technical accuracy and aesthetically pleasing contours. If you are using a TIN, same concept: convert the TIN to a raster and select a surface interpolation method depending on the character of the data. Then contour the raster. For "purdy contours", we nearly always make contours from rasters (DEMs), not TINs/terrain datasets. If you direct me to that elevation data set, I could take a look at it and see what I could do with that data. And for labeling contours, check out the Maplex Label Engine (go to the data frame properties > General tab > Label engine listbox). The laddering option works well for many situations. Have you looked into making visibility maps from this data? That would be of interest to this forum. regards, Michael Zeiler, ESRI |
|
|
|
|
Feb 23 2010, 09:10 AM
Post
#115
|
|
|
Senior Member Group: Moderator Posts: 4279 Joined: 19-April 05 From: .br at .es Member No.: 253 |
QUOTE (tim53 @ Feb 23 2010, 02:48 AM) Once we finish with Concepcion and head south, we should start to see to the southeast better! We are all looking forward that view.  Slightly OT but does the project has already a name for that "twin crater" 650m SSW of Concepción? QUOTE (Michael Zeiler @ Feb 23 2010, 05:49 AM) If you direct me to that elevation data set, I could take a look at it and see what I could do with that data. I know some people who would love to put their hands on that data too. See here and here. |
|
|
|
|
Feb 23 2010, 01:35 PM
Post
#116
|
|
 Special Cookie Group: Members Posts: 2168 Joined: 6-April 05 From: Sintra | Portugal Member No.: 228 |
QUOTE (Tesheiner @ Feb 23 2010, 09:10 AM) We are all looking forward that view. Slightly OT but does the project has already a name for that "twin crater" 650m SSW of Concepción? Coff coff... but more accordingly with the islands theme: http://en.wikipedia.org/wiki/Twin_Island -------------------- "Ride, boldly ride," The shade replied, "If you seek for Eldorado!"
Edgar Alan Poe |
|
|
|
|
Feb 23 2010, 04:24 PM
Post
#117
|
|
|
Member Group: Senior Member Posts: 136 Joined: 8-August 06 Member No.: 1022 |
QUOTE (Michael Zeiler @ Feb 22 2010, 08:49 PM) With respect to "Sadly, Arcmap doesn't make such purdy contours!", there are some techniques to improve contour output with ArcMap. This blog post has some tips: http://blogs.esri.com/Dev/blogs/geoprocess...e-analysis.aspx If you are using a terrain dataset (a multi-resolution TIN), it is generally recommended to convert the next to lowest pyramid level to a raster and then contour against that raster. It's a balancing act between technical accuracy and aesthetically pleasing contours. If you are using a TIN, same concept: convert the TIN to a raster and select a surface interpolation method depending on the character of the data. Then contour the raster. For "purdy contours", we nearly always make contours from rasters (DEMs), not TINs/terrain datasets. If you direct me to that elevation data set, I could take a look at it and see what I could do with that data. And for labeling contours, check out the Maplex Label Engine (go to the data frame properties > General tab > Label engine listbox). The laddering option works well for many situations. Have you looked into making visibility maps from this data? That would be of interest to this forum. regards, Michael Zeiler, ESRI Hi Michael: I will have to verify this when I get in to work in an hour or so, but I either used the gridded global data product from the Planetary Data System (will have to look up the actual link at work as well, but people here probably know what I'm referring to) - most likely - or I contoured the individual data points using the PDS' Orbital data explorer to create a shapefile of shot points within a lat/lon range. This latter option only became readily available about a year ago, so it's possible I didn't use it in this instance. Thanks for the Arcmap suggestions. I've been slowly familiarizing myself with it's capabilities since I had to 'give up' on Canvas X when ACD Systems abandoned support for the Mac (and since it can't handle files over a GB in size). -Tim. |
|
|
|
|
Feb 23 2010, 04:25 PM
Post
#118
|
|
|
Member Group: Senior Member Posts: 136 Joined: 8-August 06 Member No.: 1022 |
QUOTE (Tesheiner @ Feb 23 2010, 01:10 AM) We are all looking forward that view. Slightly OT but does the project has already a name for that "twin crater" 650m SSW of Concepción? I know some people who would love to put their hands on that data too. See here and here. We'll probably try to swing buy this crater on our way to Endeavour. We usually don't name the craters until we're close to them or know we might visit them. -Tim. |
|
|
|
|
Feb 23 2010, 08:49 PM
Post
#119
|
|
|
Newbie Group: Members Posts: 14 Joined: 9-November 09 Member No.: 5032 |
QUOTE (tim53 @ Feb 23 2010, 09:24 AM) Thanks for the Arcmap suggestions. I've been slowly familiarizing myself with it's capabilities since I had to 'give up' on Canvas X when ACD Systems abandoned support for the Mac (and since it can't handle files over a GB in size). -Tim. Tim, I know it's a bummer to switch software. ArcMap has a rich set of capabilities, but it's a learning curve to master it all. Contouring is a tricky proposition and the best technique depends on the nature of the data and striking a balance between technical accuracy and making pleasing contour curves. Label placement is another challenge. Also, surface analysis can be done both with a DEM (digital elevation model, a raster with elevation values) or a TIN (triangulated irregular network). (A terrain dataset is a multi-resolution TIN optimized for huge point sets such as lidar point clouds). The people who do surface analysis work with both data structures and convert from one to another, depending on the desired map product or analysis they are trying to perform. An aspect-slope map might be another good way to display the nature of this terrain. See http://blogs.esri.com/Support/blogs/mappin...-slope-map.aspx This technique displays aspect (direction of slope) using a color hues and slope using saturation. This blog post outlines the individual steps, but I know that we've released a geoprocessing model that largely automates this whole process. Another topic on interest on this forum is identifying distant features on the horizon. A viewshed map can easily help identify potential features visible from a point and this is relatively easy to make once you have a DEM. See http://webhelp.esri.com/arcgisdesktop/9.3/...ewshed_analysis If you need technical assistance with ArcMap, you can contact me. If I don't know the answer, I know the experts who do. - Michael |
|
|
|
|
Feb 24 2010, 09:06 AM
Post
#120
|
|||
|
Junior Member Group: Members Posts: 59 Joined: 18-July 07 From: London, UK Member No.: 2873 |
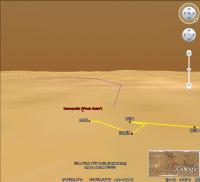
Well I had a pop at the viewshed before, but was kind of limited by the DEM I was using (75 m/px HRSC), and the fact that I hadn't lifted the view off the ground.
So here's the viewshed from Opportunity, from a few weeks back now, from 1.8 m above the ground. It doesn't look all that different to the ones I posted before to be honest.
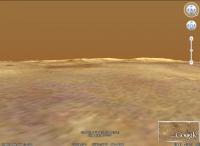
And a possible view somewhere along the predicted path:
These don't take the curvature of the planet into consideration, as there's no easy way (to my knowledge) of changing the radius to that of Mars rather than the Earth (apart from fooling Arc with the original projection etc.). And switching on the curvature just for the hell of it does seem to make quite a difference in terms of what's visible on the horizon; that effect could be even greater for Mars then. So there are my usual warnings not to take my distant vistas too seriously! I'm having a look at the aspect-slope map now - will post back if it works ok. Pete |
||
|
|
|
||
|

|
Lo-Fi Version | Time is now: 25th April 2024 - 09:52 AM |
|
RULES AND GUIDELINES Please read the Forum Rules and Guidelines before posting. IMAGE COPYRIGHT |
OPINIONS AND MODERATION Opinions expressed on UnmannedSpaceflight.com are those of the individual posters and do not necessarily reflect the opinions of UnmannedSpaceflight.com or The Planetary Society. The all-volunteer UnmannedSpaceflight.com moderation team is wholly independent of The Planetary Society. The Planetary Society has no influence over decisions made by the UnmannedSpaceflight.com moderators. |
SUPPORT THE FORUM Unmannedspaceflight.com is funded by the Planetary Society. Please consider supporting our work and many other projects by donating to the Society or becoming a member. |
|