

CRISM Corner |

  |
CRISM Corner |
 Sep 27 2007, 03:54 AM Sep 27 2007, 03:54 AM
Post
#61
|
|
 Senior Member  Group: Members Posts: 3419 Joined: 9-February 04 From: Minneapolis, MN, USA Member No.: 15 |
I will also point out that Mars is supposedly being pelted by meteors large enough to create secondaries at the rate of about one a month, according to an MGS study I read not too long ago.
Ejecta that lands on relatively flat ground will create secondary craters or just deposit clods of debris on generally flat surfaces. They'll cause landslides on steep enough slopes -- and small landslides create gullies. I don't totally buy this theory, unfortunately, since it would statistically tend to create gullies with origin points of varying altitude up a given slope, and we tend to see gullies with consistent origin points along visible contacts in the slope walls. But it is one mechanism that undoubtedly does create gullies on Martian slopes, so it would be remiss not to recognize it. -the other Doug -------------------- The trouble ain't that there is too many fools, but that the lightning ain't distributed right. -Mark Twain
|
 |
 
|
|
Oct 2 2007, 04:39 AM
Post
#62
|
|
 Senior Member Group: Members Posts: 2228 Joined: 1-December 04 From: Marble Falls, Texas, USA Member No.: 116 |
These gullies will remain interesting Martian landforms for a long time to come. If the CRISM observations really do rule out surface salt deposits at the distal ends of these things, it will be a setback for theories invoking flowing, liquid water. I've looked at a lot of the public HiRise images of gullies and I get the distinct impression that gully source layers at escarpments are losing physical strength and falling apart, contributing fine sediments to fall down the purported steep slopes.
I can imagine layers of fine sediments cemented by sparse ice, falling apart as the ice sublimes. Water could be involved, but it doesn't need to be flowing on the surface. -------------------- ...Tom
I'm not a Space Fan, I'm a Space Exploration Enthusiast. |
|
|
|
|
Oct 31 2007, 04:20 PM
Post
#63
|
|
|
Member Group: Members Posts: 401 Joined: 5-January 07 From: Manchester England Member No.: 1563 |
Does anyone know where to find CRISM images of potential phoenix landing sites please, I've had no luck at all at the CRISM website!
Edit: I have seen some near thumbnail sized versions, and I was wondering if the images simply weren't on public release yet? -------------------- |
|
|
|
|
Nov 1 2007, 01:22 AM
Post
#64
|
|
 Member Group: Members Posts: 267 Joined: 5-February 06 Member No.: 675 |
QUOTE (marsbug @ Oct 31 2007, 12:20 PM)  Does anyone know where to find CRISM images of potential phoenix landing sites please, I've had no luck at all at the CRISM website! Some of the data has been placed in the PDS. The images are raw multispectral data cubes, which makes it something of a challenge. I wonder if any of the imaging wizards here are willing to try interpreting those files.Edit: I have seen some near thumbnail sized versions, and I was wondering if the images simply weren't on public release yet? Steve M |
|
|
|
|
Nov 1 2007, 07:49 AM
Post
#65
|
|
|
Founder Group: Chairman Posts: 14431 Joined: 8-February 04 Member No.: 1 |
They'll work with ISIS I presume - but I've not found a free ( as in beer ) tool to open cubes for either VIMS or CRISM easily for OSX or Windows.
Doug |
|
|
|
|
Nov 1 2007, 10:59 AM
Post
#66
|
|
|
Member Group: Members Posts: 401 Joined: 5-January 07 From: Manchester England Member No.: 1563 |
Thanks!

-------------------- |
|
|
|
|
Nov 1 2007, 11:25 AM
Post
#67
|
|
 Senior Member Group: Members Posts: 3648 Joined: 1-October 05 From: Croatia Member No.: 523 |
QUOTE (djellison @ Nov 1 2007, 08:49 AM) They'll work with ISIS I presume - but I've not found a free ( as in beer ) tool to open cubes for either VIMS or CRISM easily for OSX or Windows. I've been thinking of producing something for VIMS cubes for Windows, but I'm stuck at ideas how to present multispectral data like that or what output options to provide - saving entire cube as a sequence of PNGs, selective wavelengths etc. That and a general lazyness. VIMS is complicated in that it has both a VIS channel and an IR channel which are quite different, often having different resolutions. VIS is very, very badly affected by dark current while IR channel (Titan!) would be probably of most interest to everyone. I haven't even touched that one yet let alone attempted calibration. SteveM, thanks for the link, I was wondering where CRISM data is! -------------------- |
|
|
|
|
Nov 1 2007, 12:13 PM
Post
#68
|
|
|
Founder Group: Chairman Posts: 14431 Joined: 8-February 04 Member No.: 1 |
QUOTE (ugordan @ Nov 1 2007, 11:25 AM) saving entire cube as a sequence of PNGs, Bingo. That's what I'd like
|
|
|
|
|
Nov 1 2007, 03:00 PM
Post
#69
|
|
|
Member Group: Admin Posts: 468 Joined: 11-February 04 From: USA Member No.: 21 |
First off, for finding CRISM data, I've been really impressed with the Orbital Data Explorer over at the Geoscience Node. They have a very slick interface with maps and, once you learn the file extensions, you can search directly for a specific product type.
In terms of the CRISM PDS release itself, the furthest calibration that seems to be available right now are the I/F images. Unfortunately, these products don't take into account the atmospheric contribution. That light that makes the trip through the atmosphere twice turns out (...wait for it...) fairly dull shades of red. Eventually they will be releasing files that remove any atmospheric effects, both in image form and as a global gridded map. These will inevitably be much more pleasing to look at from a pretty picture perspective. So far, I've just been playing with the VNIR (near infra-red and visible). (Ugordon, I guess I'm the exception to your suggestion about what people might be interested in) If 6 filters of visible light from pancam are good, then ~107 filters of visible light from CRISM is better, right? But, the images below are heavily enhanced to get through the atmospheric blur, and thus, false-color.Here are 3 images from the Phoenix landing area: 1| http://www.lyle.org/~markoff/crism/frt0000...if168s_trr2.jpg 2| http://www.lyle.org/~markoff/crism/frt0000...if168s_trr2.jpg 3| http://www.lyle.org/~markoff/crism/frt0000...if168s_trr2.jpg and a map of their positions, based on the landing ellipse basemap: http://www.lyle.org/~markoff/crism/phoenix_crism.jpg Images 1 and 2 overlap this CTX image, 1 on the left side, and 2 on the right. And, just for fun, here is one of the Columbia Hills:  and one of Victoria Crater (I think...)  For processing, I've been using a version of Bippy that I kludged into working for the CRISM data. If people are interested, I can see about getting these changes worked into a future version. |
|
|
|
|
Nov 1 2007, 03:26 PM
Post
#70
|
|
 Senior Member Group: Moderator Posts: 2262 Joined: 9-February 04 From: Melbourne - Oz Member No.: 16 |
QUOTE (slinted @ Nov 1 2007, 03:00 PM) and one of Victoria Crater (I think...) Is that not Endurance, with Erebus half cut off at the bottom? -------------------- |
|
|
|
|
Nov 1 2007, 03:45 PM
Post
#71
|
|
 Administrator Group: Admin Posts: 5172 Joined: 4-August 05 From: Pasadena, CA, USA, Earth Member No.: 454 |
QUOTE (ugordan @ Nov 1 2007, 04:25 AM) I've been thinking of producing something for VIMS cubes for Windows, but I'm stuck at ideas how to present multispectral data like that or what output options to provide - saving entire cube as a sequence of PNGs, selective wavelengths etc. That and a general lazyness. VIMS is complicated in that it has both a VIS channel and an IR channel which are quite different, often having different resolutions. VIS is very, very badly affected by dark current while IR channel (Titan!) would be probably of most interest to everyone. I haven't even touched that one yet let alone attempted calibration. Well, I think the saving-as-PNGs place is a great way to start. Another straightforward product would be a .mov running through all the wavelengths, because then you can use the little slider to scroll quickly back and forth. (Hmm...in an ideal world you'd want to know which wavelength you're looking at as you scroll, which would either mean outputting text on the image, which sounds hard to do, or maybe inserting a black frame every 10th frame or something...hmmm...) Selected wavelengths would be good. Looking at the CRISM calibrated products page, you can get an idea of which wavelengths are likely to be most valuable there. For example, 1900 nm and 2100 nm are good bands for looking for water-rich minerals. For VIMS, the idea is similar; try to find a couple spectra of interesting materials (water ice and CO2 would be the big ones I guess) and pick out some wavelengths in absorptions and continuum. If you feel like getting fancy you can try some band math; all the CRISM team's math is documented. I'll bet that although they've developed fancy algorithms for calculating band depths and stuff, that you can probably capture 80% of the information in their fancy products with much simpler algorithms like straight ratios of two bands. At Titan, I'll bet a straight ratio of two bands, one in a window and one in the adjacent continuum, would cancel out most of those pesky atmospheric effects. In short: please give it a go! --Emily -------------------- My website - My Patreon - @elakdawalla on Twitter - Please support unmannedspaceflight.com by donating here.
|
|
|
|
|
Nov 4 2007, 12:37 PM
Post
#72
|
|
|
Member Group: Admin Posts: 468 Joined: 11-February 04 From: USA Member No.: 21 |
QUOTE (jamescanvin @ Nov 1 2007, 07:26 AM) Is that not Endurance, with Erebus half cut off at the bottom? Ah, right you are James. I was struggling with the geometry and pointing of the images based on tags alone. Here is a projection of 2 CRISM images (frt000028a1_07_if164s_trr2 and frt0000334d_07_if165s_trr2) showing Victoria and Endurance, using blender to point the images based on the DDR files. 
|
|
|
|
|
Nov 4 2007, 12:40 PM
Post
#73
|
|
|
Senior Member Group: Members Posts: 3648 Joined: 1-October 05 From: Croatia Member No.: 523 |
Nice one, slinted. Is that "true" or enhanced color?
-------------------- |
|
|
|
|
Nov 4 2007, 01:03 PM
Post
#74
|
|
|
Member Group: Admin Posts: 468 Joined: 11-February 04 From: USA Member No.: 21 |
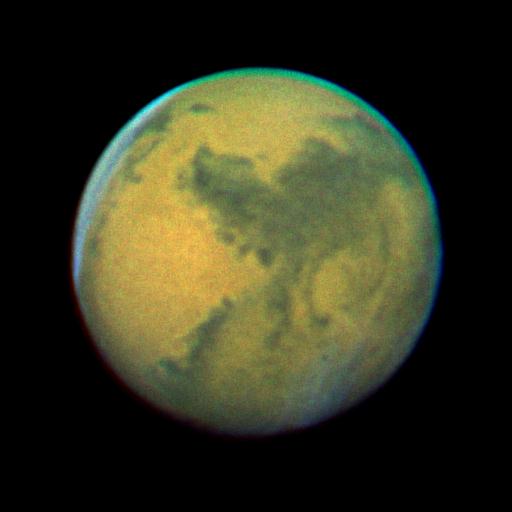
Enhanced would be a nice way to put it. The true color comes out looking like this (unprojected):
 ...which isn't much to look at. The brightness range is very narrow, as is the spectral variation. So, to cut through the atmospheric contributions, and to make something a little more aesthetic, I've doing the equivalent of a giant global unsharp mask. The colors in the images I've posted so far are the difference between the pixel and a 150 pixel-wide blur. For now, I'm just trying to feel out what this dataset is going to have to offer. True color, or some variation there of, is just the beginning
|
|
|
|
|
Nov 5 2007, 03:26 AM
Post
#75
|
|
|
Member Group: Members Posts: 267 Joined: 5-February 06 Member No.: 675 |
QUOTE (slinted @ Nov 4 2007, 09:03 AM) ...For now, I'm just trying to feel out what this dataset is going to have to offer. True color, or some variation there of, is just the beginning I'd always thought that such a multi-spectral dataset would offer a nice opportunity for principal component analysis. Using a standard statistical package to extract the principal components, I imagine the first component would be something like the overall brightness variation, while the next two would represent the most significant spectral variations in the particular image and would presumably map the most significant mineral variations.From what I read, the CRISM folks are comparing the spectra they find to known terrestrial samples. Principal component mapping is more of an exploratory technique. At the end it might even be possible to compare the identified principal components with the known spectra to identify what minerals vary significantly in a given image. It's been years since I've done any statistics of this kind (and never with a dataset this big) but it seems like a plausible approach, even if a bit naïve. Steve M |
|
|
|
|

|
Lo-Fi Version | Time is now: 16th April 2024 - 05:41 AM |
|
RULES AND GUIDELINES Please read the Forum Rules and Guidelines before posting. IMAGE COPYRIGHT |
OPINIONS AND MODERATION Opinions expressed on UnmannedSpaceflight.com are those of the individual posters and do not necessarily reflect the opinions of UnmannedSpaceflight.com or The Planetary Society. The all-volunteer UnmannedSpaceflight.com moderation team is wholly independent of The Planetary Society. The Planetary Society has no influence over decisions made by the UnmannedSpaceflight.com moderators. |
SUPPORT THE FORUM Unmannedspaceflight.com is funded by the Planetary Society. Please consider supporting our work and many other projects by donating to the Society or becoming a member. |
|


