Numbers to Pixels |

  |
Numbers to Pixels |
 Jan 7 2009, 01:10 PM Jan 7 2009, 01:10 PM
Post
#1
|
|
|
Founder  Group: Chairman Posts: 14431 Joined: 8-February 04 Member No.: 1 |
I've got a few .tab's from the PHX Lidar
Basically - after playing with it for a while, I'll end up with a spreadsheet of values. Each column being one sample 30s apart - each row being a different altitude. Does anyone know a means of taking a CSV or similar, and turning it into a small image with pixel brightness representing the values from the CSV? I've thought of one technique using conditional formatting in Excel - but it probably wont work very well |
 |
 
|
|
Jan 7 2009, 01:23 PM
Post
#2
|
|
 Senior Member Group: Moderator Posts: 2262 Joined: 9-February 04 From: Melbourne - Oz Member No.: 16 |
My terrain mapping (and in fact my MER image processing as well) does quite a bit of converting of number arrays to image pixel values using the FreeImage C++ library. If you sent me the file I could probably do the conversion to without too much trouble.
IDL can do it as well (not sure about the free GDL, never used it) using 'plotgrid'. Not sure if you could get 16bit images using this method though (if you needed that). -------------------- |
|
|
|
|
Jan 7 2009, 01:29 PM
Post
#3
|
||
|
Founder Group: Chairman Posts: 14431 Joined: 8-February 04 Member No.: 1 |
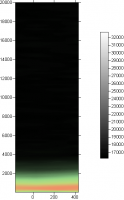
This is what I've managed so far
 Using LS003RLA_00896474226_10DCM0.TAB It's basically one very tall tab - that repeats every 500 rows - the 500 rows being 500 10m altitude samples. I cut and pasted each 500 cell chunk, so they were in a grid, not a line. Then used conditional formatting with Excel. And I got this - it worked WAY better than I was expecting. 261 seconds left to right. 5000 metres bottom to top. I have to use Excel 07 on a PC to do it though - Excel 08 doesnt do conditional formatting like that. A bit annoying.
Attached thumbnail(s)
|
|
|
|
|
|
|
Jan 7 2009, 02:39 PM
Post
#4
|
|
 Senior Member Group: Admin Posts: 4763 Joined: 15-March 05 From: Glendale, AZ Member No.: 197 |
It sounds like the kind of thing I was learning to do in FORTRAN shortly after you were born Doug. But I've long ago forgotten all that.
-------------------- If Occam had heard my theory, things would be very different now.
|
|
|
|
|
Jan 7 2009, 02:58 PM
Post
#5
|
|
|
Founder Group: Chairman Posts: 14431 Joined: 8-February 04 Member No.: 1 |
Next step - doing it greyscale - for the two different frequencies sampled. Then merge as R and G in a colour image to highlight differences.
Actually http://www.nasa.gov/mission_pages/phoenix/...plotTV_001.html - using THAT data set is probably a sensible next step. |
|
|
|
|
Jan 7 2009, 04:36 PM
Post
#6
|
|
 Senior Member Group: Members Posts: 1281 Joined: 18-December 04 From: San Diego, CA Member No.: 124 |
Brilliant!
-------------------- Lyford Rome
"Zis is not nuts, zis is super-nuts!" Mathematician Richard Courant on viewing an Orion test |
|
|
|
|
Jan 7 2009, 05:39 PM
Post
#7
|
|
|
Member Group: Admin Posts: 976 Joined: 29-September 06 From: Pasadena, CA - USA Member No.: 1200 |
QUOTE (djellison @ Jan 7 2009, 05:10 AM)  I've got a few .tab's from the PHX Lidar Basically - after playing with it for a while, I'll end up with a spreadsheet of values. Each column being one sample 30s apart - each row being a different altitude. Does anyone know a means of taking a CSV or similar, and turning it into a small image with pixel brightness representing the values from the CSV? I've thought of one technique using conditional formatting in Excel - but it probably wont work very well I'm lazy and cheap. I use the PGM format and then convert it to whatever format I need to distribute. Here's a crude way of generating an image from your data: 1) save the data table as text, no commas, just spaces between the data values. 2) using your favourite editor, edit the file and add at the top of the page: P2 <sizex> <sizey> <maxval> where the <sizex> and <sizey> indicate the number of columns and rows in your table and <maxval> should be the maximum value in your table (needs to be less than 65535). 3) use your favourite image conversion tool to convert the image to whatever format you prefer. I use the netpbm set of tools or xv (hey I know, I'm old!). Note that all the numbers need to be integers. Here's an example of a PGM image: P2 3 4 11 0 1 2 3 4 5 6 7 8 9 10 11 Hope this helps -------------------- Disclaimer: all opinions, ideas and information included here are my own,and should not be intended to represent opinion or policy of my employer.
|
|
|
|
|
Jan 7 2009, 06:12 PM
Post
#8
|
|
|
Member Group: Members Posts: 252 Joined: 5-May 05 From: Mississippi (USA) Member No.: 379 |
QUOTE (djellison @ Jan 7 2009, 08:10 AM) Does anyone know a means of taking a CSV or similar, and turning it into a small image with pixel brightness representing the values from the CSV? Are you familiar with Topcat? A Java Tool for OPerations on Catalogues and Tables, a viewer/editor for astronomical tabular data, including FITS table extensions and VOTable documents. It imports CSV data First a warning - I really have little understanding of the program. I just downloaded it to create spherical plots from data created by my Einstein@home WU's. I just followed some written instructions. Also the latest version may be corrupted. I could only get version 3.1 to launch on my WIN XP system.  About Topcat ftp archive (older versions) |
|
|
|
|
Jan 7 2009, 07:37 PM
Post
#9
|
|
 Junior Member Group: Members Posts: 63 Joined: 18-November 08 Member No.: 4490 |
QUOTE (RoverDriver @ Jan 7 2009, 05:39 PM) I'm lazy and cheap. I use the PGM format and then convert it to whatever format I need to distribute. Me too! Thats probably the simplest way - but if you want to put a little maths in between input numbers & plotted colors, I often use a simple BASIC script. This is for QBASIC.EXE, which everyone on the planet will either have (or can download free from MS) Something similar would work for Linux smallbasic/freebasic. -------------- REM Simple CSV plotter INPUT "X,Y,Filename"; mx, my, fil$ SCREEN 13 OPEN fil$ + ".csv" FOR INPUT AS 1 FOR y = 1 TO my: FOR x = 1 TO mx INPUT #1, v PSET (x, y), v NEXT x: NEXT y CLOSE 1 --------------- Needs a PALETTE statement loop to fill the palette up before hand - as is you get the default 256 VGA mode 13 palette. |
|
|
|
|
Jan 7 2009, 07:55 PM
Post
#10
|
|
 Member Group: Members Posts: 646 Joined: 23-December 05 From: Forest of Dean Member No.: 617 |
Doug, could you post the CSV data? I was half-way through composing a post about how it'd be trivial in Perl, with the right image manipulation modules, when I realised I might have to provide some evidence for a wild statement like that
 (Disclaimer - I'm incredibly lazy, a terribly hack coder, and it's years since I was paid to actually program, so if I fail to come up with anything it reflects only on me, not Perl. Still, if it's good enough for Scott Maxwell... ) (Disclaimer - I'm incredibly lazy, a terribly hack coder, and it's years since I was paid to actually program, so if I fail to come up with anything it reflects only on me, not Perl. Still, if it's good enough for Scott Maxwell... )(Edit - thanks sci44, that's really thrown down the gauntlet..! Does your snippet need additional code to actually write a file? What would it produce, a bitmap? ) -------------------- --
Viva software libre! |
|
|
|
|
Jan 7 2009, 09:34 PM
Post
#11
|
||
|
Founder Group: Chairman Posts: 14431 Joined: 8-February 04 Member No.: 1 |
Kudos to Card-Carying lurker Pete
He pointed me toward Surfer.
Attached thumbnail(s)
|
|
|
|
|
|
|
Jan 7 2009, 10:17 PM
Post
#12
|
|
|
Junior Member Group: Members Posts: 63 Joined: 18-November 08 Member No.: 4490 |
QUOTE (imipak @ Jan 7 2009, 07:55 PM) (Edit - thanks sci44, that's really thrown down the gauntlet..! Does your snippet need additional code to actually write a file? What would it produce, a bitmap? ) As is, it just plots straight to a DOS-mode screen in glorious clunky DOS VGA graphics, but if you hit shift-PrtSc (printscreen) then Alt-Tab to Windows, you can paste the screenshot into Paint & save a Bmp. Or do it more properly with VisualBasic, VB script, FreeBasic, or for that matter Perl, C (my choice), etc etc. Nice thing about Qbasic is everyone has it/can get it, and very small short progs with no "overhead" code can do useful things - its nice for posting short examples up on forums, etc. To write to a PGM file, from line 5 (FOR y=....) onwards replace with:- OPEN fil$+".pgm" FOR OUTPUT AS 2 PRINT #2,"P2" : PRINT #2,mx;my : PRINT #2, 256 : REM put max no colours for that 256.. FOR y = 1 TO my: FOR x = 1 TO mx INPUT #1, v REM Do calculation/manipulation of (v) here.. PRINT #2, v; NEXT x: NEXT y CLOSE 1 : CLOSE 2 --------------- Although thats untested.. Edit: seems to work ok..Just put the manipulation you want in the middle, ie: IF v > 7 THEN v = 1 ELSE v = 0 etc etc.. |
|
|
|
|
Jan 8 2009, 02:08 AM
Post
#13
|
|
|
Senior Member Group: Members Posts: 1281 Joined: 18-December 04 From: San Diego, CA Member No.: 124 |
-------------------- Lyford Rome
"Zis is not nuts, zis is super-nuts!" Mathematician Richard Courant on viewing an Orion test |
|
|
|
|
May 24 2009, 09:13 AM
Post
#14
|
|
|
Junior Member Group: Members Posts: 47 Joined: 27-December 07 Member No.: 3991 |
Love the pic of the guy with the crayons, I found some others of this just recently.
http://gizmodo.com/5266151 They include a close up of the sheet so you can see the numbers. |
|
|
|
|
May 25 2009, 02:33 PM
Post
#15
|
|
|
Member Group: Members Posts: 378 Joined: 21-April 05 From: Portugal Member No.: 347 |
Interestingly, the relation between the visible numbers and the painted colors is not very accurate. Did they painted according to some sort of value average?
I'd really like to have those data print outs and type all the values! -------------------- _______________________
www.astrosurf.com/nunes |
|
|
|
|

|
Lo-Fi Version | Time is now: 23rd April 2024 - 10:59 PM |
|
RULES AND GUIDELINES Please read the Forum Rules and Guidelines before posting. IMAGE COPYRIGHT |
OPINIONS AND MODERATION Opinions expressed on UnmannedSpaceflight.com are those of the individual posters and do not necessarily reflect the opinions of UnmannedSpaceflight.com or The Planetary Society. The all-volunteer UnmannedSpaceflight.com moderation team is wholly independent of The Planetary Society. The Planetary Society has no influence over decisions made by the UnmannedSpaceflight.com moderators. |
SUPPORT THE FORUM Unmannedspaceflight.com is funded by the Planetary Society. Please consider supporting our work and many other projects by donating to the Society or becoming a member. |
|