QUB2PNG, Playing with Cassini VIMS cubes |

  |
QUB2PNG, Playing with Cassini VIMS cubes |
 Nov 9 2007, 12:59 AM Nov 9 2007, 12:59 AM
Post
#1
|
||
 Senior Member  Group: Members Posts: 3648 Joined: 1-October 05 From: Croatia Member No.: 523 |
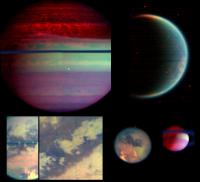
I've made some progress with the IR channel on VIMS, have managed to do partial calibration of the cubes. It's still buggy, but at least it's something. Here's a couple of rough results, all using R=5um, G=2um, B=1.26um.
In case of Saturn the green and blue channels were scaled up to match the intense thermal radiation. The cubes were flatfielded, quantum efficiency corrected and divided by solar spectrum, though I don't know if all the steps were carried out correctly. Dark current subtraction remains to be done - it's possibly the reason why the lower left Titan insets have banding in the red channel. I'm actually pretty satisfied with the way these two turned out, they are reminiscent of official VIMS surface composites, including the "blue" material. Hopefully I'll be able to put something out to convert cubes to PNGs before long. A better solution would be a GUI but that's the tedious part for me. -------------------- |
|
 |
 
|
|
|
Nov 9 2007, 07:40 AM
Post
#2
|
|
|
Founder Group: Chairman Posts: 14431 Joined: 8-February 04 Member No.: 1 |
Ahh - congratulations - to be honest, command line based makes a lot of sense as then we can write nice long batchfiles to process a whole load of it
 Doug |
|
|
|
|
Nov 9 2007, 08:02 AM
Post
#3
|
|
|
Senior Member Group: Members Posts: 3648 Joined: 1-October 05 From: Croatia Member No.: 523 |
QUOTE (djellison @ Nov 9 2007, 08:40 AM)  Ahh - congratulations - to be honest, command line based makes a lot of sense as then we can write nice long batchfiles to process a whole load of it True, but there are issues with that approach - waiting for say 352 images to be written (and it might be pretty slow saving as PNGs due to ZLIB, I'll have to see yet), only to find out the channels you wanted are either severely underexposed, overexposed, etc. Rest assured, though, a command line version is coming first. 
-------------------- |
|
|
|
|
Nov 9 2007, 10:20 AM
Post
#4
|
|
|
Rover Driver Group: Members Posts: 1015 Joined: 4-March 04 Member No.: 47 |
That looks very impressive! I think PDS also has some complicated calibration software with it. Did you use that, or did you make your own?
|
|
|
|
|
Nov 9 2007, 11:33 AM
Post
#5
|
|
|
Senior Member Group: Members Posts: 3648 Joined: 1-October 05 From: Croatia Member No.: 523 |
I'm "reverse-engineering" that software and the available documentation. The software included is a mix of C, Perl and IDL and not particularly straightforward. The code is cryptic enough for me to have trouble deciphering it so I'm not very certain I'm doing everything right. I've found some peculiarities, for example with VIS flatfields which (apparently from what I've seen) need to be multiplied with the cube, not divided out as usual (and as is in fact the case with the IR portion of the instrument). Things like that make your job a little harder and makes you wonder if you're supposed to be multiplying or dividing at certain other points in the pipeline as well.
For a reference on the current state of agreement between these Titan results and official VIMS team calibrated products, see Jason W. Barnes' paper: http://c3po.barnesos.net/publications/pape...l.diversity.pdf Pretty good on my part, but there's room for improvement. Jason's first maps using the same wavelengths actually seem to use several cca. 5 um wavelengths summed up to reduce noise in that channel (those last few wavelengths are particularly noisy unless long exposures are used). Other than that the colors agree pretty well with slight differences possibly attributed to mentioned dark current/background subtraction missing here. There is one major step in calibrating VIMS cubes my code will never do: geometric reprojection. There are all sorts of distortions introduced into the cubes including spacecraft motion, slew maneuvers and jitters that can and often do mess up the end result. To sort this out spice kernels with accurate s/c pointing knowledge are used. That's way beyond my league and all this is bound to be for recreational purposes only - pretty pictures and stuff. -------------------- |
|
|
|
|
Nov 9 2007, 06:20 PM
Post
#6
|
|
 Administrator Group: Admin Posts: 5172 Joined: 4-August 05 From: Pasadena, CA, USA, Earth Member No.: 454 |
ugordan, this is awesome. I particularly liked the crescent view of Titan with surface features visible -- tremendous. Command-line is good enough for me!
Out of curiosity, do you have any idea how the total number of VIMS cubes compares to the total number of ISS images? I am thinking it would be very helpful to put together a browse page, showing either this color combo (which is great) or even just a single grayscale image, maybe the 1-micron one, from each... --Emily -------------------- My website - My Patreon - @elakdawalla on Twitter - Please support unmannedspaceflight.com by donating here.
|
|
|
|
|
Nov 11 2007, 12:39 AM
Post
#7
|
|
|
Senior Member Group: Members Posts: 3648 Joined: 1-October 05 From: Croatia Member No.: 523 |
Preliminary, test release of QUB2PNG which dumps the entire cube to PNG files.
It expects the following files to be located in a directory named "calib" which should be in the same directory as QUB2PNG.EXE: vis_flatfield.qub vis_hires_flatfield.qub vis_lowres_dark_model.tab vis_hires_dark_model.tab vis_perf.qub ir_flatfield.qub ir_hires_flatfield.qub ir_perf.qub solar.qub These calibration files can be located on every VIMS PDS DVD, for example http://pdsimg.jpl.nasa.gov/data/cassini/ca...ims_0015/calib/ At the moment there are a number of limitations to the program - it doesn't correctly work on spectrally summed cubes nor ones where either VIS or IR part of the instrument is turned off. It also doesn't yet work with IR sampling mode "UNDER" a.k.a. NYQUIST mode. When searching the PDS you want cubes where the mode is IMAGE, not LINE or OCCULTATION. By default, running the program with just the name of the VIMS cube it will dump the 352 wavelengths into the same folder - not a very good idea, read on. The second parameter is a scaling factor, useful for tweaking the brightness of various targets and managing underexposure/overexposure. Note that due to significant detector quantum efficiency variation over the spectral range, raw data that was saturated at certain wavelengths doesn't necessarily appear saturated (maxed-out brightness) in the output PNG data. The third parameter is the output directory. An example: qub2png v1356762057_2.qub 10 output\ The resulting filenames are as follows: v1356762057_2 - [072] 0.87863.png Where 072 is the channel number, 0-95 is VIS channel, 96-351 is IR channel. 0.87863 is the wavelength in microns. In general you do not want to mix the VIS and IR channel data in your processings, they aren't compatible currently (different scale factors, not entirely calibrated), have slightly different boresights, FOVs and distortions depending on mode. You'll notice the last few VIS channels and the first few IR channels overlap. VIS HI-RES mode is 3x spatial resolution of NORMAL mode on both axes, IR HI-RES mode is 2x spatial resolution in the horizontal axis while the vertical axis is the same as in NORMAL so it "squashes" the images. VIS and IR NORMAL modes are almost identical in FOV, but the boresights are slightly shifted a pixel or two in both axes. Looking forward to any feedback.  QUB2PNGv01.zip ( 43.96K )
Number of downloads: 662
QUB2PNGv01.zip ( 43.96K )
Number of downloads: 662-------------------- |
|
|
|
|
Nov 11 2007, 01:02 AM
Post
#8
|
|
|
Senior Member Group: Members Posts: 3648 Joined: 1-October 05 From: Croatia Member No.: 523 |
In the meantime, a few more "results":
 Airglow in Titan's atmosphere extending to huge altitudes. Note the "reddish" cloud just peeking over the limb at 1 o'clock in the surface view. Another shot of the airglow, 3.316 um is mapped to red, 3.283 um to green and 3.213 um to blue: 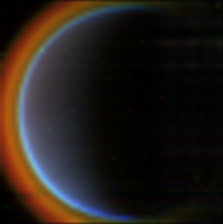  Jupiter with Europa (seen in natural color composite) and the green splotch in IR at the left edge is Ganymede. Finally, a scan through the 256 IR wavelengths in a Quicktime movie, just for fun:  titan_vims.mov ( 534.98K )
Number of downloads: 642
titan_vims.mov ( 534.98K )
Number of downloads: 642-------------------- |
|
|
|
|
Nov 11 2007, 03:08 AM
Post
#9
|
|
 Senior Member Group: Admin Posts: 4763 Joined: 15-March 05 From: Glendale, AZ Member No.: 197 |
Wow Gordan. This stuff is amazing. That atmospheric Titan image is an APOD candidate.
-------------------- If Occam had heard my theory, things would be very different now.
|
|
|
|
|
Nov 11 2007, 02:50 PM
Post
#10
|
|
|
Merciless Robot Group: Admin Posts: 8783 Joined: 8-December 05 From: Los Angeles Member No.: 602 |
Beautiful work, Gordan; really awe-inspiring, actually!
-------------------- A few will take this knowledge and use this power of a dream realized as a force for change, an impetus for further discovery to make less ancient dreams real.
|
|
|
|
|
Nov 11 2007, 03:44 PM
Post
#11
|
|
|
Senior Member Group: Members Posts: 3648 Joined: 1-October 05 From: Croatia Member No.: 523 |
New version is up, improved IR background subtraction (as per official SW), results are pretty good.
QUB2PNGv02.zip ( 45.7K )
Number of downloads: 606I'm all ears for any glaring bugs. Compare these two composites with previous ones: 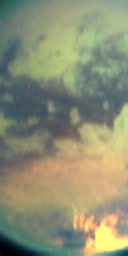 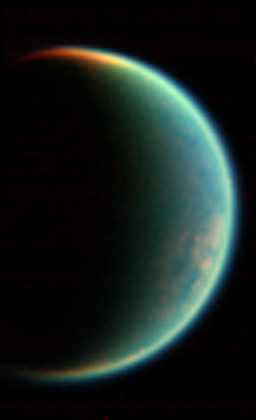 The crescent Titan view is actually the same as in this official VIMS release (first image). Obviously the colors don't exactly match, but to do that I think I'd need exact channels used in the mosaic since even adjacent channels can have significantly varying brightnesses. 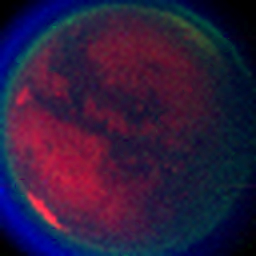 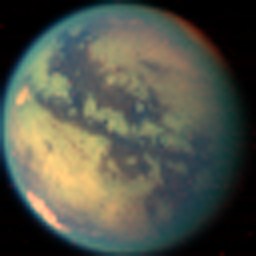 Left: R=4.97 um, G=4.55 um, B=3.31 um. The stack on the right now looks very close to the official result I linked to in my second post, the map on page 8. Finally, two more Quicktime IR scans. Click on images: 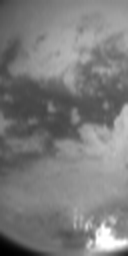 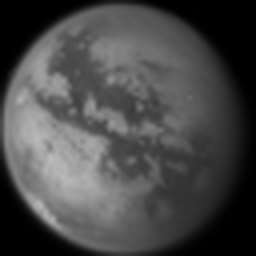
-------------------- |
|
|
|
|
Nov 11 2007, 05:48 PM
Post
#12
|
|
|
Merciless Robot Group: Admin Posts: 8783 Joined: 8-December 05 From: Los Angeles Member No.: 602 |
Wow...
 ...just don't know what to say, man. Those are amazing vistas, obviously of scientific importance as well. ...just don't know what to say, man. Those are amazing vistas, obviously of scientific importance as well.
-------------------- A few will take this knowledge and use this power of a dream realized as a force for change, an impetus for further discovery to make less ancient dreams real.
|
|
|
|
|
Nov 12 2007, 12:49 AM
Post
#13
|
|
 IMG to PNG GOD Group: Moderator Posts: 2250 Joined: 19-February 04 From: Near fire and ice Member No.: 38 |
This is awesome, I'll definitely try this out once I have downloaded some VIMS data in a day or two. An idea: If that feature is not already present, it would be great to be able to generate true color images using data from all of the VIS channels. This should result in more accurate color than the ISS data (as has been discussed in different threads somewhere).
This calibration stuff is remarkable complex. I'm still discovering bugs in my ISS calibration code which is reverse engineered from CISSCAL and some of the calibration documents. It would be interesting to compare our results there. |
|
|
|
|
Nov 12 2007, 07:46 AM
Post
#14
|
|
|
Senior Member Group: Members Posts: 3648 Joined: 1-October 05 From: Croatia Member No.: 523 |
QUOTE (Bjorn Jonsson @ Nov 12 2007, 01:49 AM) An idea: If that feature is not already present, it would be great to be able to generate true color images using data from all of the VIS channels. That feature was the original reason I wrote a tool for processing VIMS cubes. For some obscure reason, though, I get different results depending on whether I use CISSCAL's solar spectrum (originally what I did) or the VIMS solar spectrum cube. Using the CISSCAL one I can get the usual whitepoint for gray bodies (Enceladus, Mimas, Tethys...), while if I divide with the cube I can simply not manage to do that, it either turns yellow or red, depending on whether I divide or multiply in the VIS channel in certain steps (I mentioned this before). As a consequence I removed that part that generates "true" color temporarily until I sort this out. The VIS channel is bad enough in that you need an additional dark current model to not get ugly results. As it currently stands the VIS dark current removal is lacking, usually requiring manual tweaking to either not retain residuals or over-subtract, each resulting in color shifts - the former towards blue color the latter toward green. -------------------- |
|
|
|
|
Nov 14 2007, 10:08 AM
Post
#15
|
|
|
Rover Driver Group: Members Posts: 1015 Joined: 4-March 04 Member No.: 47 |
I assume it would be relatively straightforward to repeat the recent analysis of Adamkovics et al. from telescope data and show the morning drizzle. As far as I can see it's just subtracting images between 2.060-2.070 um (an average might be good enough, maybe) from the same image between 2.027-2.037 um times 0.72 (or some factor close to that depending on the exact shape of the filter used). Although, as is common with Science and Nature papers, it is not quite clear (to me) what they did exactly.
|
|
|
|
|

|
Lo-Fi Version | Time is now: 19th April 2024 - 02:21 PM |
|
RULES AND GUIDELINES Please read the Forum Rules and Guidelines before posting. IMAGE COPYRIGHT |
OPINIONS AND MODERATION Opinions expressed on UnmannedSpaceflight.com are those of the individual posters and do not necessarily reflect the opinions of UnmannedSpaceflight.com or The Planetary Society. The all-volunteer UnmannedSpaceflight.com moderation team is wholly independent of The Planetary Society. The Planetary Society has no influence over decisions made by the UnmannedSpaceflight.com moderators. |
SUPPORT THE FORUM Unmannedspaceflight.com is funded by the Planetary Society. Please consider supporting our work and many other projects by donating to the Society or becoming a member. |
|