Images from JIRAM, A very interesting data set |

  |
Images from JIRAM, A very interesting data set |
 Apr 4 2018, 09:32 PM Apr 4 2018, 09:32 PM
Post
#1
|
||||
 IMG to PNG GOD  Group: Moderator Posts: 2250 Joined: 19-February 04 From: Near fire and ice Member No.: 38 |
It is easy to forget that JunoCam isn't the only instrument aboard Juno that can obtain images. The Jovian Infrared Auroral Mapper (JIRAM) instrument can obtain images in two infrared bands. One of these, centered at a wavelength of 4.78 µm, shows thermal radiation emitted from Jupiter. This radiation is caused by heat from Jupiter's warm interior - as a result there is no difference between the dayside and nightside in these images. Therefore they are great for looking at Jupiter's north pole which isn't visible in the JunoCam images because it is currently winter in Jupiter's northern hemisphere.
Here is a tweened time-lapse created from three JIRAM image mosaics obtained over an interval of slightly less than three hours shortly before perijove 4 on February 2, 2017:  jup_jiram_npole_anim_20170202.mp4 ( 2.11MB )
Number of downloads: 894
jup_jiram_npole_anim_20170202.mp4 ( 2.11MB )
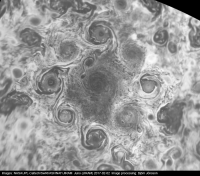
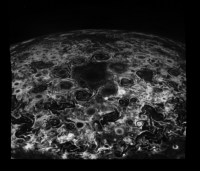
Number of downloads: 894Because Juno was approaching Jupiter the image sharpness increases from start to finish. In case you are unable to play the MP4 file above the time-lapse can also be viewed at Vimeo (the quality is somewhat lower though): https://vimeo.com/263221959 All of the JIRAM images through perijove 6 are available at the Planetary Data System Atmospheres Node and can be converted to PNG files using IMG2PNG. Thousands of images have been obtained by JIRAM. Usually a spacecraft's highest resolution imaging instrument is a visible light camera but Juno is an exception. JIRAM's resolution is higher than JunoCam's. While JIRAM's images are small compared to the JunoCam images (only 432 pixels in the horizontal direction) it has much narrower field of view than JunoCam (5.9 degrees vs. JunoCam's 58 degrees). Combined, this means that the JIRAM images have about three times higher resolution than the JunoCam images but they also cover a much smaller area. Here is a mosaic of Jupiter's north polar region from the data that was used to create the animation above:
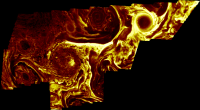
This shows all nine circumpolar cyclones (CPSs) in their full glory. The mosaic shows the north polar region from directly above and is in orthographic projection. It is centered on the north pole. These images have been processed to show details in the areas that appear very dark in the original images. Comparing JIRAM images to visible light (JunoCam) images reveals that the JIRAM images are somewhat similar to inverted visible light images; features that appear bright at visible wavelength are usually dark in 4.78 µm images and vice versa. Because JIRAM has obtained a lot of images, often with an interval of only 30 seconds, they can be animated. Below are two animated GIF examples. First an animation of 186 JIRAM images obtained over a period of 1 hour and 35 minutes on August 1, 2016 from a distance of approximately 8 million km:
And another animation that consists of 145 JIRAM images obtained over a period of 1 hour and 16 minutes on August 26, 2016 from a distance of approximately 1.6 million km. Even though it may look as if the spacecraft is traveling south to north this is not the case; it is the direction in which the spacecraft is looking that changes. The Great Red Spot is clearly visible:
In both of the animations the images have been processed to reveal details in areas that appear very dark in the original data. However, I decided not to remove noise or make the animations more 'stable'. Both because it would have been a lot of work but also because I actually prefer these animations without 'cleanup'. They appear more realistic that way. This is a matter of taste but sometimes less is more when it comes to image processing. |
|||
 |
 
|
|||
|
Apr 5 2018, 12:47 AM
Post
#2
|
|
|
Senior Member Group: Members Posts: 2346 Joined: 7-December 12 Member No.: 6780 |
Here a link to zipped JIRAM RDR imager products, converted to 8-bit PNG, and various synopses as tiles of 10 columns.
|
|
|
|
|
Apr 5 2018, 12:22 PM
Post
#3
|
|
|
IMG to PNG GOD Group: Moderator Posts: 2250 Joined: 19-February 04 From: Near fire and ice Member No.: 38 |
However, depending on what you are doing it may be important to use 16 bit PNGs (especially if you want to reveal details in very dark areas).
|
|
|
|
|
Apr 7 2018, 01:29 PM
Post
#4
|
||
|
IMG to PNG GOD Group: Moderator Posts: 2250 Joined: 19-February 04 From: Near fire and ice Member No.: 38 |
Here is a third animated GIF from JIRAM images. The source images were obtained during the perijove 5 pass on March 27, 2017. The animation consists of 104 frames that cover a period of one hour. Unlike the other two animations which had a frame rate of 30 frames/second the frame rate here is 25 frames/second (30 was too fast). At the start of the animation Juno's distance from Jupiter's center is 167000 km but at the end it has increased to 254000 km.
The processing is identical to the processing I did in the other two animations above. The next step is to make mosaics but that's going to take some time. There are now some very interesting JunoCam images from perijove 12 that I want to work on. |
|
|
|
|
|
|
Apr 7 2018, 03:57 PM
Post
#5
|
|
 Senior Member Group: Members Posts: 1630 Joined: 5-March 05 From: Boulder, CO Member No.: 184 |
A side-by-side IR and visible comparison could be quite revealing in helping to make sense of the clouds, with their varying altitudes and opacity in visible light. There is this release from JPL that shows one way to process a JIRAM image. Depending on JIRAM's resolution, combining IR and visible data can help with deriving 3D cloud fields that could then be rendered from varying perspectives in visible light.
-------------------- Steve [ my home page and planetary maps page ]
|
|
|
|
|
Apr 7 2018, 04:52 PM
Post
#6
|
|||||||
|
Senior Member Group: Members Posts: 2346 Joined: 7-December 12 Member No.: 6780 |
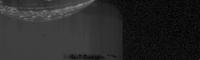
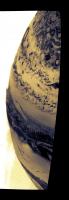
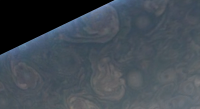
A couple of weeks ago, I stitched some of the JIRAM images, simply using Hugin. But they are flipped. I noticed this too late before PJ12, and after Alberto Adriani's hint:
This has been an early attempt to make JIRAM images like JunoCam images:
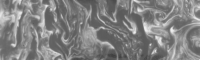
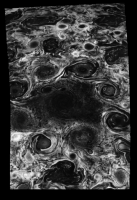
This simple way of stitching with Hugin works only for short sequences of images. Larger sets require proper reprojection, and there are 30 seconds between two consecutive images resulting in cloud displacments. Note also, that the JIRAM imager has several dead pixels. When inverting the data and stretching them heavily, you'll notice residual striping artifacts,... ... and as Björn says, PJ12 is awaiting more processing. JIRAM and JunoCam data appear to be mostly anticorrelated. But near the equator, you can see, that the mesoscale waves are much more distinct at 5 µm than in the visible, and wavelength seem much longer on JIRAM. Also interesting the number and intesity of Io's volcanos, in the lower part of this tile. |
||||||
|
|
|
||||||
|
Apr 8 2018, 08:30 PM
Post
#7
|
|
|
Senior Member Group: Members Posts: 1582 Joined: 14-October 05 From: Vermont Member No.: 530 |
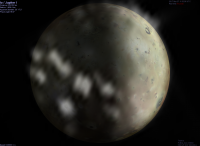
QUOTE (Gerald @ Apr 7 2018, 11:52 AM)  Also interesting the number and intesity of Io's volcanos, in the lower part of this tile. Wow, look at that. Plume at 8 o'clock on the dayside, too. |
|
|
|
|
Apr 8 2018, 10:18 PM
Post
#8
|
||
|
Solar System Cartographer Group: Members Posts: 10157 Joined: 5-April 05 From: Canada Member No.: 227 |
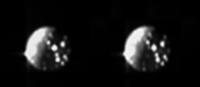
This is a composite of multiple frames of Io, englarged, registered and merged. There were two sequences of slightly different image scale, but pretty much the same geometry.
I must say I wasn't expecting images that good of Io. Phil
-------------------- ... because the Solar System ain't gonna map itself.
Also to be found posting similar content on https://mastodon.social/@PhilStooke Maps for download (free PD: https://upload.wikimedia.org/wikipedia/comm...Cartography.pdf NOTE: everything created by me which I post on UMSF is considered to be in the public domain (NOT CC, public domain) |
|
|
|
|
|
|
Apr 9 2018, 04:14 AM
Post
#9
|
|||
|
Member Group: Members Posts: 306 Joined: 4-October 14 Member No.: 7273 |
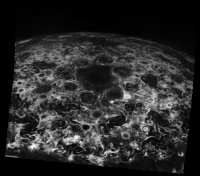
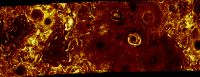
JIRAM image of the south polar pentagon on Perijove 6 (May 19)
To give us an idea of how these correspond to visible cloud features I grabbed a JunoCam polar departure image taken on the same perijove. (Click for animation)
|
||
|
|
|
||
|
Apr 10 2018, 05:23 AM
Post
#10
|
||
 Senior Member Group: Moderator Posts: 3233 Joined: 11-February 04 From: Tucson, AZ Member No.: 23 |
QUOTE (stevesliva @ Apr 8 2018, 01:30 PM) Wow, look at that. Plume at 8 o'clock on the dayside, too. Okay, starting to work with this dataset. Getting some tentative IDs on the volcanoes seen. First, that is not a plume (plumes don't show up well at these wavelengths). Looks like hotspot associated with Loki. Other hotspots visible include Masubi, Shamshu Patera, Kanehekili, Janus Patera, Euboea Fluctus, Heno Patera, (46N, 12W), (26N, 4W), Catha Patera, Uta Patera or Uta Fluctus, Mbali Fluctus (maybe), (11N, 61W), Lei-Zi Fluctus (maybe), and Tawhaki Patera. Brightest sources are Uta, Kanehekili/Janus, and Masubi.
-------------------- &@^^!% Jim! I'm a geologist, not a physicist!
The Gish Bar Times - A Blog all about Jupiter's Moon Io |
|
|
|
|
|
|
Apr 11 2018, 03:37 AM
Post
#11
|
|||
|
Member Group: Members Posts: 306 Joined: 4-October 14 Member No.: 7273 |
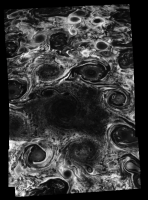
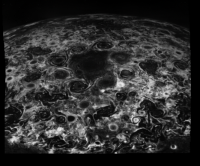
JIRAM mosaic of some of the north polar cyclones
With a roughly aligned JunoCam image for the purposes of feature comparison (click to animate)
I can't fit the upload for the full JunoCam shot that I used for this, but here's the JunoCam team's processed version. |
||
|
|
|
||
|
Apr 11 2018, 10:58 PM
Post
#12
|
|
|
Senior Member Group: Members Posts: 1630 Joined: 5-March 05 From: Boulder, CO Member No.: 184 |
Interesting visible and IR comparisons. Generally the whiter JunoCam clouds are darker in IR and thus colder and higher. Assuming all the clouds are equally opaque, one could make a 3-D version of the JunoCam images with whiter clouds (really the clouds darker in IR) being just slightly elevated in altitude.
-------------------- Steve [ my home page and planetary maps page ]
|
|
|
|
|
Aug 10 2020, 03:44 PM
Post
#13
|
|
|
Junior Member Group: Members Posts: 48 Joined: 9-August 19 Member No.: 8644 |
I played around with Gerald's JIRAM dataset - please enjoy and share this video featuring music by the sublime Max Richter:
https://vimeo.com/446494003 |
|
|
|
|
Dec 20 2020, 12:37 AM
Post
#14
|
|
|
Senior Member Group: Members Posts: 2346 Joined: 7-December 12 Member No.: 6780 |
I finally found time to convert JIRAM IMG files of orbits 09 to 26 into PNG, and updated the website above.
Thus far, I've only provided zipped PNGs, no large synopses, yet. Some of the JIRAM image products consist of two framelets, (presumably) of a 4.5 to 5.0 µm region in the upper half and a 3.3 to 3.6 µm region in the lower half. In those cases, the products I'm providing suffer from the significantly different signal levels making the ~3.3 µm region almost black, if there is a signal in the ~5 µm region. I might find time to fix that issue at some point in the future, but probably not too soon. The 3.3 µm primarily shows aurorae. I think that it's an emission line of the trihydrogen cation H3+, IIRC. I even didn't find enough time yet to take a thorough look at the majority of this large number of images. But what I've seen is beautiful, including images of Io with more than 30 hot spots. Enjoy! There is a lot to discover. |
|
|
|
|

|
Lo-Fi Version | Time is now: 4th May 2024 - 01:33 PM |
|
RULES AND GUIDELINES Please read the Forum Rules and Guidelines before posting. IMAGE COPYRIGHT |
OPINIONS AND MODERATION Opinions expressed on UnmannedSpaceflight.com are those of the individual posters and do not necessarily reflect the opinions of UnmannedSpaceflight.com or The Planetary Society. The all-volunteer UnmannedSpaceflight.com moderation team is wholly independent of The Planetary Society. The Planetary Society has no influence over decisions made by the UnmannedSpaceflight.com moderators. |
SUPPORT THE FORUM Unmannedspaceflight.com is funded by the Planetary Society. Please consider supporting our work and many other projects by donating to the Society or becoming a member. |
|