Printable Version of Topic
Click here to view this topic in its original format
Unmanned Spaceflight.com _ Titan _ Cloud hunting between flybys
Posted by: ngunn Feb 19 2009, 01:59 PM
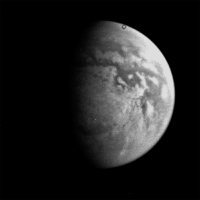
The latest shots of Mezzoramia and environs are nice:
http://saturn.jpl.nasa.gov/multimedia/images/raw/casJPGFullS47/N00131391.jpg
I'm not sure if that's a cloud streak on the left.
Posted by: volcanopele Feb 19 2009, 04:29 PM
Yeah, those are clouds.
Posted by: remcook Feb 19 2009, 07:16 PM
Huh? Are they even aligned E-W? Maybe I'm looking at something else...
Posted by: Juramike Feb 19 2009, 07:56 PM
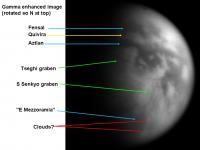
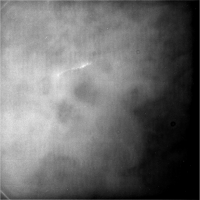
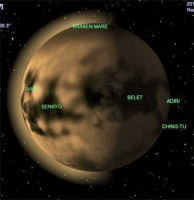
Same image that Nigel posted, but gamma contrasted, rotated, and annotated view. N is roughly towards the top.
|
The cloud streaks are faint vertical in this image (at the end of the red arrows). (Hard to tell absolute orientation at these high latitudes, but I think they might be closer to N-S than E-W).
-Mike
Posted by: belleraphon1 Feb 20 2009, 01:44 AM
Mike...
as always your work blows me away... I have to get a new ink cartridge and print head just to keep up with your Huygens
image products...
Are we not all just chomping at the bit to see how the weather changes come Equinox!!!! Will we start seeing clouds in the 'tropics'?
Craig
Posted by: remcook Feb 20 2009, 08:14 AM
Exactly... did wind patterns change in the troposphere? Or is it the projection?
Posted by: volcanopele Feb 20 2009, 10:11 AM
Before people start speculating too much, those streaks are E-W. They are just a tad close to the limb there.
Posted by: ngunn Feb 20 2009, 11:16 AM
From 'looking ahead' for 103 (and 104 is now there too):
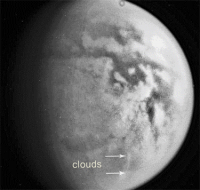
"On Feb. 15, ISS will acquire several satellites observations. These include a nine-hour long observation of Titan where ISS will search for clouds and hopefully watch them move across the southern part of the sub-Saturn hemisphere. This distant observation will also provide an opportunity to look at Mezzoramia, a dark albedo region in Titans mid-Southern latitudes. Distance to Titan varies during this long observation between 1.2 and 1.37 million kilometers"
This suggests that there should be many more images like the one we've been discussing. Were they acquired?
Posted by: Juramike Feb 20 2009, 12:01 PM

Slightly OT, but is there a way to light up a lat/long grid on a planetary body in Celestia?
Also, is there a good surface feature (ISS) map of Titan add-on available for Celestia?
Posted by: helvick Feb 20 2009, 05:11 PM
Custom overlays allow you to do this Mike : http://www.lepp.cornell.edu/%7Eseb/celestia/hutchison/grids.html
Posted by: volcanopele Feb 20 2009, 06:13 PM
Version 1.6, currently in beta, provides support for various overlays, such as body axes, sun direction, and a lat/lon grid.
I have a custom add-on that includes a pair of nice Titan maps that I have been trying to get to more cleaned up state for public release.
Posted by: Juramike Feb 21 2009, 03:51 PM
Well, thanks for the tip. I installed it and now I can do lat/lon grids for everything but Titan.
Posted by: titanicrivers Feb 22 2009, 05:57 PM
However one can easily get a blank grid on a planet (say Mars) in Celestia, save it and using coordinates from an existing Titan map (say PIA02147), layer it on Titan images matching several locations using longitude and latitude. Such was done in the animation below. It helps to have the Titan raw image rotated so North is up, same with the Celestia grid.
By the way those streaks sure look like artifacts to me!
|
Posted by: ngunn Feb 22 2009, 06:57 PM
I think that grid needs rotating clockwise quite a bit.
Posted by: titanicrivers Feb 22 2009, 07:24 PM
HA! (I knew you would catch me!). Been looking at that too. I'm not sure the raw image itself it righted with north up correctly. Lets see what a little tweaking can do.
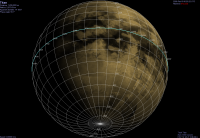
Posted by: volcanopele Feb 22 2009, 07:58 PM
Here is a preview image with a grid:
|
Posted by: titanicrivers Feb 22 2009, 09:11 PM
Wow, awesome VP!
Posted by: ngunn Feb 22 2009, 10:25 PM
That's very nice. Any chance that could be done on 'looking ahead'?
AND
Can you tell us whether that 9 hour cloud imaging campaign on 15th Feb. actually took place? There's still only the one set of 4 images on the public website.
Posted by: claurel Feb 22 2009, 10:32 PM
The problem might be as simple as the cloud layer obscuring the lat/lon grid. Try pressing 'i' to disable clouds.
I've considered modifying Celestia's code a little so that the grid is displayed over the cloud layer. I'm not absolutely convinced that this is a good idea, as it could produce odd looking results for planets with a thin cloud layer (e.g. Mars.) Let me know what you think...
--Chris
Posted by: volcanopele Feb 22 2009, 11:19 PM
AND
Can you tell us whether that 9 hour cloud imaging campaign on 15th Feb. actually took place? There's still only the one set of 4 images on the public website.
Probably not. We are trying to make these look a bit cleaner, a bit more realistic if you will (though obviously, that isn't quite the case with Titan already). Rest assured though that I try to rotate so that north is up in any graphics I use in "Looking Ahead"
And let's... not talk about that imaging campaign... we at least got those 4 images. And those 4 are quite good. But still. Titan hates me. It knows I cheated on it.
Posted by: Juramike Feb 22 2009, 11:31 PM
Oh..wow! That did the trick! And the surface features are revealed as well! Whoo-hoo!
Posted by: titanicrivers Feb 22 2009, 11:41 PM
I've considered modifying Celestia's code a little so that the grid is displayed over the cloud layer. I'm not absolutely convinced that this is a good idea, as it could produce odd looking results for planets with a thin cloud layer (e.g. Mars.) Let me know what you think...
--Chris
You are a genius CC! Pressing the i got rid of the clouds on Titan and there is the superimposed grid and surface. Now to get things aligned better.
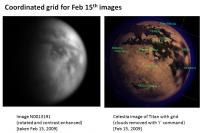
Posted by: Juramike Feb 23 2009, 12:16 AM
Here's a coordinated view between the Cassini Raw (contrast modified) and Celestia:
|
And here is a zoom using Photoshop (magnetic lasso is your friend) to select and detail some of the lat/lon grid:
|
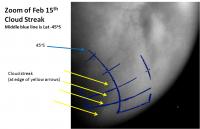
The cloud streak runs from WNW to ESE. From roughly [-45S, 315W] to [-53, 285W]
IIRC, the alignment of this cloud to Mezzoramia is about the same as the alignment of the N Polar cloud to Kraken Mare.
Hmmmmm.....
-Mike
Posted by: Juramike Feb 23 2009, 01:17 AM
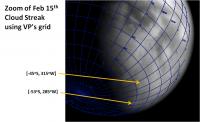
Here is another crop of a contrast-enhanced image, this time overlaid by VP's lat/lon grid (VP's posted image/grid rotated ca. 25 degrees clockwise):
|
(Elba Facula is centered near [-10S, 0])
-Mike
Posted by: ngunn Mar 9 2009, 10:05 PM
Kraken Mare again:
http://saturn.jpl.nasa.gov/photos/raw/rawimagedetails/index.cfm?imageID=185908
Posted by: titanicrivers Mar 20 2009, 12:00 PM
Well I know this is a bit late but I had to make ammends. Nice work by VP and Mike on previous page! The Celestia Titan grid-surface map is nice however when it comes to locating clouds there is likely to be an error as they are considerably above surface level!
Hmmm. Note to editor: I cannot seem to upload my photoshop files anymore. Anyone else having trouble?
Well that time things worked!
|
Posted by: ngunn Mar 20 2009, 01:02 PM
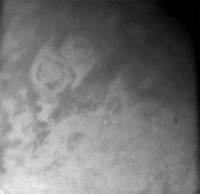
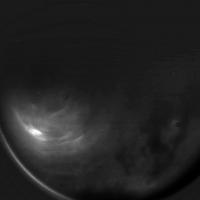
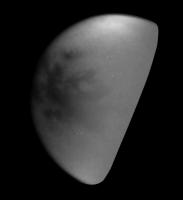
Another beautiful shot of the northern 'dark surface region' emerging from night (appropriately released on our own spring equinox).
http://saturn.jpl.nasa.gov/multimedia/images/raw/casJPGFullS48/N00132269.jpg
Posted by: Phil Stooke Mar 20 2009, 02:18 PM
Here's a bit of a stretch on that one...
Phil
|
Posted by: ngunn Mar 20 2009, 09:59 PM
Thanks for that, Phil. The toe of Italy seems to be falling off. Maybe it was never that well attached? The discovery image of Kraken Mare is annotated with a rather inclusive shoreline despite some bright pixels inside the boundary.
http://upload.wikimedia.org/wikipedia/commons/5/50/Kraken_mare.jpg
Posted by: titanicrivers Mar 21 2009, 07:16 PM
Nice work on this latest Titan image!
Kraken over the last several years appears not to have changed radically. (see images below). I wonder if it has been substantially maintained by the persisting ethane/methane rain clouds of the north pole region (PIA09171), from runoff via inflowing streams visualized in previous SARs (PIA09217) as well as from underground sources via sapping from methanofers. Its persistence may suggest its relatively deep if indeed its liquid.
|
Posted by: ngunn Mar 21 2009, 09:05 PM
Nice one 'rivers. I was hoping someone would pull the Kraken images together to facilitate comparisons. There have been others that you don't show there, including a couple from the last few months. I think it would be a worthwhile project (beyond my skills) to assemble them all.
There are certainly quite obvious superficial differences between the 07 images and the 09 one in your collage, including some in the foot of Italy region. I don't attribute much significance to that yet because there are so many factors other than real surface changes that could affect the tone values in the images.
Posted by: ngunn Mar 26 2009, 12:54 PM
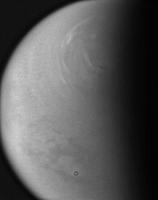
Southern cloud again - is it in the same place? (EDIT: 40S?)
http://saturn.jpl.nasa.gov/multimedia/images/raw/casJPGFullS48/N00132562.jpg
Posted by: titanicrivers Mar 26 2009, 07:14 PM
http://saturn.jpl.nasa.gov/multimedia/images/raw/casJPGFullS48/N00132562.jpg
Quick estimate below: appears to be between -45 and -60 S
|
Posted by: titanicrivers Mar 27 2009, 12:03 AM
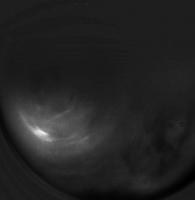
Here is animation of the Titan cloud image mapping to the Celestia grid. In addition to the cloud Hotei arcus stands out, the latter appearing as a fan-shape bright object at the bottom center of the image.
|
Posted by: titanicrivers Mar 29 2009, 09:55 PM
Heres another raw image (N00129016, taken 2-4-09) which displays Hotei arcus nicely!
|
Posted by: titanicrivers Mar 30 2009, 05:53 AM
This a raw image from the Dec 21, 2008 T-49 flyby. The image is an inbound shot from 149,000 km of the Hotei region. ? is this a little cloud streak?
Posted by: Shaka Mar 30 2009, 05:56 AM
Extremely little.
Posted by: titanicrivers Mar 30 2009, 07:12 AM
HA HA lets try that again!
N00126798.jpg was taken on December 21, 2008 and received on Earth December 22, 2008. The camera was pointing toward TITAN at approximately 145,059 kilometers away, and the image was taken using the CL1 and CB3 filters. It appears to show a little cloud train ... but is it or not!
|
Posted by: ngunn Apr 13 2009, 08:12 AM
The current 16 day orbits provide good mid-rev non-targeted flybys that are useful for much more that cloud hunting. Here's Menrva:
http://saturn.jpl.nasa.gov/multimedia/images/raw/casJPGBrowseS49/N00133457.jpg
EDIT: For some reason that one doesn't expand to the full res version. This one does:
http://saturn.jpl.nasa.gov/multimedia/images/raw/casJPGFullS49/N00133456.jpg
Posted by: titanicrivers Apr 17 2009, 07:32 AM
And here is the approximate location of above raw image (slightly enhanced) on the Celestia Titan grid.
|
Posted by: volcanopele Apr 17 2009, 10:17 AM
That's because the other one was a SUM2 image, 512x512 pixels in size.
Posted by: ngunn Apr 29 2009, 09:34 PM
A belated thanks for that explanation.
Clouds again:
http://saturn.jpl.nasa.gov/multimedia/images/raw/casJPGFullS49/N00135075.jpg
Posted by: Phil Stooke Apr 29 2009, 09:57 PM
a bit of contrast fiddling with that last image.
Phil
|
Posted by: Juramike Apr 30 2009, 03:04 AM
I used the MT1 filtered image to subtract away from the combined N00135078 and N00135079 images.
(This idea is based on Jason's abstract; he ratio'd away the MT3 image to correct for the atmospheric lighting effects)
Then I stretched the heck out of the resulting image:
|
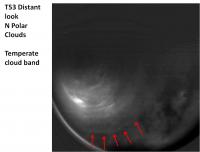
The lowest band (also seen faintly in Phil's image) is at about 40 N.
(Menrva is the lighter gray spot.) I really have no clue what I am talking about.
-Mike
[EDIT: This is the N Polar region]
Posted by: Juramike Apr 30 2009, 03:40 AM
Another uber-stretch with a different set of images N00135074-76, MT1 is N00135077.
|
The lowest arc is still present (and better seen in this set)
|
Posted by: titanicrivers Apr 30 2009, 05:04 AM
Nice work Mike and Phil. Working with Phil's image one can project them on a Celestia grid as below. Most clouds project between 60 and 45 deg latitude.

|
Posted by: Juramike Apr 30 2009, 11:32 AM
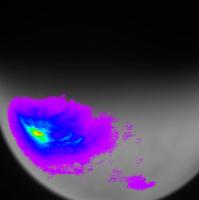
Electric Cloud-O-Vision image of N0013574-76 [MT1 = -77]:
|
(Pseudocolorized areas where polar clouds are brighter than background. Pseudocolor scales to relative cloud brightness; purple=darker clouds/haze, red = brightest cloud/haze)
[EDIT: Image details can be found here: http://www.flickr.com/photos/31678681@N07/3487876831/]
Posted by: Phil Stooke Apr 30 2009, 11:44 AM
I flipped my image in the earlier post to put north at the top. Thanks for the tip, Mike.
Phil
Posted by: ngunn Apr 30 2009, 11:46 AM
It's interesting to see just how localised the very brightest colours are there. Would a single active convection cell look like that? I hope we get some follow-up images.
Posted by: Juramike Apr 30 2009, 01:40 PM
I'm not sure. The overall brightness in that region might be an artifact of the subtraction process between the ISS (CL1/CB3) and the MT1 image.
The overall brightness should be a function of cloud reflection+haze reflection+funky specular components from haze+cloud+atmosphere+surface w/respect to MT1 brightness.
To really see how big the bright cloud part is, it would be necessary to normalize out the bright cloud with respect to the bright haze and bright (specular?) atmosphere.
That should be doable....later....
Posted by: Juramike Apr 30 2009, 02:05 PM
|
|
That came out really nice. How did you do that? Is it a varying gamma across a gradient?
Posted by: Juramike May 1 2009, 07:08 PM
Image from April 29th CL1/CB3 filters that might have a cloud streak near the terminator (at lower latitude)?
http://saturn.jpl.nasa.gov/multimedia/images/raw/casJPGFullS49/N00135148.jpg
Hard to tell...
Posted by: Phil Stooke May 1 2009, 07:19 PM
Mike, I'm not varying gamma or whatever directly. My images of this type are usually - and this one certainly was - made by processing the image in several ways and combining them. I might take the image and make several copies of it. I do two different high pass fllters and contrast stretches on two of them, and patch the edge artifacts from non-high-passed images. I brighten the terminator on a couple of them, by different amounts and with different selection feathering settings. I darken the brightest areas with different settings, enhancements and feather settings. Then I merge them. Artifacts in one processing version are cancelled out by good bits in another.
Phil
Posted by: titanicrivers May 2 2009, 06:54 AM
Its interesting to compare these latest photos with ones recorded by the VIMS instrument and reported at the LPS 2008. The giant polar ethane cloud covered the pole out to 64 degrees N latitude. The edges of the denser cloud bands of the April 29, 2009 photo (using Phils neat enhanced image) appear to have a similar distribution. Question: are clouds seen by ISS CL1 CB3 filter in the north different from the VIMS polar cloud? Can we still infer that the giant polar cloud is still present?

|
Posted by: Juramike May 2 2009, 03:57 PM
Here's a zoomed detail of the April 29 polar images. Lotsa artifacts and clipping...the only improvement is the contrast level between the clouds and the background.
|
Posted by: Juramike May 4 2009, 05:08 AM
I played muchly with contrast gradients to bring out details in the north polar clouds
Here is the result:

|
I also pseudocolorized the brighter polar cloud regions using a UNISYS-style pseudocolor gradient:

|
Subtracting out the MT1 image gives a better view of the overall polar haze.
But by subtracting out an artificial grayscale gradient using the original ISS image itself (gaussian blurring, then minimum blurring, then gaussain again) gave a much better detail of the clouds buried in the haze (since the artificial gradient also takes into account the haze).
A combination of both gives the clouds and the haze, with the cloud details slightly enhanced.
-Mike
Posted by: Juramike May 5 2009, 01:17 AM
Here is a study of different gradient construction techiniques to try to remove the "background" contrast of Titan's atmosphere and other stuff.

|
The idea is that "cloud features" = contrast stretch (ISS combo image - suitable gradient)
Subtracting the corresponding MT1 image (N0013577.jpg) gives a cloud+haze type image. There seems to be "real" structure in the polar haze as seen at the lower latitudes boundary of the haze.
Subtracting an artificial self-gradient made by taking the original image, then Gaussian blurring and Minimum blurring it into smoothness, allows the broad haze to cancel out, revealing the more defined clouds.
Using an inverted hi-pass filter gave OK results, but only in a narrow brightness range. It was also blurrier compared to the artificial self-gradient.
(Swell....She of the Infinite Sarcasm just drifted past and commented "Are you still staring at those mammograms?")
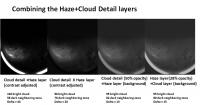
Posted by: Juramike May 5 2009, 04:16 AM
Combining the Haze + Cloud layers. A straight opacity combination works best (less haze, more cloud detail).
|
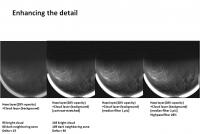
Detail enhancement using a high-pass filter to pop the cloud detail.
|
Final enhancement adjusts curves, then uses MT1, ISS combo, and ISS-MT1 (leveled) to bring up surface and horizon and terminator detail. Custom masks were created for artistic effect.
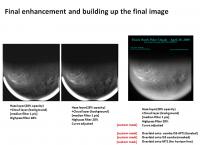
|
-Mike
Posted by: Juramike May 5 2009, 04:22 AM
And the final result (before and after):

|
Posted by: ngunn May 17 2009, 10:33 PM
.
Posted by: Juramike May 28 2009, 01:04 AM
http://saturn.jpl.nasa.gov/multimedia/images/raw/casJPGFullS48/N00132562.jpg
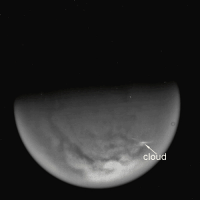
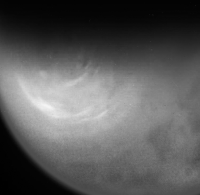
Official image released today as http://photojournal.jpl.nasa.gov/catalog/PIA11501. "Streaking through the South"
Posted by: Juramike May 28 2009, 02:23 AM
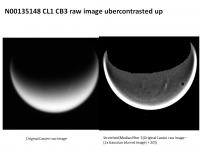
http://saturn.jpl.nasa.gov/multimedia/images/raw/casJPGFullS49/N00135148.jpg
Hard to tell...
Replying to my own post. It is a cloud streak and it is the same one observed previously at the N pole.
Here is the raw image, then an ubercontrasted version side by side:
|
Posted by: Juramike May 28 2009, 02:49 AM
Here is an attempt to coordinate and animate the April 28 and April 29 images to see N Polar streak cloud evolution over time:
|
(click to animate)
I tried to use the larger rounder 'blob' and the light circular streak as the reference points.
This is kinda ugly due to changing viewing geometry and different lighting.
But, if I got this right, it looks like the biggest brightest blob is catching up to the second brightest blob.
-Mike
Posted by: titanicrivers May 28 2009, 07:07 AM
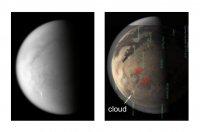
|
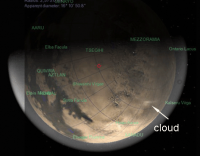
Photojournal PIA11501 image (left) and original raw image N00132562 (right) rotated and the latter blended with a Celestia grid (as in post # 33). Should be possible to collect several images of this area from this year and create another movie of cloud motion around the S polar region.
Posted by: Juramike May 31 2009, 02:52 PM
Another set of clouds from the May 28 observations. These are near Ganesa Macula around 50 N latitude:
I used a slightly different technique to bring out cloud detail. (I'm trying to find a systematic, non-manually intensive way to do this easily. Just using a high-pass filter has issues due to the gradient).
Here is the before and after image:
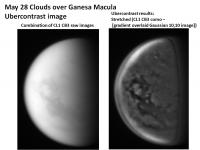
|
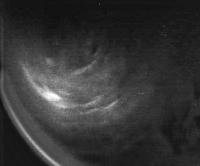
Here is an annotated image using Celestia. Cloud streaks indicated by solid red arrows, tentative cloud streaks with dotted red arrows.
The orientation of some of the streaks is not lined up with the latitude lines, some appear slightly tilted WNW-ESE.
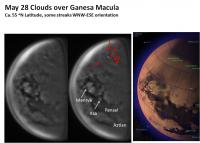
|
The final combined image and the exact recipe I used for processing (all the nerdly details) can be found here:http://www.flickr.com/photos/31678681@N07/3581082151/
Posted by: Juramike Sep 12 2009, 03:20 PM
Most recent set of images post T-61 of Belet taken on Sept 10 ubercontrasted.
Contrast enhanced (Combo CL1 CB3 images - CL1 MT3 image), then masked out to remove artifacts. Cropped and rotated so that N is at top.
|
(The little bright dots all in a line indicate hot pixels that line up due to spacecraft motion from one CB3 image to the next. They were pretty handy guides to make sure the MT3 image was coordinated).
Posted by: Juramike Sep 27 2009, 12:40 AM
Animated sequence of images taken Sept 23 of the N Polar region. These are six images taken by the CL1 CB3 filter that have been aligned.
|
(Animated GIF - click to animate)
No cloud changes can be seen, only small changes due to perspective and exposure.
-Mike
Posted by: Juramike Sep 27 2009, 01:52 AM
Sept 23, 2009 Cloud images:
Aligned layer stack with hi-pass filtering:
|
Ubercontrasted image:
|
And a wickedly contrast-stretched image to try and show the high latitude dark lanes:
|
-Mike
Posted by: titanicrivers Sep 30 2009, 02:49 AM
Nice enhancements Mike. I think Kraken is visible. Here's my effort to show the same with some coordinates and an outline to help out.
|
Posted by: ngunn Sep 30 2009, 09:05 PM
Well, well - I just took a stroll over to 'Mike Brown's Planets' and what should I find but this. My printer will be busy for the next few minutes and myself for a bit longer! (We're both rather slow.)
http://www.gps.caltech.edu/%7Embrown/papers/ps/vimsclouds_final.pdf
Posted by: titanicrivers Sep 30 2009, 11:05 PM
http://www.gps.caltech.edu/%7Embrown/papers/ps/vimsclouds_final.pdf
Indeed! Thats one of the papers I referred to in my posts in 'Non-targeted flyby Sept 22, 2009' see post #20. You should also read the Rodriquez paper I have posted there (abstract I think) as Brown has serious issues with that Nature paper. The cloud distribution figure in post # 23 and post # 27 are from the 2nd Brown paper I listed in post #20. http://lanl.arxiv.org/abs/0809.1841
Posted by: ngunn Oct 1 2009, 07:44 AM
Aah I thought so, but what I hadn't realised was that your second link went to a full paper - I only tried the first one. Oh well, I suppose it might be handy also to have the link in this thread which is a more long term topic than the other one. Now if one of the authors would supply a free link to the other paper we'd have the full deal.

Posted by: remcook Oct 1 2009, 02:01 PM
The Rodriguez paper:
http://arxiv.org/abs/0907.0606
Posted by: ngunn Oct 1 2009, 03:10 PM
Thanks remcook! And on seeing that I now realise it has been on Jason B's website all along  so here's the pretty version:
http://barnesos.net/~jbarnes/publications/papers/2009.6.Nature.Rodriguez.Prime.Mission.Clouds.pdf
Posted by: Jason W Barnes Oct 2 2009, 07:45 PM
so here's the pretty version:http://barnesos.net/~jbarnes/publications/papers/2009.6.Nature.Rodriguez.Prime.Mission.Clouds.pdf
Heh -- I probly shoulda said somethin' earlier

Glad to be of service,
- Jason
Posted by: ngunn Oct 2 2009, 09:32 PM
UNQUOTE: No, that was just me being stupid, and anyhow I'm probably one of only a few interested parties without easy access to the journals.
Glad to be of service
Ahem. While you're on the line, I still haven't seen the Huygens landing site VIMS image without those annoying annotations. Have I missed a paper there too?
Posted by: Jason W Barnes Oct 2 2009, 09:43 PM
Lets see . . . That was T47, right? Those data are public now, so it should be kosher to leak the image. Lemme check with the author and see what the status of the paper is and whether I should leak it or make you wait for the paper
- Jason
Posted by: Juramike Aug 18 2010, 11:36 PM
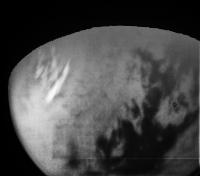
Seems like an appropriate place to put a recent observation of an equatorial cloud. Right there near Sotra Facula.
http://saturn.jpl.nasa.gov/photos/raw/rawimagedetails/index.cfm?imageID=225159
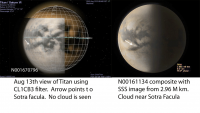
Posted by: titanicrivers Aug 19 2010, 03:21 AM
Absolutely !!! Looking back at August 13th images (see left below) shows no apparent cloud feature over Sotra Facula. The CL1CB3 filter images from August 17th (see below on right) now shows what appears to be a cloud. The coordinates of the cloud are approx. 10 S latitude and 40 W longitude.
|
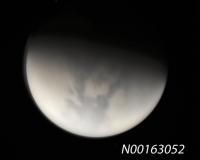
Posted by: titanicrivers Sep 14 2010, 04:50 AM
Images from Rev 137 cloud monitoring taken Sept 10, 2010 did not seem to show significant clouds. Enhanced CL1 CB3 image below (N00163052) displays the Adiri and Belet areas.
|
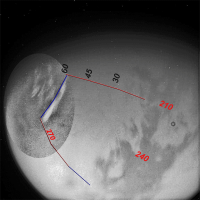
Posted by: titanicrivers Sep 21 2010, 07:33 AM
Titan images N00163165 CL1 UV3 with its northern band and ? southern polar band and N00163162 CL1 CB3 surface views from Sept 13th are colorized and shown with Celestia surface and label overlay view. No distinct clouds were visible. Kraken can just be seen in the CL1 CB3 view. Images rotated so North is up.
|
Posted by: Juramike Sep 22 2010, 03:31 AM
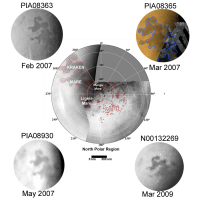
Graphic that shows cloud locations on Titan from July 2004 to April 2010: http://photojournal.jpl.nasa.gov/catalog/PIA13401
Posted by: volcanopele Sep 22 2010, 06:00 AM
They certainly have a... permissive definition for "cloud". I never really counted that ethane stuff in the north.
Posted by: remcook Sep 22 2010, 07:23 AM
Yes, a bit confusing, as the other plot in that press release ( http://saturn.jpl.nasa.gov/news/cassinifeatures/feature20100921/ ) does show north polar tropospheric clouds, but I guess they're talking about the ethane cloud.
Posted by: Juramike Sep 22 2010, 01:33 PM
How did they define cloud coverage? Actual pixel density (cloud thickness), or binary y/n there is a change in expected pixel value?
(Would a thick heavy cumulus cloud count the same as a thin stratus cloud?)
Posted by: centsworth_II Sep 22 2010, 05:00 PM
(Would a thick heavy cumulus cloud count the same as a thin stratus cloud?)
And what about fog? Or thog (tholins + fog)?
Posted by: titanicrivers Sep 22 2010, 07:29 PM
http://www.gps.caltech.edu/~mbrown/papers/ps/vimsclouds_final.pdf
The best discussion I have found on this and contrasting views of Brown and Rodriquez on cloud density etc. can be found in the above article.
Powered by Invision Power Board (http://www.invisionboard.com)
© Invision Power Services (http://www.invisionpower.com)