Ceres Geology |

  |
Ceres Geology |
 Jan 25 2014, 11:44 PM Jan 25 2014, 11:44 PM
Post
#16
|
|
|
Member  Group: Members Posts: 102 Joined: 8-August 12 Member No.: 6511 |
An interesting question I haven't seen addressed: what's happening to the water?
Obviously most of it is being lost to space. But even with Ceres' weak gravity, you'd expect some water to recondense at "cold traps" -- cooler spots on Ceres' surface, i.e. in shadowed crater bottoms and at the poles. The technical term for this is "volatile transport", and we see it in some other places in the Solar System, like Jupiter's moon Callisto. (That's why all the impact craters on Callisto's icy surface look slumped and eroded.) If even 1% of the water vapor were to be recaptured, it would accumulate in the polar regions at a rate of a micron or two per year. That may not sound like much, but over astronomical time you'd see meters of accumulated condensation. But we don't see that. Ceres is a very dark body (its albedo is around 0.06, almost as dark as fresh asphalt) and water frost is bright. There are lighter patches on Ceres, but there don't seem to be bright ice caps at the poles. In a little while we'll know more. Patience... Doug M. |
 |
 
|
|
Jan 26 2014, 01:26 AM
Post
#17
|
|
 Senior Member Group: Members Posts: 3419 Joined: 9-February 04 From: Minneapolis, MN, USA Member No.: 15 |
Speaking of behaviors of processes over astronomical timeframes always runs the risk of ignoring the nature of relatively short-term phenomenah which occur in bursts and blurps. (For example, the overall process of accretion over a 4.6-billion-year period resulted in the Earth-Moon system, but the day of the Big Whack created, in mere hours, the conditions resulting in the current system, its angular momentum, Earth's rotational period, etc.)
If non-homogeneous concentrations of volatiles exist within Ceres' outer crust, maybe water ice spurts and sublimates for a few thousand years and then stops, then later methane ices do the same thing over a few thousand years, etc. Each episode of volatile transport would have its own effect on the surface coatings at the poles and in other cold traps, depending on the specific volatiles being transported and how they react to sunlight and radiation over time, etc. Ceres being so much closer to the Sun than the Jovian and Saturnian moons, it's hard to make direct comparisons, but it's possible that Ceres has (or had) a wider range of volatiles than the moons we've observed, and definitely sees a higher solar constant than do the outer planet moons. These would seem to be important factors, too. As you say, though, much will become more clear as we approach Ceres with Dawn and get some of the hard data that will let us answer some of these questions. -the other Doug -------------------- The trouble ain't that there is too many fools, but that the lightning ain't distributed right. -Mark Twain
|
|
|
|
|
Jan 26 2014, 12:04 PM
Post
#18
|
|
 Member Group: Members Posts: 495 Joined: 12-February 12 Member No.: 6336 |
@Doug M
Previous to this observation, there had been one observation that found small amounts of water vapour over the north pole. That lead to a speculation that there might be polar caps of water ice. These older observations get a mention in the Dawn mission page at NASA even, and also at this AAS meeting quoted here. So cold traps at the poles is a clear possibility, even actual polar caps - the question is the amount. The Dawn mission page use the phrase "seasonal polar caps" whereas the later paper states "substantial ice deposits on shadowed crater slopes ". |
|
|
|
|
Jan 26 2014, 07:13 PM
Post
#19
|
|
|
Member Group: Members Posts: 293 Joined: 22-September 08 From: Spain Member No.: 4350 |
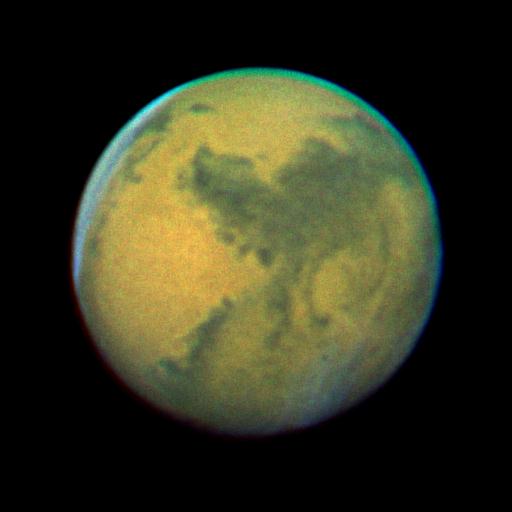
Any chance of telling if these localized sources correlate with the bright spots in Hubble images?
|
|
|
|
|
Jan 26 2014, 07:35 PM
Post
#20
|
|
|
Senior Member Group: Members Posts: 2106 Joined: 13-February 10 From: Ontario Member No.: 5221 |
According to the map in the Nature paper, yes they do (scroll down to figures).
http://www.nature.com/nature/journal/v505/...ature12918.html |
|
|
|
|
Mar 12 2015, 01:08 PM
Post
#21
|
|
|
Member Group: Members Posts: 107 Joined: 1-August 14 Member No.: 7227 |
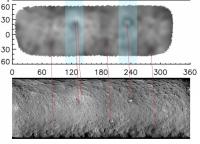
Map of supposed water vapour spots:
 http://www.nature.com/nature/journal/v505/...ature12918.html  http://www.esa.int/Our_Activities/Space_Sc...rf_planet_Ceres Recent (march 2015) map:  http://www.scientificamerican.com/slidesho...res-slide-show/ |
|
|
|
|
Mar 12 2015, 07:30 PM
Post
#22
|
||
 Member Group: Members Posts: 716 Joined: 3-January 08 Member No.: 3995 |
Corresponding features:
|
|
|
|
|
|
|
Mar 13 2015, 08:21 AM
Post
#23
|
||
|
Member Group: Members Posts: 107 Joined: 1-August 14 Member No.: 7227 |
QUOTE (Gladstoner @ Mar 12 2015, 08:30 PM)  Corresponding features:
I don't know how to check if the two images use same coordinates system.  |
|
|
|
|
|
|
Mar 13 2015, 09:42 AM
Post
#24
|
|
|
Member Group: Members Posts: 107 Joined: 1-August 14 Member No.: 7227 |
Recent paper:
"THE POTENTIAL FOR VOLCANISM ON CERES DUE TO CRUSTAL THICKENING AND PRESSURIZATION OF A SUBSURFACE OCEAN." http://www.hou.usra.edu/meetings/lpsc2015/pdf/2831.pdf QUOTE interior evolution models for Ceres [e.g. 2-5] suggest that differentiation is likely, forming a layered structure with a rocky interior (possibly with a separated iron core), overlain by water and ice layers. Furthermore, these models suggest that there is sufficient heat available that a liquid water layer could survive under an icy exterior to the present day. I can't yet understand where this heat come from. Does "[e.g. 2-5]" mean "references from [2] to [5]"?. QUOTE Because ice takes up a larger volume than the equivalent mass of water, the freezing of liquid water onto the base of an icy shell will cause the shell to expand slightly and lead to tensile stress in the shell. This also has the effect of increasing the pressure in the ocean, possibly to the point of driving liquid to the surface. So the model suggests NOT that there's enough heating to create a water geyser (as I supposed), but there's a "squeezing" of the ocean by the ice crust. QUOTE For Ceres (r= 475 km), which is intermediate in size between those bodies, we assume as our initial condition that the rocky core is ~300 km in radius with an overlying ocean and an icy shell 25 km thick. This corresponds to the state of Ceres 500 Myr after its formation in the models of [5]. In the models of [5], the shell thickens over the subsequent 4 Gyr at an approximately linear rate of ~20 km/Gyr. QUOTE cracks can propagate to at least 200 km depth, which is about the maximum possible thickness of an ice shell for Ceres. QUOTE for every 1 km of thickening of the shell, approximately 25 m of liquid could erupt over the entire surface but beware of QUOTE The requirement that the ice layer behave like an intact, elastic shell could pose a problem, especially in the case where the tensile strength of ice is exceeded well before the ocean pressure is sufficient to drive material to the surface.
|
|
|
|
|
Mar 13 2015, 02:07 PM
Post
#25
|
|
|
Senior Member Group: Members Posts: 2346 Joined: 7-December 12 Member No.: 6780 |
QUOTE (mcgyver @ Mar 13 2015, 10:42 AM) I can't yet understand where this heat come from. Here my try: Assumptions: Ceres' radius: r = 475 km = 4.75e5 m Ceres' shape: approximately spherical Ceres' mass: m = 9.43e20 kg Ceres' mean surface temperature: T1 = 168 K Temperature below ice layer (using the melting point of water): T2 = 273 K Thickness of ice layer: L = 25 km = 25e3 m Approximated thermal conductivity of ice: k = 2.0 W/(m K) Simplified assumption for K-40 decay: 1.311 MeV per atom are released on decay to Ca-40 = 1.311e6 * 1.602e-19 J = 2.10e-13 J Half-life of K-40: t_1_2 = 1.248e9 years = 3.938e16 s Mass of 1 mole K-40: 0.03996 kg Ratio of K-40 to K total: 120 ppm = 1.2e-4 Calculations: Surface area of Ceres: A = 4 pi r² = 4 pi * 475 km = 2.84e6 km² = 2.84e12 m² Thermal conductance of the ice layer: G = k A / L = 2.0 W/(m K) * 2.84e12 m² / 25e3 m = 227e6 W/K. Transfered power: P = G * (T2 - T1) = 227e6 W/K * (273 K - 168 K) = 227e6 W/K * 105 K = 23.8e9 W = 23.8 GW Decaying ratio of K-40 per second: (1 - (1/2)^(1s/t_1_2))/s = (1 - (1/2)^(1s/3.938e16 s))/s = (1 - (1/2)^2.5391e-17)/s = 1.76e-17 / s Mean power per K-40 atom per second = (1.76e-17 / s) * 2.10e-13 J = 3.696e-30 J/s = 3.696e-30 W Number of K-40 atoms to provide transferred power: 23.8e9 W / 3.696e-30 W = 6.44e39 = 1.07e16 * 6.022e23 = 1.07e16 mole. Mass of K-40 to provide transferred power: 1.07e16 * 0.03996 kg = 4.276e14 kg. Mass ratio of K-40 needed to provide transferred power: 4.276e14 kg / 9.43e20 kg = 4.53e-7. Mass ratio of K needed to provide transferred power 4.53e-7 / 1.2e-4 = 3.78e-3 = 0.378% As a comparison: Potassium makes up about 2.6% of the weight of Earth's crust. Links to data, notions, and formulas: http://en.wikipedia.org/wiki/Thermal_conductivity http://en.wikipedia.org/wiki/Thermal_conduction http://en.wikipedia.org/wiki/Ceres_%28dwarf_planet%29 http://en.wikipedia.org/wiki/List_of_thermal_conductivities http://en.wikipedia.org/wiki/Potassium http://en.wikipedia.org/wiki/Isotopes_of_potassium http://en.wikipedia.org/wiki/File:Potassiu...ecay-scheme.svg http://en.wikipedia.org/wiki/Potassium-40 http://en.wikipedia.org/wiki/Electronvolt http://en.wikipedia.org/wiki/Mole_(unit) http://en.wikipedia.org/wiki/Sphere#Surface_area http://en.wikipedia.org/wiki/Half-life#For...ponential_decay |
|
|
|
|
Mar 13 2015, 03:30 PM
Post
#26
|
|
|
Member Group: Members Posts: 495 Joined: 12-February 12 Member No.: 6336 |
Nice work there Gerald, really good even.
I really tried to find a mistake there, but you seem to have made a good estimate. A layer of liquid water might be possible, especially if there's small amounts of other radioactive elements adding to the energy budget as well. Before reading the paper mcgyver linked, I never did take the pressurisation into account, so I capitulate to the idea that Ceres indeed could have one subsurface ocean - but I still not saying it's there, even though I bet 'some' website featuring space related news quite likely will make a bold statement of 'discovery' any day after this. =) |
|
|
|
|
Mar 13 2015, 03:59 PM
Post
#27
|
|
|
Senior Member Group: Members Posts: 2346 Joined: 7-December 12 Member No.: 6780 |
QUOTE (TheAnt @ Mar 13 2015, 04:30 PM) I really tried to find a mistake there, ... Thanks a lot for the review! There is always a risk to make a mistake with this lot of numbers. |
|
|
|
|
Mar 14 2015, 01:56 PM
Post
#28
|
|
|
Member Group: Members Posts: 495 Joined: 12-February 12 Member No.: 6336 |
QUOTE (Gerald @ Mar 13 2015, 04:59 PM) Thanks a lot for the review! There is always a risk to make a mistake with this lot of numbers. So you thank me for trying to show you're wrong.  Well serious, it's a good back-of-the-envelope kind of calculation to show the idea is worth considering. To actually get to the bottom of things (silly pun intended) one have to go quite further to include the pressure of the water down there, some numbers provided in the paper. That gives how the water might rise in the tube even in the very low gravity of Ceres. It is at that point these guys from the Planetary Science Institute, CIT and JPL adds the fact that there should be heavier material on top of the ice sheet covering Ceres that increase the pressure further. Then adding at least a partial melting of ice, at the highest part the tube. Here I am lazy and enter my own calculations made for the aquifers in a lime rock environment that keeps flowing trough the winter in sub arctic conditions. the flow of water here is a magnitude lower in general, and the strongest flow I got just barely is the same ballpark (4 litres/s) as the measurements made by Herschel. But I still don't get this to work, if water have frozen out and it ended up with one of a handful of pockets with water of very high salinity - perhaps. Or more heat is needed, meaning the presence of heat produced by the decay of some other long lived elements. Salts also would prevent freezing in the tube, and even melt some ice of lower salinity in the lower parts. And at that point I realise that some press releases have been mentioning salts and not ice as one explanation for the bright spots. They certainly have done the calculations better than me, even so it was one interesting exercise to get a glimpse of how the planetary scientists have been thinking. |
|
|
|
|
Mar 15 2015, 01:33 AM
Post
#29
|
|
|
Junior Member Group: Members Posts: 45 Joined: 12-February 15 Member No.: 7397 |
QUOTE (mcgyver @ Mar 13 2015, 10:42 AM) Recent paper: "THE POTENTIAL FOR VOLCANISM ON CERES DUE TO CRUSTAL THICKENING AND PRESSURIZATION OF A SUBSURFACE OCEAN." http://www.hou.usra.edu/meetings/lpsc2015/pdf/2831.pdf Coincidence or not, that paper appears to have been released on March 1, more than two weeks ahead of next week's Lunar and Planetary Science Conference, and a day after I proposed the same volcanism-driving mechanism in post #542, on the 'Dawn approaches Ceres' topic. They make no mention of salt deposits though, as a consequence of the release of seawater, hence I expect we'll see evidence of that in spectral results from Dawn. Final confirmation of volcanism should occur by May or June, when central pits show up in those bright spots. |
|
|
|
|
Mar 15 2015, 03:08 AM
Post
#30
|
|
|
Solar System Cartographer Group: Members Posts: 10229 Joined: 5-April 05 From: Canada Member No.: 227 |
"Final confirmation of volcanism should occur by May or June, when central pits show up in those bright spots."
...could occur, if central pits show up... Phil -------------------- ... because the Solar System ain't gonna map itself.
Also to be found posting similar content on https://mastodon.social/@PhilStooke Maps for download (free PDF: https://upload.wikimedia.org/wikipedia/comm...Cartography.pdf NOTE: everything created by me which I post on UMSF is considered to be in the public domain (NOT CC, public domain) |
|
|
|
|

|
Lo-Fi Version | Time is now: 26th September 2024 - 08:44 AM |
|
RULES AND GUIDELINES Please read the Forum Rules and Guidelines before posting. IMAGE COPYRIGHT |
OPINIONS AND MODERATION Opinions expressed on UnmannedSpaceflight.com are those of the individual posters and do not necessarily reflect the opinions of UnmannedSpaceflight.com or The Planetary Society. The all-volunteer UnmannedSpaceflight.com moderation team is wholly independent of The Planetary Society. The Planetary Society has no influence over decisions made by the UnmannedSpaceflight.com moderators. |
SUPPORT THE FORUM Unmannedspaceflight.com is funded by the Planetary Society. Please consider supporting our work and many other projects by donating to the Society or becoming a member. |
|