Printable Version of Topic
Click here to view this topic in its original format
Unmanned Spaceflight.com _ Mars _ New Phobos Names
Posted by: volcanopele Dec 5 2006, 08:48 PM
There are a few new names for use on Phobos. These include Grildrig (Corona?) and the craters Clustril, Drunlo, Flimnap, Gulliver, Limtoc, Reldresal, and Skyresh.
Any chance of a map with these names? 
Posted by: Phil Stooke Jan 25 2007, 07:12 PM
The map showing these names should be available within a few days. It has taken some effort to obtain.
Phil
Posted by: ElkGroveDan Jan 25 2007, 07:46 PM
Those names sound Tolkienesque.
Posted by: Phil Stooke Jan 25 2007, 08:11 PM
I was the author of an alternate nomenculatural scheme for both Phobos and Deimos, derived from the Iliad and other classical sources, but the IAU rejected it.
Phil
Posted by: Bob Shaw Jan 25 2007, 08:58 PM

They sound like naasmarg to me!
Bbo hawS
Posted by: mcaplinger Jan 25 2007, 11:40 PM
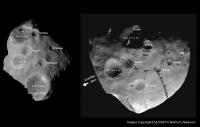
http://planetarynames.wr.usgs.gov/images/Phobos_comp.pdf
Seems a little odd that these names (which are all from GULLIVER'S TRAVELS) are on Phobos when Swift is on Deimos. But the Illiad would have been more appropriate on one of the Saturnian satellites (The Odyssey is being used on Tethys.)
Posted by: PhilCo126 Jan 26 2007, 05:22 PM
Ah, the Moons of Mars
in Greek mythology, Phobos and Deimos were the horses pulling the chariot of Mars, the god of war. The Romans called Phobos Pavor and Deimos Pallor in their god worship.
Two years ago I wrote, with the help of Philip Stooke and Ralp Turner,
an article on mapping the Martian moons.
Those UMSF readers interested in it, can send me an e-mail 

Posted by: Phil Stooke Jan 26 2007, 07:27 PM
Phobos and Deimos are referred to in the Iliad, hence the connection. The real problem was that the Working Group didn't like the military association. A member, supporting me, tried to sell the Iliad as a love story, but they didn't buy it.
This map Mike linked to was the one we were waiting for. Neukum only gave permission yesterday.
Phil
Posted by: AlexBlackwell Jan 26 2007, 07:30 PM
That's like trying to sell http://en.wikipedia.org/wiki/Lolita as a children's story
Posted by: Phil Stooke Jan 26 2007, 08:19 PM
Well, it starts out as a love story. The rest is just filler.
Phil
Posted by: Bob Shaw Jan 26 2007, 10:43 PM
Phil
Phil:
I *hope* that's not Lolita you're describing!
On a more, er, heavenly note: are the Phobos names based on MEX observations of new features?
|
Bob Shaw
Posted by: stevesliva Jan 27 2007, 12:26 AM
The denizens of the flying island of Laputa in Gulliver's Travels had discovered two moons of mars... and Gulliver was published well before the satellites were actually discovered. So, neat.
However, Laputa was left out as a place name perhaps because it means "The Whore" in Spanish. Too bad.
Posted by: PhilCo126 Jan 27 2007, 10:22 AM
Indeed;
Remarkably, the idea that the planet Mars might have two satellites was also introduced in the books " Gulliver's Travels " by Jonathan Swift (1726), " Die Geschwinde Reise auf dem Luft-Schiff nach Obern Welt " by Eberhard Kindermann (1744) and " Micromégas " by Voltaire (1750).
Earlier, Johannes Kepler, believer in the harmonic numerology of the solar system,made the assumption of 2 moons for Mars and 4 moons for Jupiter.
Thanks Bob for sharing that remarkable photo!
Posted by: Phil Stooke Jan 27 2007, 02:38 PM
The image bases are from Mars Express, but the craters were known before from Viking (and in some cases even Mariner 9). None of them were discovered in Mars Express images.
Phil
Posted by: chuckclark Feb 28 2008, 11:52 PM
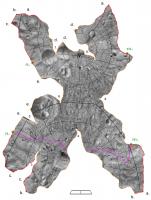
Here is a constant-scale natural boundary map of Phobos; primary ridges are the map edge. A poster by Pam Clark, Phil Stooke and me to be presented at lpi week after next. this one doesn't fold to a very good likeness because it is a very compact map. I'll post another in a minute with extensive ridge boundary, which, I say with confidence although
I haven't had a chance to fold it up yet, will fold to a good likeness of Phobos.

|
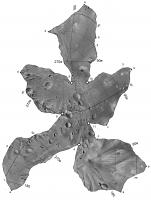
Posted by: chuckclark Feb 28 2008, 11:54 PM
here is the highly interrupted constant-scale natural boundary map of Phobos
|
Posted by: PhilCo126 Feb 29 2008, 12:07 PM
Reading this Phobos-related topic I wanted to ask if anyone read the speculative 1960s story claiming that Phobos might be a hollow planetary object. I believe this speculation tried to explain the fact that phobos is speeding up in its orbit. In fact for Mars-Phobos, the Roche Limit is estimated as 10,800 km but Phobos orbits at 9000 km (inside the limit!). This is because the Roche Limit does not take into account the strength of the material of the object. With this in mind, the best estimate is that the Roche Limit is about 5000 km. Once Phobos comes within this, the moon will be destroyed by tidal forces. A strong moon indeed...
Posted by: jasedm Mar 5 2008, 03:38 PM
Thank you Chuck Clark for your cut-out map for Phobos. I printed it off on a large scale on my work plotter yesterday, and it's simply awesome!!
I thoroughly recommend this to other UMSF'ers.
Posted by: imipak Mar 6 2008, 06:34 PM
Hope no-one's posted this on another thread
 but - thanks to UMSF - as I now read the Planetary Society blog every day[1], I noticed Emily Lakdawalla just published http://www.planetary.org/blog/article/00001348/ on turning the map into a cardboard model. w00t! I'll be storing that one up for my niece & nephew's visit this Easter.
[1] I also joined TPS due to arch comments from Doug E
Posted by: Juramike Mar 6 2008, 07:15 PM
Thank you very much, both Chuck Clark and Emily.
This is going to be an awesome project with the nieces and nephews!
(I couldn't wait and just tried with scissors and tape and normal paper. Made a slight mess, but otherwise came out pretty good! I really like how Stickney crater just naturally puckers in!)
Posted by: chuckclark Mar 13 2008, 08:38 PM
Yes, Emily is not only a good writer -- she taught me the term "seam slice"-- she is also adept at handcraft; I've yet to try assembling one with glue, I'll bet it improves the appearance. Emily's suggestions for which side to leave the tab are also spot on.
I heard she was here in Houston at the start of the week, but I didn't get a chance to thank her for the nice article.
Here is the companion cut'n'fold map of Deimos.
My sister has me put a little bent-wire hanger into a small hole poked into the folded form's north pole and she uses them each december to decorate the christmas tree. A little more work and we'll have a complete solar system.
Phil Stooke says I'm to do Ida next.
Asfor the other, more compactly arranged maps of Phobos and Deimos (only one is posted here so far (above, also of Phobos), but there is also a valley-edged map (the thematic inverse of the Ridge-edged map), and similar for Deimos.
The interesting thing, to me at least, is that these compact maps also fold up; not to good representations of the originating objects but rather to quite curious forms not unlike an apple turnover (the valley edged maps) and a conic-ish tetrahedroid. I don't know what to make of these curious forms, but when was the last time something novel arose in mathematics -- this I claim for world maps with constant-scale natural boundaries -- and it failed to be meaningful?
All in all, though, it's quite encouraging to see the interest in these foldable asteroid maps.
Thank you all.
Chuck
|
Posted by: chuckclark Apr 18 2008, 02:34 PM
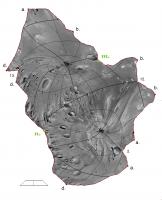
Here in a series of email are the other constant-scale natural boundary maps of Phobos and Deimos. I'll describe the particulars of map boundary with each post, but all will be more conventionally map-like than the above CSNB maps, that is, these will be compact maps (without extensive lobes). Thus, unlike the above highly interrupted maps, these are more usable as maps.
The organizing principle of this series was the proposition of P. E. Clark, who seeks a methodical approach to asteroid categorization and wonders if a methodical approach to making CSNB maps will lead to same. In each case the central feature, the mid-region of each map, is the object's blunt end (the 180 degree meridian). The boundary of each map is variously a ridge or a valley; specifically the highest ridge or lowest valley, each system sharing a common end point, a saddle, specifically the object's two primary saddles.
Phobos and Deimos are captured asteroids, thus like our moon they have a near side and a far side. This has a great impact (sorry) on morphology. Sorry I
didn't realize this soon enough to mark out on these maps which side is which. I'll update the maps when I get time, but -- more fun, and maybe more useful -- I ought to redesign these maps with that characteristic in mind.
Note that CSNB mapping gives me the freedom to design and redesign the map based on physics and observable characteristics, without bothering with the traditional and usually not vary satisfactory rigmarole of abstract mathematical projection formula. Handy feature, no?
Asteroids, by the way, in their topography are particularly good examples, admirably simple examples, of minimal systems of critical points, the peaks pits and saddles (and the numerical relationship between them) worked out by J Clerk Maxwell in his classic paper of 1875, Hills and Dales. Nice, how these asteroids have two peaks (the extremes of equatorial rotation), two pits (the poles), and two saddles (where ridges and valleys intersect).
Having said that, let me digress to point out that these compact CSNB maps, unlike conventional compact maps, still have the "I'm foldable" property. They just don't fold to anything that looks like Phobos or Deimos. I've now made enough of these CSNB maps, and the consequent folded forms, to begin to see trends:
maps made from a trees with only two ends (the line of interruption is a single line; no branches) fold to apple turnoverish objects; maps made from trees with more than two ends (the line of interruption is a branching tree) -- when the number of ends is small, i.e., three or four or five -- fold to objects which resemble irregular platonic solids with the corresponding number of points.
When the tree has many branches and the branch-system does NOT spread extensively around the object, the folded form is, to crib a term from Isaac Azimov, an "essentially globular object" with fingers. But when the tree has many branches AND the branch-system spreads extensively around the object the folded form resembles the object. The more branches and the more extensive the system, the better the folded form resembles the object. Thus the maps above are good (but not perfect; more about this in a minute) representations of the respective moons.
Nothing too surprising about that last example. The metric parameter of constant-scale at the edge, and the physical parameter of the edge being a natural boundary insures the result. But to me these folded forms made from CSNB maps made from trees with low numbers of branch ends are a delightful puzzle. What's going on? Anyone who has folded up these maps surely noted, when beginning folding a branch-end, the similarity to folding a cone; then is each map an ensemble of cones? Or perhaps it's a just clever derivative of Albrecht Durer's unfolded platonic solids? Or maybe it's a profound extension of Albrecht Durer's unfolded platonic solids, to use the art historian Erwin Panofsky's term for it, "prototopological" cartography? Maybe it's something new in mathematics to think about, or maybe I'm just fascinated that I can develop forms without using any customary orthography or perspective (ray trace) point-plotting.
Think about this:
In the case of the two-end tree, the one that generates maps that fold to apple turnovers (the valley-bound maps):
If the edge were to lose its azimuth preservation, its wigglyness, the map would be a circle with the same perimeter as the wiggly map (remember the edge is constant-scale, so it can't stretch), the folding points would be diametrically opposite and the folded form would be a flat semicircle (zero volume). We all know that given a constant length, the circular shape encloses the largest area. So the wiggly map fits inside the circular map; the two dimensional area of the intersection of the two maps is (somehow!) an indicator of the apple turnover's volume.
I've no insights yet into the higher order forms.
Any of this of interest to anybody?
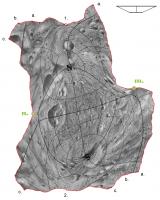
Well, that's the digression. Here's Phobos, bound by valley (Clark's choice was that portion of valley to the south of the primary saddles):
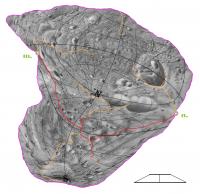
|
Posted by: chuckclark Apr 18 2008, 02:36 PM
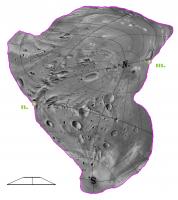
and here's Phobos bound by ridge:
|
Posted by: chuckclark Apr 18 2008, 02:39 PM
Deimos, bound by valley:
|
Posted by: chuckclark Apr 18 2008, 02:40 PM
Deimos bound by ridge:
|
Posted by: SickNick Jun 8 2008, 02:28 PM
Regarding the "success" or "failure" of each folded map to match the *real* object - if you look at the "apple turnover" versions, the sub-cells within them are clearly highly distorted with elongate craters and enforced lineations. I would not expect these to fold-up to a good representation of the original due to this distortion. In the better versions, the fit is better and the distortion less.
Ultimately, you will exceed the limit of what is possible with 2D paper, in trying to fit the 3D surface...
Posted by: chuckclark Mar 30 2009, 02:06 PM
Ultimately, you will exceed the limit of what is possible with 2D paper, in trying to fit the 3D surface...
Okay. I'm a little slow to pick upon things, but what I've done -- in the case of the elongate craters -- is make an error of the cartographer (my subjective goof); I have NOT displayed an error of the cartography (an objective inability of the projection system [constant-scale natural boundaries] to accurately represent shape). I don't doubt this is also true for "enforced lineations," but I'm not sure exactly where and to what SickNick refers.
My error of cartography was in marking off the graticles filling in the outline: I failed to reduce them in scale fast enough as they moved inward from the map's constant-scale edge. Notice how crater elongation is parallel (roughly parallel) to map edge. If I'd shrunk the most inward part of the map more, this would have produced more circular (true shape) craters. Since I'm working these by longhand, old-fashioned geometry, and these objects are irregular, it becomes deucedly complicated to keep up with accurate scale in any map's middle portions. When (assuming when) this system is computerized, this error bar will tank. The only sectors of the map where conformality fails is in regions near hinge points, the points where you begin to fold adjoining lobes.
When SickNick says "I would not expect these to fold-up to a good representation of the original due to this distortion" he misses the point. These do not fold up to good representations of the original because the boundary (the map edge), relative to the object, is short. What happens inside the outline is irrelevant to the folded shape. I could have swirled the graticles beyond recognition, or -- far better! -- I could have sized them accurately to eliminate elongate craters (everywhere except very near a hinge point), but the folded object made by the map would be the same in either case.
And when SickNick says "Ultimately, you will exceed the limit of what is possible with 2D paper, in trying to fit the 3D surface...", I'm not sure that is true. A fine use of csnb maps made with short boundaries is that the resultant map is a compact shape. That is, a shape which is a desirable feature in a map. So it is highly useable as a map, especially because -- even in these imperfect examples -- shape distortion and size distortion are much, much less than that available with conventional projections. And when "trying to fit the 3D surface..." the trick is to employ a boundary set which is both well-branched and wide-spread on the object. And since these are irregular objects, and the branches (the line of interruption, where the orange unpeels) may grow as far as we like, it may be possible to make the sheet of paper exactly fit the object. At least in theory. Or so I'm told, by people whose job it is to know these things.
All I really do is unpeel oranges.
Posted by: JohnVV Oct 1 2009, 06:38 AM
and i thought i was getting some odd shapes for Phobos from " cam2map "
but i think i will stick too a .obj instead of a paper cut out.
[attachment=19139:PhobosBlender.png]
Posted by: chuckclark Oct 1 2009, 11:18 AM
well, JohnVV, you do so at the sacrifice of tactile and kinesthetic sensory experience (sense of touch and motion).
Remember, no one but you is making you choose between the two.
I admit that the picture inside the magic box (computer monitor) is way more realistic than the facsimile you can make with this particular constant-scale natural boundary paper cut out, but I fear you are seduced by the cheap thrill, the easy accessibility to apparent reality that our sense of sight sets us up for by its overwhelming dominance of the other senses. A blindered focus of attention on the sense of sight sets you up to be the unwitting patsy at the poker table of discovery. You are going to overlook crucial things, patterns or relationships. Prone to overlook, at least. You may be the exception.
But as a scientist (or for that matter a poet, but don't let me get onto a tangent), over the long term, you'll be better served by cultivating the sensitivity of all your senses. Use the wonderfully fascinating, richly detailed visual illusion inside the computer monitor, but also put one of these CSNB-models together; get your hands involved in a meaningful way.
That's the argument for the folded form. Now the argument for world maps:
That digital image (or my crude folded model for that matter), however enchanting it may look, doesn't let you see the whole surface at once. And yet for many puzzles well worth solving -- global patterns in the lineaments on Eros, for instance; drainage and other types of gravity flow (as lava) on Mars for another -- world maps are vital. They let you analyze the entire surface comprehensively. Now it so happens that in the our era of extensive planetary exploration and awareness, and especially so in the case of lumpy asteroids, the mapping methods bequeathed to us by history and convention are not such useful tools as we might wish for revealing large scale patterns. The general trend has been to rely less and less on world maps and more and more on our fancy new digital images. Or, to put it accurately, to rely on our intuition and (short-term) memory to synthesize, to spot large scale patterns subjectively.
Nothing wrong with that; all benefit by maximizing our facilities in Renaissance-era skills. Great strides were (and are) made by accessing our representational tool kit. But the representational manner of studying things, the unique viewpoint, our everyday method of seeing, is an illusion. By relying on representation, we are prey for the magician, the mistaken and the misguided.
Whence we are well served by the facts of analysis, the objective clarities of a full unveiling, the comprehensiveness of world maps. That's why I continue to advocate http://rightbasicbuilding.com/ for constant-scale natural boundary world maps, either inside the monitor or on your tabletop.
If I use a more extensive boundary set for a CSNB map, the folded form will be much closer to the real thing. And if, as I've done with the compact CSNB maps (above), I use a restricted boundary set, I generate a world map showing the entire surface within the context of -- organized by -- my boundary set. The compact maps above use the uppermost major ridges or the lowermost major valleys; the shape of the maps signify the particular geomorphology of each.
not to say that that Phobos image of yours is not a lovely thing.
Powered by Invision Power Board (http://www.invisionboard.com)
© Invision Power Services (http://www.invisionpower.com)