Temperature and pressure at Gale, Suitable (for short periods) for liquid water? |

  |
Temperature and pressure at Gale, Suitable (for short periods) for liquid water? |
 Nov 1 2012, 03:37 PM Nov 1 2012, 03:37 PM
Post
#61
|
|
|
Member  Group: Members Posts: 507 Joined: 10-September 08 Member No.: 4338 |
QUOTE (MichaelT @ Nov 1 2012, 02:46 AM)  Does anybody know if it possible to access past data as well? If you view the page source for marsweather.com in html and follow some links, you can find the Sol data in xml format at http://data.marsweather.com/rems_climate.xml, but you may want to check with marsweather.com as to what their policy is on credit notices if you post a rendering of the data elsewhere. You can post a message on their blog asking questions like that. |
 |
 
|
|
Nov 1 2012, 04:16 PM
Post
#62
|
|
|
Member Group: Members Posts: 156 Joined: 18-March 05 From: Germany Member No.: 211 |
Thanks Marsophile!
 That is exactly what I had been unable to find! I do not plan to post diagrams. It is purely out of personal interest. Maybe I will will use a graph for a presentation in a few weeks where I will certainly acknowledge the source of the data. Otherwise I will ask just as you recommend. Cheers Michael |
|
|
|
|
Mar 6 2013, 09:23 AM
Post
#63
|
|
 Senior Member Group: Members Posts: 2428 Joined: 30-January 13 From: Penang, Malaysia. Member No.: 6853 |
Has anyone been able to extract usable REMS data from the first MSL PDS issue (Sols 0-89)?
Edit : I can locate TAB files (eg ACQ_M1) and can open these in EXCEL, but they appear to only contain START_BYTE and BYTE data according to the associated FMT file, am looking for air and ground temperatures / pressure / wind speed etc. I am probably barking up the wrong tree, and I may have to convert the BYTES into values, but have been barking up that tree for most of the day without a lot success (so far anyway) Apologies if this is in the wrong thread... EDIT : Thanks for feedback djellison and jmknapp |
|
|
|
|
Mar 6 2013, 04:25 PM
Post
#64
|
|
|
Founder Group: Chairman Posts: 14432 Joined: 8-February 04 Member No.: 1 |
No - as the PDS release clearly states, they are releasing raw data - not the calibrated science data.
It is - as yet - of no use to us. |
|
|
|
|
Mar 6 2013, 08:05 PM
Post
#65
|
|
 Senior Member Group: Members Posts: 1465 Joined: 9-February 04 From: Columbus OH USA Member No.: 13 |
The columns are listed in this file:
http://atmos.nmsu.edu/PDS/data/mslrem_0001/LABEL/ACQ.FMT Looks like signed integers mostly with negative values given as 32768-65535. The associated data file is the biggest one in each folder, e.g., for sol 89: http://atmos.nmsu.edu/PDS/data/mslrem_0001...00ACQ____M1.TAB -------------------- |
|
|
|
|
Mar 6 2013, 08:57 PM
Post
#66
|
|
 Senior Member Group: Members Posts: 4246 Joined: 17-January 05 Member No.: 152 |
Mods - shouldn't these last few posts go in the PDS thread?
ADMIN NOTE: Mmm? Probably OK here as the original question and subsequent answers are pertinent to the topic. |
|
|
|
|
Mar 7 2013, 02:14 AM
Post
#67
|
||
|
Senior Member Group: Members Posts: 1465 Joined: 9-February 04 From: Columbus OH USA Member No.: 13 |
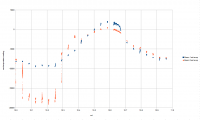
Took a look at an air temperature curve from the uncalibrated REMS data.
Sol 10 data file (comma-separated): http://atmos.nmsu.edu/PDS/data/mslrem_0001...00ACQ____M1.TAB Column descriptions: http://atmos.nmsu.edu/PDS/data/mslrem_0001/LABEL/ACQ.FMT Extracting the columns for the two boom air temperature sensors B1_AIR_Temp and B2_AIR_Temp yields this plot for sol 10:
I picked sol 10 because it can be compared with a calibrated air temperature plot released during one of the telecons: http://www.nasa.gov/mission_pages/msl/mult...a/pia16081.html Not sure what's going on with Boom 2, but comparing the Boom 1 curve with the calibrated curve shows a good match shape-wise up to sol 10.6. At that point it looks like for some reason they drew a straight line to the start of sol 11. Anyway, since the minimum of the calibrated curve is about -90°C and the maximum about 3°C, and the min/max of the uncalibrated curve is -9512/2028, a rough formula to convert the Boom 1 uncalibrated values to °C is: T = 0.00806*n - 13.3 -------------------- |
|
|
|
|
|
|
Mar 7 2013, 07:20 AM
Post
#68
|
|
|
Senior Member Group: Members Posts: 2428 Joined: 30-January 13 From: Penang, Malaysia. Member No.: 6853 |
QUOTE (jmknapp @ Mar 7 2013, 10:14 AM) Took a look at an air temperature curve from the uncalibrated REMS data... Many thanks for pointing me in the right direction Joe. Hopefully the anomalies on the temperature values from the other boom are not an indication of more issues with the REMS instrument package. Hopefully we won't have to wait too long for the calibrated data to be issued. |
|
|
|
|
Mar 7 2013, 12:23 PM
Post
#69
|
|
|
Founder Group: Chairman Posts: 14432 Joined: 8-February 04 Member No.: 1 |
QUOTE (PaulH51 @ Mar 6 2013, 11:20 PM) Hopefully we won't have to wait too long for the calibrated data to be issued. Again -as the PDS release schedule states "Part 2, March 20, 2013, will include the derived data products (RDRs) for Sols 0 though 89 for the APXS, ChemCam, DAN, Hazcam, Navcam, and REMS instruments, along with both the EDRs and RDRs for the CheMin and RAD instruments, and the RDRs for the SAM instrument." |
|
|
|
|
Mar 7 2013, 12:56 PM
Post
#70
|
|
|
Senior Member Group: Members Posts: 1465 Joined: 9-February 04 From: Columbus OH USA Member No.: 13 |
March 20th would put it during their upcoming conference.
In the meantime, here's a page for showing Boom 1 temperature plots for sols 1-89, using the rough conversion above to convert to Celsius: Curiosity temperature plots, sol 1-89 -------------------- |
|
|
|
|
Mar 7 2013, 01:37 PM
Post
#71
|
|
|
Senior Member Group: Members Posts: 2428 Joined: 30-January 13 From: Penang, Malaysia. Member No.: 6853 |
Thanks Joe, I envy your skills in extracting the data and creating those multi-page charts,
I compared around 10 of the sols with the min / max levels reported by the web based Mars weather reports. No precise matches (especially on the 'min' values), not all together surprising as I have long suspected the standard of what they have reported. Thankfully the 20th is very close, I look forward to seeing the calibrated data from NASA / JPL.. Thanks again Joe |
|
|
|
|
Mar 7 2013, 03:28 PM
Post
#72
|
|
|
Founder Group: Chairman Posts: 14432 Joined: 8-February 04 Member No.: 1 |
The REMS instrument isn't a NASA/JPL instrument - it's from the Centro de Astrobiología, Spain
|
|
|
|
|
Mar 7 2013, 09:01 PM
Post
#73
|
|
|
Senior Member Group: Members Posts: 1465 Joined: 9-February 04 From: Columbus OH USA Member No.: 13 |
It'll be interesting to compare to the calibrated results to see how involved that process is, or if it's just linear. One thing that strikes me is the frequent spikes/dips of up to about 10 degrees over a short period of time. Could these be "real"? Maybe warmer air from the RTG fins wafts over from time to time?
-------------------- |
|
|
|
|
Mar 7 2013, 11:44 PM
Post
#74
|
|
|
Senior Member Group: Members Posts: 2428 Joined: 30-January 13 From: Penang, Malaysia. Member No.: 6853 |
QUOTE (djellison @ Mar 7 2013, 11:28 PM) The REMS instrument isn't a NASA/JPL instrument - it's from the Centro de Astrobiología, Spain Spanish instruments, but the REMS data (according to the Centro de Astrobiología web site) will be issued by NASA /JPL through its PDS portal. |
|
|
|
|
Mar 8 2013, 08:33 AM
Post
#75
|
|
 Senior Member Group: Members Posts: 2228 Joined: 1-December 04 From: Marble Falls, Texas, USA Member No.: 116 |
QUOTE (jmknapp @ Mar 7 2013, 06:56 AM) ... here's a page for showing Boom 1 temperature plots for sols 1-89, using the rough conversion above to convert to Celsius: Curiosity temperature plots, sol 1-89 That is so cool. Might you be willing to create a way plot the data across multiple sols? -------------------- ...Tom
I'm not a Space Fan, I'm a Space Exploration Enthusiast. |
|
|
|
|

|
Lo-Fi Version | Time is now: 1st May 2024 - 06:27 PM |
|
RULES AND GUIDELINES Please read the Forum Rules and Guidelines before posting. IMAGE COPYRIGHT |
OPINIONS AND MODERATION Opinions expressed on UnmannedSpaceflight.com are those of the individual posters and do not necessarily reflect the opinions of UnmannedSpaceflight.com or The Planetary Society. The all-volunteer UnmannedSpaceflight.com moderation team is wholly independent of The Planetary Society. The Planetary Society has no influence over decisions made by the UnmannedSpaceflight.com moderators. |
SUPPORT THE FORUM Unmannedspaceflight.com is funded by the Planetary Society. Please consider supporting our work and many other projects by donating to the Society or becoming a member. |
|