Printable Version of Topic
Click here to view this topic in its original format
Unmanned Spaceflight.com _ Cassini PDS _ Titan PDS Image Products
Posted by: Bjorn Jonsson Oct 4 2012, 01:11 AM
Following recent discussion in http://www.unmannedspaceflight.com/index.php?showtopic=7477 on Titan's polar vortex and visible atmospheric features (including what looks like faint 'cloud belts') I decided to take a look at the PDS data. The main reason is that it's possible get get much better results for low contrast targets like Titan by using the PDS data than the raw JPGs. I found some interesting images obtained on April 19, 2011; rev 147. This rev was previously discussed http://www.unmannedspaceflight.com/index.php?showtopic=6945 when the Titan flyby was happening.
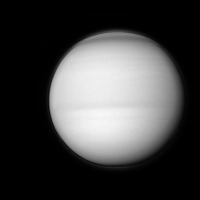
Here is a sharpened BL1 WAC image obtained at a range of 137,000 km. The subspacecraft latitude is 0.2 degrees:
|
North is up. Different parts of the image have been processed with different unsharp masks. Low contrast east-west 'cloud belts' are apparent and these are definitely real features. Interestingly, they are not perfectly east-west oriented but instead appear a bit 'curved'. This is not a perspective effect and also Cassini was only 0.2 degrees north of Titan's equator.
It might be possible to squeeze even more details out of comparable VIO images. The problem is that they appear awfully mottled and my 'standard' calibration/flatfielding didn't remove this. I probably need to make extra flats to get rid of this effect.
Posted by: remcook Oct 4 2012, 12:14 PM
It is known that the rotation axis of the stratosphere is tilted with respect to the rotation axis of the surface by about 4 degrees, which might explain some of the curvature in the bands you see.
Further reading:
http://adsabs.harvard.edu/abs/2008Icar..197..549A
http://adsabs.harvard.edu/abs/2009Icar..203..242R
http://adsabs.harvard.edu/abs/2010P%26SS...58..792T
http://adsabs.harvard.edu/abs/2010P%26SS...58..814T
Posted by: TheAnt Oct 4 2012, 03:42 PM
Oh drat! That image just had be reclassify Titan as a gas giant. 
Serious: Absolutely first class work there, and yes I see that curvature also, insightful remark there on those 4 degrees remcook it almost look like a tad more.
Could the seasons offset the weather pattern further?
Posted by: JRehling Oct 4 2012, 05:29 PM

Titan's atmospheric dynamics are far from understood. Unlike Earth, where there is one dominant condensate which undergoes little chemistry aside from state changes, Titan's atmosphere has at least about a dozen significant components which can in some cases condense into gas, in some cases into solid, which react with one another, with ultraviolet light, altitude, and temperature.
Not only is this not fully understood, it's honestly difficult to imagine an experimental regime that could even try to explore all of the potential dynamics. /n/ chemicals means on the order of /n/^2 possible interactions, where the interactions may be physical (e.g., droplets of one compound condensing on nucleating solid particles of another) as well as chemical. You have vertical and horizontal transport, polar atmosphere going through Earth-years of continuous daylight/darkness at some altitudes and latitudes, but not at others. Intermittent inputs such as meteors and lightning. Unknowably complex interactions with the surface (whose composition is largely unknown) and liquifers (whose composition and is somewhat unknown; and, whose physical structure is considerably unknown).
On top of which, while the dominant molecules in most other worlds atmospheres have two or three atoms per molecule, Titan has organic compounds in huge molecules. It might be a challenge even to describe one *droplet* of Titan haze, and that may be wildly different than another droplet from another altitude/latitude/season/time of day.
Titan's atmosphere is complex on an order you don't often see in science outside of the biological sciences. Frankly, I speculate that it would take something of a Manhattan Project to work out all the important details, in terms of earthly work as well as flying missions there.
Titan may be even more interesting in terms of the philosophy of science than it is in terms of planetology. How does one even grapple with this sort of complexity?
Posted by: Bjorn Jonsson Oct 4 2012, 07:31 PM
Thanks - I checked this by rendering a striped sphere with a 3D renderer and the curvature of the bands is consistent with a tilt of ~4 degrees.
Posted by: TheAnt Oct 5 2012, 03:35 PM
Titan may be even more interesting in terms of the philosophy of science than it is in terms of planetology. How does one even grapple with this sort of complexity?
Thank you for your long reply JRehling. Yes the molecular weight for the compounds found in such particles at various levels would be quite different.
This does not mean we might find a good average for each - but I agree that we most likely would need a balloon mission before we can make any really good guesstimates for a good model. So Titan is a complex moon indeed.
Now compared to a living cell, I still think the cell is more complex. And to borrow one example from another part of the biological sciences - I think the Titan atmosphere will turn out to be more predictable than the behaviour of a single species. I have dabble a bit with such.
Now it is risky to make comparisons from such widely separate fields though, but I will make one more.
While there's a show on a certain cable channel about mega machines, I do view Titan as the largest test tube there is.
Posted by: Juramike Oct 5 2012, 04:10 PM
One of the really difficult things about Titan chemistry is simulating the long path length of excited state molecules. At those low pressures, the molecules go for very long ways before colliding with another molecule. That time between collisions could allow the excited-state molecule to drop to a different excited state all on it's own (intrasystem crossing).
This is hard to simulate in a small laboratory apparatus.
Posted by: Eyesonmars Oct 5 2012, 04:43 PM
An observation/question.
I would assume Titan does not have a strong grip on its atmosphere.
If true, it should be sensitive to variations in solar radiation..
Saturns current orbital eccentricity causes something like a 20% seasonal variation in solar flux.
Does saturns orbital eccentricity vary over time ? ( can't find any info on this)
If so, has this been a significant factor in the evolution of Titans
's atmosphere ???
Posted by: remcook Oct 5 2012, 05:52 PM
I think this paper is what you are looking for:
http://www.gps.caltech.edu/~oa/publications/aharonson2009_naturegeo.pdf
Answer seems to be yes
Posted by: Bjorn Jonsson Oct 7 2012, 07:41 PM
It turns out that this is a very interesting set of images to work with. Here is an RGB composite from the same sequence as the BL1 image in the first message in this thread (actually the blue data here is from that image):
|
Not too impressive but looking closely there are some very low contrast features near the center of the disc that are actually surface features. This becomes evident when looking at a CB3 image from the same sequence for comparison:
|
There are also some subtle color differences in the RGB image. By processing the RGB image to make the average color of the central ~75% of the disc gray and then greatly boosting the color saturation these color differences become obvious and the surface features become more apparent as well:
|
The southern hemisphere is bluer than the northern hemisphere and the color transition is remarkably sharp and distinct. Also the north polar region is significantly redder than other parts of the disc, including the south polar region which is remarkably different from the north polar region. This image may also suggest that in the southern hemisphere the atmosphere is less transparent at visible wavelenghts but I'm not sure because of the following versions which is the RGB image sharpened with an unsharp mask - no attempt was made to bring out color differences:

|
This image also reveals that the dark features are darker than the bright terrain at red wavelengths but at green and blue wavelengths the difference is negligible. I don't know if this is simply a 'side effect' from Rayleigh scattering (the surface features are much easier to see at long wavelengths).
And to end this, a very different version of the RGB image. This one has been processed to show the limb haze more clearly:
|
A really fascinating dataset.
Posted by: ugordan Nov 4 2012, 03:11 PM
The high altitude haze has become much more pronounced at the limb recently. While playing around with some mutual event datasets, I noticed two separate Titan-Dione mutuals were taken at almost exactly the same phase angle, but were separated by 20 months time. Whereas in early 2010 the high altitude haze was very visible only around the north pole, in late 2011 it was prominent across the limb. The Cassini team already reported drastic changes in haze layer altitudes, this actually makes it difficult to center two temporally distant snapshots on Titan "proper", but here's a http://www.flickr.com/photos/ugordan/8153966505/sizes/o/in/photostream/ showing changes in appearance registered as best as I could. Phase angles were 61.6 deg and 61.0 in April 2010 and December 2011, respectively. Both were rescaled to 2x the pixel scale of the 2011 snapshot and rotated so north is roughly up.
Speaking of haze, here's one high phase view with an unsharp filter applied to bring out layering in the haze:
http://www.flickr.com/photos/ugordan/8047864768/in/photostream/
I think it was looking near the north pole, along the crescent roughly at 11:30 o'clock position in http://space.jpl.nasa.gov/cgi-bin/wspace?tbody=606&vbody=-82&month=12&day=13&year=2011&hour=13&minute=28&rfov=45&fovmul=-1&bfov=50&showsc=1&showac=1.
Posted by: JRehling Nov 5 2012, 07:11 PM
The complexity of that image, the non-monotonic variations in density, adds considerably to my overall impression that the complexity of Titan's atmosphere makes it almost incomprehensible. That sort of complexity seen in earthly clouds is a spatial complexity of (primarily) just a few compounds, notably water. On Titan, where ultraviolet radiation drives chemistry, it's humbling to consider how chaotic the 3-D structure of chemical processes may be, swirling and twisting at any given moment, changing from time of day and altitude and season. It's marvelous and daunting.
Posted by: Juramike Nov 6 2012, 08:39 AM
Titan's chemical complexity goes waaaaay beyond Earth's boring atmosphere. Check out the chemical variation in this press release: http://solarsystem.nasa.gov/scitech/display.cfm?ST_ID=2247
Posted by: rlorenz Nov 6 2012, 01:41 PM
|
|
A really fascinating dataset.
Well, quite. Modern tools make this kind of color visualization nice and easy, but of course the fact that the surface is faintly visible at red wavelengths, and that the limb-darkening varies with wavelength, etc. was quantitatively established with Voyager and HST quite some time ago....
Posted by: Bjorn Jonsson Jan 9 2014, 12:31 AM
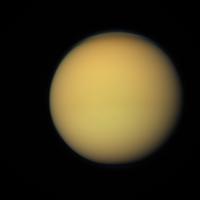
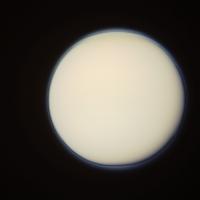
Here are two semi-randomly selected narrow angle RGB composites from the latest Cassini PDS release (January 1, 2014). These are approximately true color images. First this one from rev 183 on March 14, 2013:
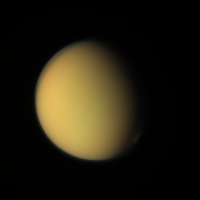
|
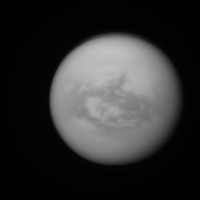
And this one is a high phase view from rev 184 on March 19, 2013:
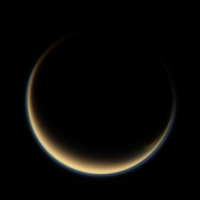
|
The color difference between the two images is real and is largely due to the change in phase angle.
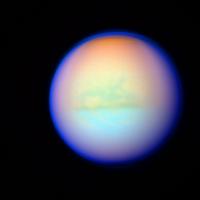
And finally an enhanced version of the first image to better show the south polar collar and the limb haze:
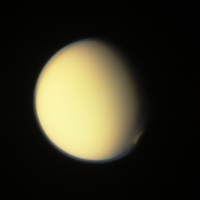
|
Powered by Invision Power Board (http://www.invisionboard.com)
© Invision Power Services (http://www.invisionpower.com)