Perijove 1 (PJ1), August 27, 2016 |

  |
Perijove 1 (PJ1), August 27, 2016 |
 Sep 20 2016, 07:14 PM Sep 20 2016, 07:14 PM
Post
#76
|
|
|
Senior Member  Group: Members Posts: 1582 Joined: 14-October 05 From: Vermont Member No.: 530 |
QUOTE (Brian Burns @ Sep 20 2016, 07:39 AM)  This is probably my favorite image from Juno so far - nice colors Kind of neat how there are clear cyclones and anticyclones on the same image. One type light the other dark. |
 |
 
|
|
Sep 21 2016, 08:18 AM
Post
#77
|
|
 Junior Member Group: Members Posts: 54 Joined: 7-July 16 From: Austin, Texas Member No.: 7991 |
QUOTE (Gerald @ Sep 20 2016, 08:00 AM) To stay independent, I've written another system (also in C++, like ISIS3), with additional calibration capabilities, but specific for JunoCam, and not designed under shipping, usability or extensibility considerations. That is great - I might wind up having to write something using OpenCV to handle the Voyager image projections also, as ISIS seems to be written with clarity in mind, rather than speed, as far as I can tell - which is fine, but there a lot of images to process, so if OpenCV is faster that will be helpful. |
|
|
|
|
Oct 27 2016, 06:53 PM
Post
#78
|
|
|
Junior Member Group: Members Posts: 22 Joined: 13-October 13 Member No.: 7013 |
QUOTE (xosema @ Sep 4 2016, 02:12 PM) Hi all. I'm not sure if this should be posted in this thread... first post of mine, anyway, after years registered. I think it would be didactic to compare Earth with Jupiter in the polar images and then made this (posted in a blog, but I don't know if it would be nice to put url here). [attachment=40082:Jupiter_...hoemaker.jpg] (Credit: NASA / JPL / SwRI / MSSS / NEAR-Shoemaker / Crastinia) It would be very nice if you could post this on the missionjuno site - it's rare to see the earth's south pole compared to Jupiter's. (-: |
|
|
|
|
Nov 28 2016, 06:46 PM
Post
#79
|
||
|
Senior Member Group: Members Posts: 2346 Joined: 7-December 12 Member No.: 6780 |
A preliminary collage of a global background map from Marble Movie images, with merged PJ1 maps in the foreground:
The northern part matches roughly, the southern part can be off about 15 degrees longitude. There are several inaccuracies in the image; some of them make it beautiful. Therefore I'm posting this intermediate version. Link to the full version. And here some more making of. (I'll upload the full version to missionjuno, after preparing some caption.) |
|
|
|
|
|
|
Dec 3 2016, 11:35 PM
Post
#80
|
||
|
Senior Member Group: Members Posts: 2346 Joined: 7-December 12 Member No.: 6780 |
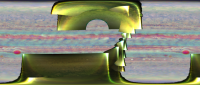
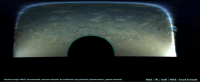
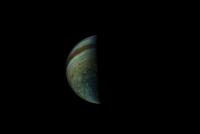
A crop of an enhanced (planetocentric) map derived from JunoCam image #6184:
(image: NASA / JPL /SwRI / MSSS / Gerald Eichstädt) Reviewing my assumptions about JunoCam's "companding" (triggered by M.Caplinger) helped removing most of the brightness-related color banding. This elaboration is partially motivated by a discussion among members of the JunoCam team about the nature of the banding. I think, some linear haze structure is discernible on about the latitude of the northern edge of the two prominent bright vortices (ovals) in the south. |
|
|
|
|
|
|
Dec 4 2016, 11:02 AM
Post
#81
|
||||||
|
Senior Member Group: Members Posts: 2346 Joined: 7-December 12 Member No.: 6780 |
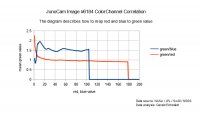
... Take a crop of a planetocentric map image #6184 in raw colors, i.e. all linear channel weights set to 1.0:
Take 100,000 equally distributed random (Monte Carlo) pixels, and determine mean and standard deviation of the according red->green, and blue->green functions:  map_JNCE_2016240_00C06184_rgb_maps.txt ( 18.07K )
Number of downloads: 348
map_JNCE_2016240_00C06184_rgb_maps.txt ( 18.07K )
Number of downloads: 348Here a diagram of the according green/red, blue/red quotients:
Apply the red->green, and blue->green functions to the raw map:
This removes most of the color banding, and normalizes the mean image to grey for each brightness. Approximate de-Lamberting (by dividing by the square root of the cosine of the solar incidence angle), and enhancement by the 4th power results in:
Further manual saturation and brightness enhancemnt returns the map I've used for the crop of the previous post:
This method removes most of the relative color banding. But absolute non-linearity of the green channel leaves some brightness banding. I'll try to resolve this remaining issue, too. Approximating radiomentric in-flight calibration is a little more tricky, and hence where the fun begins... |
|||||
|
|
|
|||||
|
Dec 4 2016, 03:52 PM
Post
#82
|
||
|
Senior Member Group: Members Posts: 2346 Joined: 7-December 12 Member No.: 6780 |
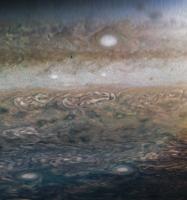
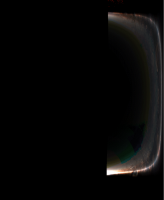
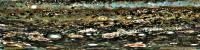
A crop of a map derived from #6180 shows at least three cloud levels, at the top of the image a finely granular layer with some dark ovals, then a layer of turbulent folded filametary regions (FFRs) partly covering one of the dark ovals beneath, then a subtle haze layer with linear (near the bottom of the image) and vortical structures (in the upper half of the image, at the very right), sufficiently translucent to see the layer(s) beneath :
(image: NASA / JPL /SwRI / MSSS / Gerald Eichstädt) The image is rendered with 30 pixels per planetocentric degree. North is up. |
|
|
|
|
|
|
Dec 6 2016, 11:34 AM
Post
#83
|
||||
|
Senior Member Group: Members Posts: 2346 Joined: 7-December 12 Member No.: 6780 |
Applying the three red->green and blue->green maps
returned these three de-Lamberted and exposure-corrected maps for images #6162, #6160, and #6163:
By equalizing the maps, and possibly additional constraints, I'll try to get a better companding correction than just stacking/averaging #6162 and #6160, as in the third image of this gif:
|
|||
|
|
|
|||
|
Dec 7 2016, 11:25 PM
Post
#84
|
||
|
Senior Member Group: Members Posts: 2346 Joined: 7-December 12 Member No.: 6780 |
Using the correct decompanding table simplified this step. Here a gif composed of #6160 and #6162:
The cropped planetocentric maps are decompanded, color-calibrated, exposure-adjusted, approximately de-Lamberted, stretched by gamma=4.0 relative to square-root encoding. |
|
|
|
|
|
|
Dec 8 2016, 10:46 PM
Post
#85
|
|
|
Senior Member Group: Members Posts: 2346 Joined: 7-December 12 Member No.: 6780 |
Selected cropped maps with 30 pixels per planetocentric degree.
(images 6160, 6162, 6163, 6180 (crop), 6184 (crop)). Color banding is mostly solved with M.Caplinger's decompanding table. (Thanks!) There is still some brightness variation. I'm going to do related correlation analysis to see, whether this can be reduced in a systematic way. I'm suspecting a mean BRDF other than the cosine of the solar incidence angle (Lambert model) if it's a BRDF at all, and a relevant non-constant camera flat field as among the most promising candidates. But my geometric reference model for de-Lamberting isn't yet quite perfect, too. |
|
|
|
|
Dec 12 2016, 12:33 PM
Post
#86
|
||
|
Senior Member Group: Members Posts: 2346 Joined: 7-December 12 Member No.: 6780 |
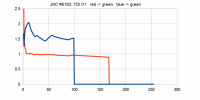
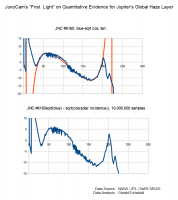
After a more thorough analysis of images #6160 and #6162, I see a very good chance at least, to analyse optical properties of Jupiter's global haze layer quantitatively. Here reduced data (blue) compared to a function (red) which I think, can be interpreted as a horribly simplified haze scattering and extinction model:
The oversimplified model breaks down, where the haze becomes opaque when seen from the Sun or from the observer. Nevertheless I was stunningly surprised, when I saw the reduced data, and the ease with which a simple function could be fit into the data, even before I had an idea how to interprete this, since real non-lab data rarely fit to a simple function. After I suspected light scattering of Jupiter's haze as a possible root cause, I failed to readily find an according easy formula for light scattering in the web. So I did a quick and dirty back-of-an-envelope calculation, and found a 1st-order simplification which seems to explain the empirically identified type of functions. Besides the immediate science value, a good model of the haze will help to improve the creation of maps and images of the cloud top below the haze. The latter is what I'll try to get implemented before PJ3 image data will be published in a few days. |
|
|
|
|
|
|
Dec 13 2016, 11:19 PM
Post
#87
|
||
|
Senior Member Group: Members Posts: 2346 Joined: 7-December 12 Member No.: 6780 |
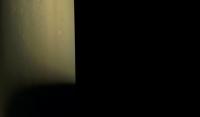
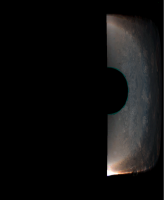
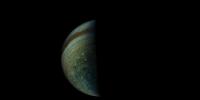
Heavily enhanced crop of map derived from #6184:
Now going to work on PJ3. |
|
|
|
|
|
|
Jun 30 2017, 05:48 PM
Post
#88
|
|||||||||
|
Senior Member Group: Members Posts: 2346 Joined: 7-December 12 Member No.: 6780 |
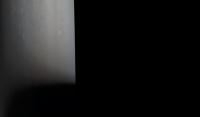
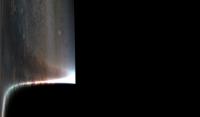
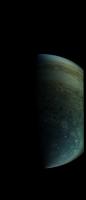
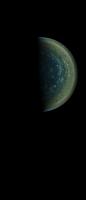
I thought, I should post at least some of those images "as-is":
6153:
6160:
Some of the images may be mirrored; I didn't yet verify this thoroughly. I had several nested "more urgent" jobs. But I hope, that I can return to "blemish", hot pixels, color and geometrical calibration over the next days, at least part-time. I don't intend to submit the above version of the images to missionjuno, but try to fix some of the known issues first. |
||||||||
|
|
|
||||||||
|
Dec 3 2019, 11:35 PM
Post
#89
|
||
|
Junior Member Group: Members Posts: 31 Joined: 31-October 19 Member No.: 8699 |
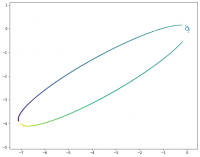
Just having alook to see what's in the dataset for P1, putting this here for anyone else who's 23 apojoves behind the curve too. Pulled all the LBL files from pds-imaging and used the spacecraft clock to figure out J2000 frame position. Looking along the X axis (because this one's pretty flat) the Juno locations (divided by 1e6) for each LBL file are marked by dots coloured by spacecraft time.
Just to note, it's under https://pds-imaging.jpl.nasa.gov/data/juno/...PITER/ORBIT_01/ where ORBIT_00 is a bundle of very similar positions.
Attached thumbnail(s)
|
|
|
|
|
|
|
Dec 11 2019, 12:40 AM
Post
#90
|
|||
|
Junior Member Group: Members Posts: 31 Joined: 31-October 19 Member No.: 8699 |
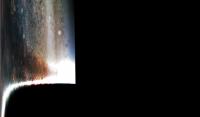
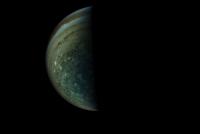
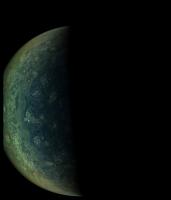
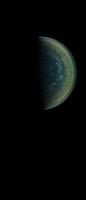
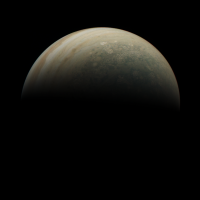
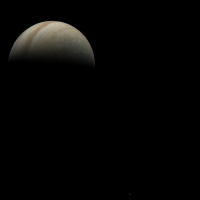
The closer (and so more polar) JNCE_2016240_01C06159_V01 along with JNCE_2016240_01C06151_V01 which has a fun bonus moon in there!
Attached thumbnail(s)
|
||
|
|
|
||
|

|
Lo-Fi Version | Time is now: 18th April 2024 - 10:00 AM |
|
RULES AND GUIDELINES Please read the Forum Rules and Guidelines before posting. IMAGE COPYRIGHT |
OPINIONS AND MODERATION Opinions expressed on UnmannedSpaceflight.com are those of the individual posters and do not necessarily reflect the opinions of UnmannedSpaceflight.com or The Planetary Society. The all-volunteer UnmannedSpaceflight.com moderation team is wholly independent of The Planetary Society. The Planetary Society has no influence over decisions made by the UnmannedSpaceflight.com moderators. |
SUPPORT THE FORUM Unmannedspaceflight.com is funded by the Planetary Society. Please consider supporting our work and many other projects by donating to the Society or becoming a member. |
|