Temperature and pressure at Gale, Suitable (for short periods) for liquid water? |

  |
Temperature and pressure at Gale, Suitable (for short periods) for liquid water? |
 Aug 18 2013, 12:09 PM Aug 18 2013, 12:09 PM
Post
#106
|
|
 Senior Member  Group: Members Posts: 1083 Joined: 19-February 05 From: Close to Meudon Observatory in France Member No.: 172 |
QUOTE (jmknapp @ Aug 15 2013, 05:57 PM)  OK, here are the plots with selectable units: WOW ! what a good work you did ! Thanks a lot Jmknapp ! 
|
 |
 
|
|
Aug 19 2013, 03:03 AM
Post
#107
|
|
 Senior Member Group: Members Posts: 2426 Joined: 30-January 13 From: Penang, Malaysia. Member No.: 6853 |
QUOTE (jmknapp @ Aug 18 2013, 07:39 AM) ......quite a bit more is known about the Mars climate and of course there's the ground truth provided by Curiosity. I also hope further experiments can be carried out with the new data provided by Curiosity. In the meantime I would like to thank Joe for providing the automated charts for Air Temperature and Pressure, especially useful as we can select the 'units' of measurement. I note however, that the source that he uses does not provide him with the data for the ground temperature. Ground temperatures are now reported by Centro de Astrobiología (CSIC-INTA) on a new REMS page (as are air temperature and pressure etc.) I prefer Joe's pages as it tells a better story by showing the trends. However, if you want to see the historic records for minimum and maximum ground temperature, visit HERE. Their data goes back to Sol 1, with only a small number of gaps up until the latest report on Sol 357. Updates to their page used to be daily, but recently this has been stretching out to weekly (this appears to be the same for all of the sites reporting REMS data) I understand that 'detailed MSL REMS data' is deposited in the PDS archive and is available here via the Analyst's Notebook, but the last time I checked it only addressed the first 179 sols. The additional ground temperature details at the Spanish page may be of interest to some until more is added to the PDS archive. I think the debate for the stability of surface liquids like brine or water will continue for some time, hopefully a detailed science paper that considers the detailed MSL data can finally put this debate to rest, one way or the other 
|
|
|
|
|
Aug 19 2013, 10:11 AM
Post
#108
|
|
 Senior Member Group: Members Posts: 1465 Joined: 9-February 04 From: Columbus OH USA Member No.: 13 |
I sent them an email to ask if they could add the ground temperature to the JSON/XML files. We'll see if that bears fruit. The maximum reported ground temperature appears to be up to 15°C warmer (or even more) than the max air temp on any given sol.
Thinking about the REMS IR sensor used to measure ground temperature brings up the question of what a sky IR temperature sensor might have shown, if they had included such. On Earth at least the sky IR temperature varies widely throughout the day depending on cloud cover and humidity, so it's a great way to show what's going on "up there." Maybe on Mars the picture would be relatively monotonous? Seems like the dust levels might have an effect. The last REMS update on sol 357 was Curiosity's anniversary--maybe they're still partying? -------------------- |
|
|
|
|
Aug 19 2013, 11:07 AM
Post
#109
|
|
|
Senior Member Group: Members Posts: 2346 Joined: 7-December 12 Member No.: 6780 |
QUOTE (PaulH51 @ Aug 19 2013, 05:03 AM) I understand that 'detailed MSL REMS data' is deposited in the PDS archive and is available here via the Analyst's Notebook, but the last time I checked it only addressed the first 179 sols. Next release (Sols 180-269) is scheduled for Aug. 30, 2013: Release Schedule. |
|
|
|
|
Aug 19 2013, 12:53 PM
Post
#110
|
|
|
Senior Member Group: Members Posts: 2426 Joined: 30-January 13 From: Penang, Malaysia. Member No.: 6853 |
QUOTE (Gerald @ Aug 19 2013, 07:07 PM) Next release (Sols 180-269) is scheduled for Aug. 30, 2013: Release Schedule. That additional data will please those with the ability to 'extract and interpret' the PDS REMS files I understand that this thread is is for Temperature and Pressure, but can anyone kindly point me to a thread for 'REMS wind'? TIA
|
|
|
|
|
Aug 19 2013, 02:11 PM
Post
#111
|
|
 Martian Photographer Group: Members Posts: 352 Joined: 3-March 05 Member No.: 183 |
Re: the IR sky sensor: Spirit and Opportunity had that, and each got about a Mars year of good data. Of course they also had the bad habit of aiming it at the ground (MiniTES). Using IR for sky is very channel/wavelength dependent. Some probe 10s of meters, some probe through the atmosphere. So you'll see a range of brightness temperatures. But you can reconstruct the temperature profile of the bottom 2 km pretty well, and watch the diurnal formation of the boundary layer, and then the collapse and huge T inversion.
A big problem with a fix sensor is that the Sun is pretty likely to kill it if it can see the sky's signal. |
|
|
|
|
Aug 19 2013, 02:47 PM
Post
#112
|
|
|
Senior Member Group: Members Posts: 1465 Joined: 9-February 04 From: Columbus OH USA Member No.: 13 |
Thanks Deimos--didn't know that MiniTES did that.
Re the sun possibly damaging a fixed sensor, not sure about the type of sensor used on MSL (TS-100), but Melexis makes a nifty sensor (MLX90614) that boasts: "An optical filter (long-wave pass) that cuts off the visible and near infra-red radiant flux is integrated in the package to provide ambient and sunlight immunity... Special care is taken to cut off the visible light spectra as well as the NIR (near IR) before it reaches the sensitive sensor die." -------------------- |
|
|
|
|
Aug 19 2013, 06:10 PM
Post
#113
|
|
|
Founder Group: Chairman Posts: 14432 Joined: 8-February 04 Member No.: 1 |
With MSL - the pointing problems mainly stem from frying ChemCam with too long a sun-point.
|
|
|
|
|
Aug 21 2013, 11:03 AM
Post
#114
|
||
|
Senior Member Group: Members Posts: 1465 Joined: 9-February 04 From: Columbus OH USA Member No.: 13 |
Looks like they've resumed updating the REMS data stream--things are still following the general trend.
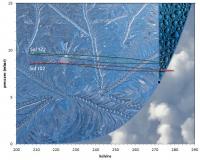
The PDS data, currently sols 0-179, is of course much more detailed, often with pressure and temperature records every second. With that kind of detail, temperature vs. pressure over a given sol can be plotted, tracing out a roughly closed loop (assuming that the following sol is similar). Here's a couple sols p-t data overlaid on a water phase diagram:
Sol 102 was the warmest sol so far (high temperature 9.4C/49F). Sol 172 had about the highest pressure. To date, all pressures have been above the triple point (black dot). -------------------- |
|
|
|
|
|
|
Aug 23 2013, 04:44 PM
Post
#115
|
|
|
Senior Member Group: Members Posts: 2346 Joined: 7-December 12 Member No.: 6780 |
That's probably the most beautiful phase diagrams I ever saw, Joe!
All we need is a cavern or something that prevents humidity from escaping and cooling down the ice by sublimation, before it can melt. |
|
|
|
|
Aug 23 2013, 06:38 PM
Post
#116
|
|
|
Senior Member Group: Members Posts: 1465 Joined: 9-February 04 From: Columbus OH USA Member No.: 13 |
Or, as Harder and you have mentioned, throw enough salt into the brine.
Saw an interesting claim that the atmospheric pressure being fairly close to the triple point is not just a coincidence. The argument goes that if conditions were such that liquid water could exist in significant quantities on the surface, said water would tend to fix carbon dioxide as carbonate. So the pressure (largely carbon dioxide) falls to the point where water no longer forms. For a more detailed look at the first 180 sols in the PDS, I made this page: Graphs of REMS PDS data Note the sol selection box in the upper right. The sol can also be changed using the arrow keys--although that doesn't work with Firefox for some reason. One feature I'd like to see explained: why does the pressure rise briefly near sunrise (6am lmst) as the temperature starts rising, but then reverse course to reach a low in the early afternoon? -------------------- |
|
|
|
|
Aug 23 2013, 07:45 PM
Post
#117
|
|
|
Martian Photographer Group: Members Posts: 352 Joined: 3-March 05 Member No.: 183 |
I may mangle this, and I'll certainly oversimplify it, as the pressure variations are globally harmonic with multiple modes. But here goes: at 0500, the atmosphere is cold and dense everywhere around. Around sunrise, the symmetry is gone, and there are warming and cold areas. The atmosphere expands in the warming areas, both horizontally into adjacent cold areas and vertically. Thus, an "adjacent cold area" sees a rise. That is brief, as shortly after sunrise, the area becomes a warming area. As the boundary layer warms it expands. Vertical expansion leads to high pressure aloft and the net export of air out of the atmospheric column. As long as the high altitude pressure is elevated, air flows out of the high, and surface pressure falls. Shortly after the surface air starts to cool, the high becomes unsustainable. The cooling area becomes a net importer of air until the temperature has nearly stabilized. To recap: the rise occurs when adjacent areas are net exporters of air due to warming; the fall is when the local area is warming and a net exporter; the recovery occurs during cooling.
There are semidiurnal (twice a sol) modes originating higher in the atmosphere from dust absorption, and local effects from the crater & mound, so I may be over-interpreting that a bit. You can see some dust effects around sol 100. |
|
|
|
|
Aug 24 2013, 03:12 PM
Post
#118
|
|
|
Merciless Robot Group: Admin Posts: 8783 Joined: 8-December 05 From: Los Angeles Member No.: 602 |
That rings true to me, Deimos. I was even more simplistically thinking that the air must be densest at the lowest temperature point of the day (pre-dawn) and expands when solar heating peaks in the early afternoon (allowing for thermal inertia at all times, of course).
The dust is surely a complicating factor in addition to local topography, though; not a simple system at all. Be interesting to see what happens during a global dust-storm. -------------------- A few will take this knowledge and use this power of a dream realized as a force for change, an impetus for further discovery to make less ancient dreams real.
|
|
|
|
|
Aug 24 2013, 05:11 PM
Post
#119
|
|
|
Senior Member Group: Members Posts: 1465 Joined: 9-February 04 From: Columbus OH USA Member No.: 13 |
Yes, Deimos, thanks for simplifying it--can sort of get my head around that explanation. Maybe the wind information would flesh out the situation a little more along the lines you describe.
-------------------- |
|
|
|
|
Aug 30 2013, 04:06 PM
Post
#120
|
|
|
Member Group: Members Posts: 293 Joined: 29-August 06 From: Columbia, MD Member No.: 1083 |
Yes, the repeatable pressure variations that REMS observes is primarily due to the diurnal and semidiurnal tides. The diurnal tide is responsible for the large-scale signal and the repeatable "shoulders" in the pressure data are mostly the semidiurnal tide. As Deimos said, complications come from dust loading and topographic effects in Gale.
Nprev...to answer your question about what would happen during a global dust storm: The Viking landers saw the pressure perturbation amplitudes (from the diurnal and semidiurnal tides) increase dramatically during the 1977 global dust storms, but they were at fairly high latitudes. For MSL, because of its tropical location, the diurnal amplitude would probably decrease to nearly zero, but the semidiurnal amplitude would likely increase a fair bit. |
|
|
|
|

|
Lo-Fi Version | Time is now: 24th April 2024 - 04:56 AM |
|
RULES AND GUIDELINES Please read the Forum Rules and Guidelines before posting. IMAGE COPYRIGHT |
OPINIONS AND MODERATION Opinions expressed on UnmannedSpaceflight.com are those of the individual posters and do not necessarily reflect the opinions of UnmannedSpaceflight.com or The Planetary Society. The all-volunteer UnmannedSpaceflight.com moderation team is wholly independent of The Planetary Society. The Planetary Society has no influence over decisions made by the UnmannedSpaceflight.com moderators. |
SUPPORT THE FORUM Unmannedspaceflight.com is funded by the Planetary Society. Please consider supporting our work and many other projects by donating to the Society or becoming a member. |
|