Chandrayaan 1, India's First Lunar Probe |

  |
Chandrayaan 1, India's First Lunar Probe |
| Guest_Zvezdichko_* |
 Nov 15 2009, 03:07 PM Nov 15 2009, 03:07 PM
Post
#451
|
|
Guests |
http://www.newkerala.com/nkfullnews-1-150347.html
Chandrayaan-1 confirms presence of mini-magnetosphere on the Moon. Happy reading. |
 |
 
|
|
Mar 2 2010, 03:57 AM
Post
#452
|
|
 Junior Member  Group: Members Posts: 75 Joined: 19-October 08 From: India Member No.: 4459 |
Chandrayaan-I detects ice deposits on moon - March 02, 2010 08:16 IST
http://news.rediff.com/report/2010/mar/02/...its-on-moon.htm Scientists have detected more than 40 ice-filled craters in the moon's North Pole using data from a NASA radar that flew aboard India's Chandrayaan-I. NASA's Mini-SAR instrument, lightweight, synthetic aperture radar, found more than 40 small craters with water ice. The craters range in size from 2 to 15 km in diameter. The finding would give future missions a new target to further explore and exploit, a NASA statement said, adding it is estimated that there could be at least 600 million metric tons of water ice in the craters. "The emerging picture from the multiple measurements and resulting data of the instruments on lunar missions indicates that water creation, migration, deposition and retention are occurring on the moon," Paul Spudis, principal investigator of the Mini-SAR experiment at the Lunar and Planetary Institute, said yesterday ... means many more 'flights' to moon |
|
|
|
|
Mar 2 2010, 12:14 PM
Post
#453
|
|
|
Senior Member Group: Members Posts: 1018 Joined: 29-November 05 From: Seattle, WA, USA Member No.: 590 |
MSNBC is reporting NASA as claiming to have found at least 600,000,000 tons of water in the north polar region.
http://www.msnbc.msn.com/id/35653907/ns/te..._science-space/ That's quite a bit more than I was expecting! --Greg |
|
|
|
|
Mar 2 2010, 07:16 PM
Post
#454
|
|
|
Solar System Cartographer Group: Members Posts: 10146 Joined: 5-April 05 From: Canada Member No.: 227 |
There might be a wee mathematical correction to be made to that number - just a few orders of magnitude. A bad metric conversion?
Phil -------------------- ... because the Solar System ain't gonna map itself.
Also to be found posting similar content on https://mastodon.social/@PhilStooke NOTE: everything created by me which I post on UMSF is considered to be in the public domain (NOT CC, public domain) |
|
|
|
|
Mar 2 2010, 07:25 PM
Post
#455
|
|
 Administrator Group: Admin Posts: 5172 Joined: 4-August 05 From: Pasadena, CA, USA, Earth Member No.: 454 |
FWIW, the 600 million metric ton figure was also mentioned by Paul Spudis in his presentation to the press yesterday afternoon. It's based on a one-to-one correspondence between locations with H measured by Lunar Prospector and locations of these ice-filled craters seen with Mini-SAR, and the assumption that there's at least 2 meters worth of nearly pure water ice in each of those craters.
Clearly one of the two numbers in the press release is wrong. Since Paul mentioned 600 million tons I think that is the right number. -------------------- My website - My Patreon - @elakdawalla on Twitter - Please support unmannedspaceflight.com by donating here.
|
|
|
|
|
Mar 3 2010, 12:47 AM
Post
#456
|
|
|
Solar System Cartographer Group: Members Posts: 10146 Joined: 5-April 05 From: Canada Member No.: 227 |
Yes indeed, the NASA press release contained a horrible metric conversion error, but it turns out it was the 600 million metric tons figure that was correct. The other figure in the release is the one that was wrong.
Phil -------------------- ... because the Solar System ain't gonna map itself.
Also to be found posting similar content on https://mastodon.social/@PhilStooke NOTE: everything created by me which I post on UMSF is considered to be in the public domain (NOT CC, public domain) |
|
|
|
|
Mar 3 2010, 09:37 AM
Post
#457
|
|
 Senior Member Group: Members Posts: 3648 Joined: 1-October 05 From: Croatia Member No.: 523 |
QUOTE (Phil Stooke @ Mar 3 2010, 01:47 AM)  the NASA press release contained a horrible metric conversion error When will they ever learn? -------------------- |
|
|
|
|
Jun 14 2010, 09:19 PM
Post
#458
|
|
 Senior Member Group: Members Posts: 1729 Joined: 3-August 06 From: 43° 35' 53" N 1° 26' 35" E Member No.: 1004 |
An article on Indian space including Chandrayaan 1 and 2 in today's Aviation Week http://www.aviationweek.com/aw/generic/sto..._p62-231468.xml
|
|
|
|
|
Aug 25 2010, 01:52 AM
Post
#459
|
|
|
Solar System Cartographer Group: Members Posts: 10146 Joined: 5-April 05 From: Canada Member No.: 227 |
Ever since MIP impacted over 18 months ago I have been looking for a clear statement about where it hit the surface. Now I may have it at last (though I really want to see the last few images to confirm it).
This new paper: Sridharan, R., Ahmed, S. M., Tirtha Pratim, D., Sreelatha, P., Pradeepkumar, P., Naik, N. and Gogulapati, S., 2010. The sunlit lunar atmosphere: A comprehensive study by CHACE on the Moon Impact Probe of Chandrayaan-1. Planet. Space Sci. (2010), doi:10.1016/j.pss.2010.07.027 says the MIP site is at c. 89 S, 30 W. It came down roughly along the 14 E meridian, but on a path that took it a bit west of the pole. This is earthward of the ridge connecting Shackleton and de Gerlache craters. Phil -------------------- ... because the Solar System ain't gonna map itself.
Also to be found posting similar content on https://mastodon.social/@PhilStooke NOTE: everything created by me which I post on UMSF is considered to be in the public domain (NOT CC, public domain) |
|
|
|
|
Sep 10 2010, 05:08 PM
Post
#460
|
||
 Member Group: Members Posts: 568 Joined: 20-April 05 From: Silesia Member No.: 299 |
This PDS volume contains Chandrayaan-1 Lunar Orbiter (Ch-1) Moon Mineralogy Mapper (M3) raw and reduced image data, Optical Period 1, Level 1B.
http://pds-imaging.jpl.nasa.gov/volumes/m3.html A lot of interesting material. Example: Part of M3G20090203T135512_V01_QL_B084.jpg
-------------------- Free software for planetary science (including Cassini Image Viewer).
http://members.tripod.com/petermasek/marinerall.html |
|
|
|
|
|
|
Sep 17 2010, 05:42 PM
Post
#461
|
||
|
Solar System Cartographer Group: Members Posts: 10146 Joined: 5-April 05 From: Canada Member No.: 227 |
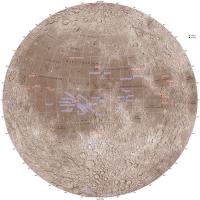
I have updated my Moon Landing Sites map to include the new location of MIP. Looking forward to the next thing I can mark on it... presumably Chang-e 2, either its end-of-mission impact which will probably be about the end of next year, or possibly a small lunar impactor it's reported to be carrying, if that report is correct. If so I assume that would occur this fall soon after the orbiter reaches the Moon.
This also includes a correction among the names thanks to a sharp-eyed person who emailed me. I always welcome corrections. Phil
-------------------- ... because the Solar System ain't gonna map itself.
Also to be found posting similar content on https://mastodon.social/@PhilStooke NOTE: everything created by me which I post on UMSF is considered to be in the public domain (NOT CC, public domain) |
|
|
|
|
|
|
Sep 19 2010, 04:27 PM
Post
#462
|
||
|
Senior Member Group: Members Posts: 3648 Joined: 1-October 05 From: Croatia Member No.: 523 |
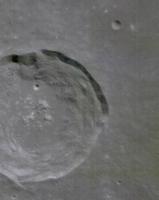
Here's a "flyover" movie over one M3 swath, in visible color - 18 MB AVI, XviD codec. Source was M3G20081119T021733_V01_RDN.IMG and the output was rotated 180 deg. The entire swath is 304 x 28974 pixels (summation mode "global" so not the full resolution of the instrument) with 85 spectral channels returned. Starts over the night side, crossing the terminator, culminating over high sun terrain and ending when the phase angle began to increase.
The rows of hot pixels (the short wavelength channels are noisy) in the beginning inspired me for that particular soundtrack... One snapshot:
-------------------- |
|
|
|
|
|
|
Dec 11 2010, 03:09 AM
Post
#463
|
|
 Junior Member Group: Members Posts: 21 Joined: 23-December 08 From: Mumbai Member No.: 4513 |
A few data and paper releases from Chandrayaan-I from the last 3 months:
1. There is a NASA PDS data release on December 8: http://pds.nasa.gov/tools/subscription_ser...-20101208.shtml. The next scheduled data release is on January 15, 2011. 2. SARA has bought out a paper a month since October. a. Dynamics of solar wind protons reflected by the Moon - http://arxiv.org/abs/1010.2065v1 (Oct. 11, 2010) b. The Sub-keV Atom Reflecting Analyzer (SARA) Experiment Aboard Chandrayaan-1 Mission: Instrument and Observations - http://arxiv.org/abs/1012.1527 (Dec. 7, 2010) c. First observation of a mini-magnetosphere above a lunar magnetic anomaly using energetic neutral atoms - http://arxiv.org/abs/1011.4442 (Nov. 19, 2010) 3. RADOM also has published results - Radiation Environment In Earth-Moon Space: Results From RADOM Experiment Onboard Chandrayaan-1 - http://arxiv.org/abs/1012.2014 (Dec. 9, 2010) Pradeep -------------------- Pradeep Mohandas,
SEDS India. |
|
|
|
|
Dec 12 2010, 04:10 PM
Post
#464
|
|
|
Member Group: Members Posts: 713 Joined: 30-March 05 Member No.: 223 |
Thanks for the update, Pradeep !
do you have any information when the first data from the Terrain Mapping Camera (TMC) which I am particularly looking forward to  will be released ? will be released ?there is a preview of TMC data published at the ISRO site (link) which looks very very promising (the announced 5-meter-per-pixel near-global DEM would be by far the best topographic map of the moon yet with resolution two times higher than SELENE/KAGUYA DTM and more than ten times higher than LOLA DTM ... |
|
|
|
|
Dec 12 2010, 05:32 PM
Post
#465
|
|
|
Solar System Cartographer Group: Members Posts: 10146 Joined: 5-April 05 From: Canada Member No.: 227 |
Don't get too carried away with the idea of a 5 m/pixel DTM. The spatial resolution of the stereo-derived DTM will really be equivalent to the spacing of tie points between the images used in the stereo model. That will be very good, but not as high as 5 m/pixel. Also, TM data are not global, and of course, no data in shadows. Still, it will be a very nice dataset.
Phil -------------------- ... because the Solar System ain't gonna map itself.
Also to be found posting similar content on https://mastodon.social/@PhilStooke NOTE: everything created by me which I post on UMSF is considered to be in the public domain (NOT CC, public domain) |
|
|
|
|

|
Lo-Fi Version | Time is now: 19th April 2024 - 02:59 AM |
|
RULES AND GUIDELINES Please read the Forum Rules and Guidelines before posting. IMAGE COPYRIGHT |
OPINIONS AND MODERATION Opinions expressed on UnmannedSpaceflight.com are those of the individual posters and do not necessarily reflect the opinions of UnmannedSpaceflight.com or The Planetary Society. The all-volunteer UnmannedSpaceflight.com moderation team is wholly independent of The Planetary Society. The Planetary Society has no influence over decisions made by the UnmannedSpaceflight.com moderators. |
SUPPORT THE FORUM Unmannedspaceflight.com is funded by the Planetary Society. Please consider supporting our work and many other projects by donating to the Society or becoming a member. |
|