Printable Version of Topic
Click here to view this topic in its original format
Unmanned Spaceflight.com _ LRO & LCROSS _ South Pole in 3D
Posted by: emd Apr 7 2011, 03:13 PM
Hello,
this is the first time I post on this forum. I would like to take the opportunity to thank you all for the
inspiration you provided with your beautiful images and excellent work.
After perusing the forums for a while I decided to start producing some planetary maps for some research project I was involved with and because it is really cool!
I used the LOLA grided release and ISIS3 to read the LOLA files and produce .cub files.
I used GRASS GIS to read these files (reads directly cub files).
I then made an overlay from the illumination map that LROC team made for the Lunar South Pole.
http://lroc.sese.asu.edu/news/index.php?/archives/321-South-Pole-Illumination-Map.html .
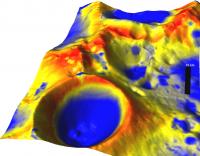
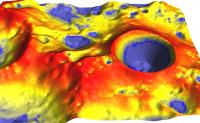
Finally, I used the nviz function of GRASS to tranform the LOLA data in 3D and overlay the illumination map as a "red to blue" colormap.
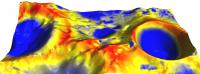
So in these pictures, red means more illumination and blue means less illumination.
The scale can be seen on the first map. I attach two of the images.
hope you like it
best regards
Emmanouil
|
|
Posted by: Phil Stooke Apr 7 2011, 04:07 PM
These are very nice, and I congratulate you for doing such a good job.
One thing though - there seems to be a slight offset between the topography and the illumination shading. The red bands of maximum illumination should run over the very tops of all the ridges and crater rims. Some of your red areas are off to one side of the topographic ridge. Maybe a slight tweaking of the registration can fix that.
EDIT - looking more closely, it's not just a one direction offset, it's a scaling problem. The colour image is a bit too small for the topo. When it's enlarged it will fit perfectly.
Phil
Posted by: pgrindrod Apr 7 2011, 05:26 PM
I second that - nice work Emmanouil! You've done all the hard work of processing the data in ISIS, now you can start to enjoy the results.
There are so many fantastic datasets from LRO, which I hope you can now use and enjoy. I played around in Arc a bit ago, combining LOLA and LROC PDS data, and just sat at my desk gobsmacked most of the time.
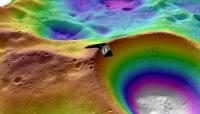
Combining the 10 m South Pole LOLA DEM with a sample (cropped) LROC NAC image over the rim of Shackleton, I got the following sort of thing (even with the resolution of the topography turned down for the health of my machine).
|
|
So much data, so little time.

Pete
Posted by: emd Apr 8 2011, 04:02 PM
Heh, thanks for the correction guys. It is indeed a scaling issue.
The illumination map is just an image file without reference points and in my excitment to upload my first map, I forgot to actually have a look at it and correct the scaling! Apologies for the shoddy work.
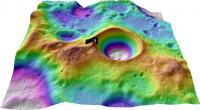
Here is a "corrected" version. Not perfect, but atleast the bottom of craters is blue now!
I agree that is too much data around and definetely too litle time! If only I could get a bigger computer too!
best regards
Emmanouil
|
Powered by Invision Power Board (http://www.invisionboard.com)
© Invision Power Services (http://www.invisionpower.com)