Images and Movies of Venus |

  |
Images and Movies of Venus |
 Jun 10 2012, 11:46 PM Jun 10 2012, 11:46 PM
Post
#1
|
|||
 IMG to PNG GOD  Group: Moderator Posts: 2254 Joined: 19-February 04 From: Near fire and ice Member No.: 38 |
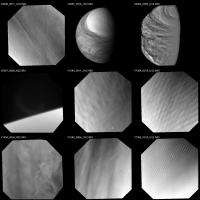
Recently I have been taking a fairly detailed look at the Venus Express (VEX) Venus Monitoring Camera (VMC) data set. Apparently this is a little known data set here at UMSF but this is a really interesting data set that isn't too difficult to process and many of the images show interesting atmospheric features. So without further ado here are some results of my processing efforts, followed by more detailed information below.
Two 3x3 montages of VMC images:
I also assembled a movie from 58 UV images obtained during orbit 1640. It is available at YouTube. A sharpened, tweened version of the movie is also available at YouTube. I selected the montage images to show various types of features and to show interesting stuff: Global views, atmospheric waves, features that appear dark in the UV, a bright south polar band, thermal emission from the surface etc. So far I have taken a quick look at only a few thousand images (maybe about 10,000) but this is a huge data set. I don't know the exact number of images but it is probably more than 100,000. For comparison, Pioneer Venus obtained ~1500 images (I don't know the exact number). VEX has been monitoring Venus continuously for 6 years now and this is a really fascinating data set that seems to be almost unknown among the image processing specialists here. Movies like the one above are relatively easy to make and for anyone interested, it is definitely possible to make hundreds of them if one has the time. Even though the movie above covers a period of just 8 hours this is sufficient to reveal that Venus' atmosphere can change very quickly - significant changes can occur in just a few hours. I haven't done any mosaics yet but I know they are possible. It is probably possible to make atmospheric movies as well. 'Color' composites are possible but not interesting. Most of the images above are UV images; their name ends with _UV2.IMG. There are also three IR images; their name ends with _N22.IMG. Since I was experimenting, the processing varies from frame to frame in the montages, some of the images have been contrast stretched and some have also been processed with an unsharp mask. I became interested in knowing more about some of the cloud features visible in the images and managed to relatively quickly find a lot of interesting and useful information, far more than I was expecting - I now almost 400 (!) 'new' pages of stuff to read. Venus is a really interesting planet. Below is a summary of a few things I found interesting but there is a lot more - I haven't read all 400 pages yet ;-). The VMC observes Venus in four channels: A UV channel, a visible channel and two IR channels. I didn't flat field the images above so some artifacts are visible, especially in the sharpened movie. One problem with the VMC is that the spots and filaments that need to be removed using flat fielding change relatively rapidly so you really need one flatfield image per channel per orbit but this is not always possible. However, images are frequently obtained showing the north polar region at close range and some of these can be used for flat fielding. One of the IR images shows haze above the limb. The other two IR images appear to show thermal emission from Venus' surface as they appear very dark without any enhancement (night side images). A few of the images (V1584_0011_UV2, V1584_0015_UV2 and V1585_0010_UV2) show interesting wavy features. The 'waves' were also seen in earlier data but VEX has been able to image them at much higher resolution. Three types have been observed, long straight features, short wave trains and irregular wave fields. The montages above include images of all of these types. The waves are seen in all VMC channels. This means that they are not due to variability in the UV absorber distribution; they are probably caused by variations in the solar illumination angle near the cloud tops. The waves mainly occur in the high north and they may be associated with the Ishtar Terra highland region. This implies a possible orographic origin, i.e. these would then be mountain waves. This is far from certain though, in particular the waves might simply be easier to detect in the north due to the lower solar illumination angle. Interestingly, the VIRTIS instrument which can penetrate deeper in the atmosphere than VMC also detected waves at a greater depth, i.e. in the lower cloud layer. The variable brightness in the UV images is caused by the presence of an UV absorber. Conversely, there is evidence that the much lower contrast variations in the visible and IR channels are caused by horizontal variations of total cloud opacity. Some features are observed in all filters but the patterns are not totally correlated. Venus' appearance can change rapidly over a period of a few days. Changes include global brightness, spatial contrasts and the extent of the bright polar band. The polar band boundary varies and sometimes shifts to as low as 30° latitude. In January 2007 the brightness of the south polar region increased by ~30% over a period of four days. One of the montage images (V0267_0018_UV2.IMG) shows the south polar region when this was happening. In addition to the VMC images, data from VIRTIS (Visible and Infrared Thermal Imaging Spectrometer) might be interesting to process. VIRTIS observes at many wavelengths and is able to penetrate deeper into the atmosphere. Some of the publicly released VIRTIS images show interesting and spectacular atmospheric features. The VMC data set isn't very difficult to process (IMG2PNG converts the IMGs to PNGs withoout problems) so if anyone does anything interesting with it please post here! |
||
 |
 
|
||
|
Jun 11 2012, 12:47 AM
Post
#2
|
|
|
Member Group: Members Posts: 903 Joined: 30-January 05 Member No.: 162 |
Great work there, and thanx! Neat planet, tends to be overlooked.
Are images available for comparable spacecraft position/solar angle positions on specific 'dates' in the Venusian 'calendar' ? I am wondering if we see similar cloud patterns every Venusian 'first day of spring', etc. |
|
|
|
|
Jun 11 2012, 01:00 AM
Post
#3
|
|
|
IMG to PNG GOD Group: Moderator Posts: 2254 Joined: 19-February 04 From: Near fire and ice Member No.: 38 |
QUOTE (tasp @ Jun 11 2012, 12:47 AM)  Are images available for comparable spacecraft position/solar angle positions on specific 'dates' in the Venusian 'calendar' ? Yes, they should be available - the Venus Express coverage is almost continuous with only a few gaps in time (but seasonal variations are negligible due to Venus' small axial tilt). |
|
|
|
|
Jun 11 2012, 07:06 AM
Post
#4
|
|
 Member Group: Members Posts: 655 Joined: 22-January 06 Member No.: 655 |
Thanks for sharing that Bjorn. I agree with Tasp - Venus doesn't get the attention that other planets do - not quite so photogenic from orbit (unless you have SAR)
Nice to see some of that detail in the clouds. |
|
|
|
|
Jun 11 2012, 08:40 PM
Post
#5
|
|
 Member Group: Members Posts: 796 Joined: 27-February 08 From: Heart of Europe Member No.: 4057 |
Nice and interesting images and animations!
"In addition to the VMC images, data from VIRTIS (Visible and Infrared Thermal Imaging Spectrometer) might be interesting to process. VIRTIS observes at many wavelengths and is able to penetrate deeper into the atmosphere. Some of the publicly released VIRTIS images show interesting and spectacular atmospheric features." Unfortunately, VIRTIS images cannot be opened by "normal" software.  "Neat planet, tends to be overlooked." I hope, that Indians and Israelis will send their hi-res SAR orbiter. BTW, I think, that circular structure in image V1585_0033_N22.img is surface feature. I saw this image somewhere, but I cannot remember where. -------------------- |
|
|
|
|
Jun 12 2012, 01:15 AM
Post
#6
|
||
|
IMG to PNG GOD Group: Moderator Posts: 2254 Joined: 19-February 04 From: Near fire and ice Member No.: 38 |
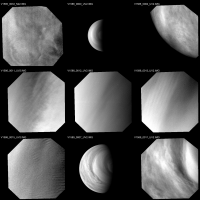
Here is a sequence of UV images showing how the south polar region changes with time:
The orbit numbers are shown. The sequence includes an image from orbit 267 mentioned in my first post. The big increase in brightness of the south polar band mentioned in that post is obvious. Each orbit is one Earth day. The images have been sharpened with an unsharp mask. I don't (yet) know the exact image orientation but north is roughly up in the images, probably upper left. The south pole is on the terminator right of center in the images. EDIT: The subspacecraft latitude is 50 degrees south. QUOTE (machi @ Jun 11 2012, 08:40 PM) Unfortunately, VIRTIS images cannot be opened by "normal" software. This is a problem and might require some software development but I don't know if/when I'll do something about it. |
|
|
|
|
|
|
Jun 12 2012, 03:39 PM
Post
#7
|
|
|
Newbie Group: Members Posts: 8 Joined: 5-September 08 Member No.: 4329 |
QUOTE (machi @ Jun 11 2012, 09:40 PM) Unfortunately, VIRTIS images cannot be opened by "normal" software. The VIRTIS team use IDL (and/or ENVI) software to look at the data. IDL routines to open the data can be freely downloaded from ESA's Planetary Science Archive FTP site at ftp://psa.esac.esa.int/pub/mirror/VENUS-E...-V2.0/DOCUMENT/ , and documentation about the software and file formats can also be found there. Unfortunately, IDL is not a free software. The company making it was called RSI, then ITT Vis, and now "Exelis". I know of no free workarounds... |
|
|
|
|
Jun 12 2012, 08:25 PM
Post
#8
|
|
 Senior Member Group: Members Posts: 2530 Joined: 20-April 05 Member No.: 321 |
Venus doesn't really have seasons. The axis is almost perpendicular to its orbit, which is particularly circular. Venus is on normal behavior all the time. Which is what makes any variation interesting, such as the profound change in SO2 levels observed during Pioneer Venus.
http://www.sciencemag.org/content/223/4640/1072.abstract |
|
|
|
|
Jun 13 2012, 07:20 AM
Post
#9
|
|
|
Member Group: Members Posts: 247 Joined: 17-February 07 From: ESAC, cerca Madrid, Spain. Member No.: 1743 |
QUOTE (JohnVV @ Jun 13 2012, 06:01 AM) i would say that isis3 is "normal" software , at least in my opinion . If I'm not mistaken, what you have shown are Venus Monitoring Camera (VMC) images. And those are pretty straight forward to open and play with. Colin_Wilson was saying that the Venus Express imaging spectrometer, called Virtis, has files which are very difficult to open and process. Those are the ones that need the special software. I wish good luck to anyone who wants to get into those. You picked a nice close-up image. People are having a devil of a time trying to explain all the cloud shapes, and that's a good example. -------------------- --
cndwrld@yahoo.com |
|
|
|
|
Jun 13 2012, 11:05 AM
Post
#10
|
|
|
Solar System Cartographer Group: Members Posts: 10229 Joined: 5-April 05 From: Canada Member No.: 227 |
Right - the VIRTIS images are .qub files, image cubes with several layers. I have not looked for file format data so I don't know how the layers are stored - interleaved lines, for example. A Windows/Mac utility that could split an image cube into individual layers would be useful, especially if it could handle several different instruments rather than just VIRTIS.
Phil -------------------- ... because the Solar System ain't gonna map itself.
Also to be found posting similar content on https://mastodon.social/@PhilStooke Maps for download (free PDF: https://upload.wikimedia.org/wikipedia/comm...Cartography.pdf NOTE: everything created by me which I post on UMSF is considered to be in the public domain (NOT CC, public domain) |
|
|
|
|
Jun 13 2012, 12:13 PM
Post
#11
|
|
|
IMG to PNG GOD Group: Moderator Posts: 2254 Joined: 19-February 04 From: Near fire and ice Member No.: 38 |
Some years ago ugordan wrote a utility to read/convert the Cassini VIMS cubes. The VIRTIS data might be comparable to the VIMS data from a 'software/utility' point of view.
|
|
|
|
|
Jun 13 2012, 03:50 PM
Post
#12
|
|
 Administrator Group: Admin Posts: 5172 Joined: 4-August 05 From: Pasadena, CA, USA, Earth Member No.: 454 |
If the VIRTIS data are just band-interleaved or band-sequential, it should, in theory, be possible to open them as raw images in Photoshop.
-------------------- My website - My Patreon - @elakdawalla on Twitter - Please support unmannedspaceflight.com by donating here.
|
|
|
|
|
Jun 13 2012, 04:22 PM
Post
#13
|
|
|
Member Group: Members Posts: 104 Joined: 1-June 08 Member No.: 4172 |
This might also help: http://code.google.com/p/virtispy/
|
|
|
|
|
Jun 13 2012, 04:31 PM
Post
#14
|
|
|
IMG to PNG GOD Group: Moderator Posts: 2254 Joined: 19-February 04 From: Near fire and ice Member No.: 38 |
QUOTE (jekbradbury @ Jun 13 2012, 04:22 PM) This might also help: http://code.google.com/p/virtispy/ Thanks - I didn't know about this. At first sight it looks so interesting that I'm about to get convinced that I need to learn Python ASAP. |
|
|
|
|
Jun 13 2012, 05:45 PM
Post
#15
|
|
 Senior Member Group: Members Posts: 3648 Joined: 1-October 05 From: Croatia Member No.: 523 |
QUOTE (Bjorn Jonsson @ Jun 13 2012, 02:13 PM) The VIRTIS data might be comparable to the VIMS data from a 'software/utility' point of view. It might, might even be simpler than VIMS cubes. They're mostly just different ways of packing 3D data with occasional extras in certain dimensions. I'll have to give it a look unless someone else figures out how to read the cubes first. As my interest is primarily in visual channels and Venus is totally bland the motivation factor is somewhat absent. If we were talking about Rosetta VIRTIS Mars and Earth data on the other hand... -------------------- |
|
|
|
|

|
Lo-Fi Version | Time is now: 26th September 2024 - 08:34 PM |
|
RULES AND GUIDELINES Please read the Forum Rules and Guidelines before posting. IMAGE COPYRIGHT |
OPINIONS AND MODERATION Opinions expressed on UnmannedSpaceflight.com are those of the individual posters and do not necessarily reflect the opinions of UnmannedSpaceflight.com or The Planetary Society. The all-volunteer UnmannedSpaceflight.com moderation team is wholly independent of The Planetary Society. The Planetary Society has no influence over decisions made by the UnmannedSpaceflight.com moderators. |
SUPPORT THE FORUM Unmannedspaceflight.com is funded by the Planetary Society. Please consider supporting our work and many other projects by donating to the Society or becoming a member. |
|