RIMFAX, Ground-Penetrating Radar Discussion & Results |

  |
RIMFAX, Ground-Penetrating Radar Discussion & Results |
 Aug 26 2021, 02:56 AM Aug 26 2021, 02:56 AM
Post
#1
|
||
|
Member  Group: Members Posts: 248 Joined: 25-February 21 From: Waltham, Massachussetts, U.S.A. Member No.: 8974 |
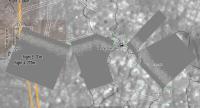
A first reconnaissance of some of RIMFAX profiles
These are the browse images from sol 47 to 72 oriented along the track using the min./max. positions in the associated xml metadata. The horizontal scale should therefore be approximately correct. The vertical scale is just an estimated 30m. Keep in mind that RIMFAX records vertical radar profiles/soundings, here flipped on the side. The arrangement makes it clear that it will be permissible to merge the images along the E-W transect from sol 47 to sol 49, and also the images along the ca. N-S transect from sol 65 to 73 for a more continuous analysis. There are interesting features. The bright intermediate zone is persistent but varies in thickness quite a bit. There are more continuous reflectors near and above its upper limit. -------------------- --
Andreas Plesch, andreasplesch at gmail dot com |
|
 |
 
|
|
|
Aug 26 2021, 05:25 AM
Post
#2
|
|
|
Senior Member Group: Members Posts: 1043 Joined: 17-February 09 Member No.: 4605 |
I thought the expected maximum depth was around 30 feet or a touch more? Say 10 metres. Do you know what mode was in force for these traces? Surface, shallow or deep. I suspect that it was shallow in which case the return from antenna to the first, surface return is 60cm which can give the effective depth of the trace and indicates that the high density (white) layer is around a metre beneath the surface.
This link provides a description of expected return for various sub surface structures. https://link.springer.com/article/10.1007/s...0740-4/tables/1 |
|
|
|
|
Aug 26 2021, 11:54 AM
Post
#3
|
|
|
Member Group: Members Posts: 248 Joined: 25-February 21 From: Waltham, Massachussetts, U.S.A. Member No.: 8974 |
https://pds-geosciences.wustl.edu/m2020/urn...fax_cdr_sis.pdf
has helpful information. Here is a summary: http://www.unmannedspaceflight.com/index.p...st&p=254234 The browse images are from Shallow mode. Looking at the actual csv data, max. depth (in the time domain) in Shallow mode is 290ns. Given expected velocities from analogues this could mean ca. 30-40m depth but perhaps I am off by a factor of 2. This does not mean there is meaningful data at this depth. A 10m imaging limit would be consistent with the total depth and would correspond to the lower limit of the brighter zone. The documentation says the surface return is at about 5ns and 74cm. I agree, the less reflective, uppermost layer is maybe 1m thick. I started to convert the intensities from the actual data to images. There is also Surface and Deep mode data. But the browse images seem to give a good sense of the character, with resolution reduced from (interpolated) ca. 16000 depth samples to ca. 2000 in the browse image. -------------------- --
Andreas Plesch, andreasplesch at gmail dot com |
|
|
|
|
Aug 27 2021, 02:45 PM
Post
#4
|
|||
|
Member Group: Members Posts: 248 Joined: 25-February 21 From: Waltham, Massachussetts, U.S.A. Member No.: 8974 |
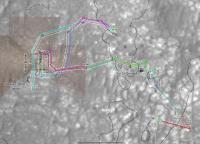
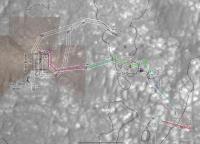
The calibrated .csv data files have fields for antenna and rover positions per sounding. Here is a map of the reported antenna positions, colored by sol. They follow the geojson of the rover track but seem to drift to the east progressively over time. I would trust the geojson track more since it is cross-checked with ground features observed from the rover.
It appears that most of these positions have soundings in Surface mode. Here are the positions which have Shallow mode soundings:
Essentially all of the Shallow mode positions also have Deep mode soundings. There are calibration versions for each of the modes as well which appear to have been used a few times before and after each profile. -------------------- --
Andreas Plesch, andreasplesch at gmail dot com |
||
|
|
|
||
|
Aug 28 2021, 01:02 AM
Post
#5
|
||
|
Member Group: Members Posts: 248 Joined: 25-February 21 From: Waltham, Massachussetts, U.S.A. Member No.: 8974 |
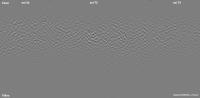
Here is a composite W-E profile using the Shallow mode sol 47, 48 and 49 data:
The vertical resolution was reduced from the original 16384 (interpolated) samples to 4096, and the lower half removed. This means that bottom of the image should be at 145ns two way travel time. The horizontal scale was smoothly stretched by a factor 10, eg. each sounding is 10 pixels wide. The documentation reports that the distance from the receiver to rover ground level should be 74cm. The intensity data from each sol was scaled by the same factor, and then overall contrast somewhat enhanced. This results in seamless sol to sol transitions. I will generate a similar profile for the N-S traverse. While the reflective layer is somewhat broken up, there are places with more continuous, often dipping, reflectors. Perhaps some patterns can be interpreted as small craters. In the last third of sol 48, there is an intriguing erosion of reflectivity both from the top and from the bottom. In terms of processing it may be worthwhile to space the sounding traces according to their reported position. While the sequence is fairly regular there is grouping introduced by additional gaps. -------------------- --
Andreas Plesch, andreasplesch at gmail dot com |
|
|
|
|
|
|
Aug 28 2021, 04:37 PM
Post
#6
|
||
|
Member Group: Members Posts: 248 Joined: 25-February 21 From: Waltham, Massachussetts, U.S.A. Member No.: 8974 |
Here is a composite N-S profile using Shallow mode data from sols 66,72 and 73
using the same assembling of data as the W-E profile. The top of the reflective zone has pretty consistently more horizontally continuous, weaker reflectors, separating it from the shallow (regolith?) layer. Lots more to see but will require staring and interpretation. -------------------- --
Andreas Plesch, andreasplesch at gmail dot com |
|
|
|
|
|
|
Aug 29 2021, 01:54 AM
Post
#7
|
|||
|
Member Group: Members Posts: 248 Joined: 25-February 21 From: Waltham, Massachussetts, U.S.A. Member No.: 8974 |
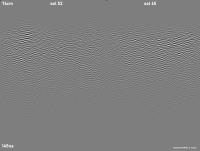
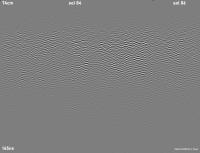
And here the remaining sols, 52-65 in the corner between the longer traverses, and 84-86 for a short E to W profile.
sol84 has a nice set of more persistent horizontal reflectors at the top of the brighter zone. -------------------- --
Andreas Plesch, andreasplesch at gmail dot com |
||
|
|
|
||
|
Aug 30 2021, 02:13 AM
Post
#8
|
||
|
Member Group: Members Posts: 248 Joined: 25-February 21 From: Waltham, Massachussetts, U.S.A. Member No.: 8974 |
I am starting to look at the Deep mode and Surface mode data after the Shallow mode data which is what the browse images on PDS use.
Here is a side by side comparison of sol 48 Deep, Shallow and Surface modes:
These are the full soundings to the max. depths of the modes (subsampled to create a reasonably sized image). The white arrow points to a highlighted feature across the modes for comparison. Reflectors reproduce very closely across modes. Perhaps it will make sense to stack the modes to a single image. Looking at the comparison, I am now uncertain where the ground level is in the profiles. There was a note that data are ground level corrected. So perhaps ground level is at 0ns at the top, and Shallow and Deep mode blank on the near surface. Time to reread the documentation and metadata. -------------------- --
Andreas Plesch, andreasplesch at gmail dot com |
|
|
|
|
|
|
Aug 30 2021, 02:48 PM
Post
#9
|
|
|
Member Group: Members Posts: 248 Joined: 25-February 21 From: Waltham, Massachussetts, U.S.A. Member No.: 8974 |
A relevant excerpt from the Calibrated Data Record (CDR) Software Interface Specification
Page 16: Shift to time-zero (t=0) at antenna delay Shifting the data such that time-zero (t=0 ns) corresponds to the antenna delay, physically corresponding to the antenna feed point (Section 3.3.2), is most easily and precisely done in the Fourier domain. The antenna delay is in ns, and the shift is performed by multiplying the frequency domain sounding data with the frequency vector in radians. The position of the Mars ground surface in the Calibrated sounding data will be directly related to the distance of the antenna above the surface that it is seeing. While rover attitude and surface topography will cause some variability from sounding to sounding, this distance should remain relatively constant at ~74.4 cm over the mission, which would nominally translate to a ~5.0 ns two-way travel time delay from the start of a calibrated sounding (the first data-sample of which starts at time = 0 ns in all CDR table records). This value should assist users constrain the location of the surface return in the CDR sounding data. -- I think that means that the time 0ns (the top of the image) should correspond in all cases to the antenna feed point, 74.4cm above ground level. Another excerpt could explain the blanking seen in Shallow and Deep mode: Page 11: 2.6.2 Surface Operation RIMFAX is designed to operate in different modes in which radar parameters are set to optimize data collection for different subsurface conditions and depths. The RIMFAX gating makes it possible to omit the recording of close-range reflections, typically from the antenna and surface, which would otherwise limit the dynamic range. The removal of these reflections makes it possible, when desired, to increase the radars gain to capture weak subsurface reflections. Shifting the receiver dynamic range window particularly to each mode effectively increases the radars total dynamic range when soundings from different modes are considered together. 1. Surface Mode The antenna reflection is captured in the receiver window. Measures the surface reflection and the very upper subsurface only. 2. Shallow Mode The antenna reflection is removed from the receiver window. Measures the surface reflection and the shallow subsurface. 3. Deep Mode The antenna and surface reflections are removed from the receiver window. Measures reflections from the upper subsurface (~1 m depth) through the instrumented range. -- So Shallow and Deep mode have strong close-range reflections removed, to increase dynamic range. This makes me suspect that the first strong reflections seen in Surface mode are from the ground level. -------------------- --
Andreas Plesch, andreasplesch at gmail dot com |
|
|
|
|
Aug 30 2021, 04:07 PM
Post
#10
|
|
 Member Group: Members Posts: 219 Joined: 14-November 11 From: Washington, DC Member No.: 6237 |
I think you're on the right track about the blanking... look at parameters tx_delay & rx_delay... (i.e. 10 ns for shallow) not my area of expertise but I've been poking at these since you posted them (always curious about new datasets.)
Maybe you could look into adding an exponential gain with time (depth) - seems this is common practice, though RIMFAX is different enough from typical GPRs that I'm not quite sure if it hasn't been done already. Could make the contrast more consistent over the image and provide estimate of loss factor. |
|
|
|
|
Aug 30 2021, 09:25 PM
Post
#11
|
|
|
Member Group: Members Posts: 248 Joined: 25-February 21 From: Waltham, Massachussetts, U.S.A. Member No.: 8974 |
Yes, rx_delay, the delay of the receiver gate (after the transmitter turns off) is 0 ns for Surface mode, 10 ns for Shallow mode, and 20 ns for Deep mode in the data. That looks to correspond to the blanked sections for each mode. Update: I checked, and muted depth is indeed 10 ns in Shallow, and 20 ns in Deep mode.
Sofar this is more about exploration of the calibrated data set than actual processing which may account for expected attenuation, and perhaps contributions from off-axis, dipping reflectors. But it should be interesting to crank up intensities with depth although it may be that the system is designed only for imaging the brighter depth range in the first place. -------------------- --
Andreas Plesch, andreasplesch at gmail dot com |
|
|
|
|

|
Lo-Fi Version | Time is now: 16th April 2024 - 09:56 PM |
|
RULES AND GUIDELINES Please read the Forum Rules and Guidelines before posting. IMAGE COPYRIGHT |
OPINIONS AND MODERATION Opinions expressed on UnmannedSpaceflight.com are those of the individual posters and do not necessarily reflect the opinions of UnmannedSpaceflight.com or The Planetary Society. The all-volunteer UnmannedSpaceflight.com moderation team is wholly independent of The Planetary Society. The Planetary Society has no influence over decisions made by the UnmannedSpaceflight.com moderators. |
SUPPORT THE FORUM Unmannedspaceflight.com is funded by the Planetary Society. Please consider supporting our work and many other projects by donating to the Society or becoming a member. |
|