Printable Version of Topic
Click here to view this topic in its original format
Unmanned Spaceflight.com _ Titan _ Titan's Equatorial Sand Seas
Posted by: Juramike May 7 2007, 03:53 PM
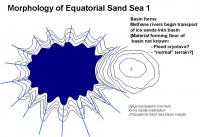
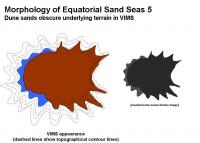
Ive put together a sequence of events that could explain the morphology of the Equatorial Sand Seas. (An example basin similar to Shangri-La is shown)
This could explain the ria-like topography [http://en.wikipedia.org/wiki/Ria] on the Eastern shore, as well as the VIMS dark blue western parts of the Sand seas, and the placement of the dark brown unit on the Eastern parts of the sand seas.
1. Basin formation.
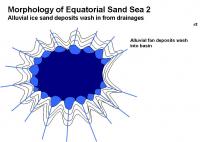
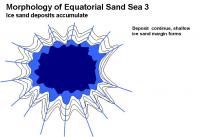
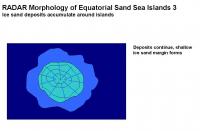
2. Water-ice sand deposition [slowly, suddenly?] forms an ice-sand margin
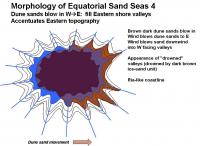
3. Mobile dark brown dune sands deposit on E side, depositing inland up W facing valleys.
|
|
|
|
|
:attachment]
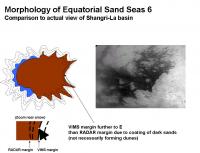
The dark brown sands will blow in following the predominantly W winds and make a dust coating on low-lying terrains on the eastern margins. This will be visible by VIMS and ISS as the dark-bright margin, placed inland from the "real margin" and will accentuate the local topography as seen by optical instruments. This accentuation on the E margin will make the Equatorial Sand Sea visible margin look swoopy and windblown (in effect, it is) from the dark basin. Similarly, the W margin will have a dark blue zone that appears blown from the western bright areas.
On the Eastern shore, the RADAR images will place the smooth-dark/mottled gray boundary far to the W of the VIMS brown dark-bright margin. (RADAR should be able to penetrate a thin coating of dark sands). The features in the limbo zone have been covered by dark sands, perhaps not enough to form dune structures, but enough to cover up the ice-sand margin, the near shore terrain, and perhaps even some of the underlying bright terrain.
This makes the deposition sequence in the Equatorial Sand Seas:
1: Basin formation
2. Major water ice sand emplacement
3. Dune sands cover up low-lying downwind valleys (enough to mask visible imagery)
Other Equatorial Sand Sea basins should look very similar around Titan: Shangri-La, Belet, Senkyo, Fensal and Quivra. Local winds may play a bonus role, but the overall trend of dark sand deposition up valley should be towards the E. For example: the false-color image in Figure 6 of the Soderblom paper seems to imply a predominant wind vector in Fensal and Quivra to the ESE.
[Im pretty sure all this has been described in pieces before, but it gave me a really great excuse to play with PowerPoint.
 ]
]-Mike
|
Posted by: Juramike May 8 2007, 11:44 PM
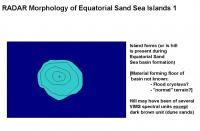
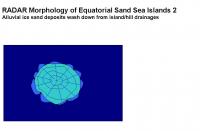
Ive put together another hypothetical series of events that could explain the RADAR appearance of many of the islands seen in the Equatorial Sand Sea.
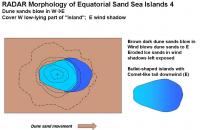
1. Hill/ridge formation, either before or after the Sand Sea basin forms or is partially filled in.
2. Water ice sand erodes off the hill, forming a debris apron or ice sand margin.
3. Mobile dark brown dune sands deposit on E side, but dont fill in downwind (E) in the wind shadow of the island.
|
|
|
|
|
:attachment]
This could explain the bullet-shaped appearance of the islands (or ridges) and the ghost-like tails that stretch downwind, usually towards the E. Other tectonic features, like grabens, would also show similar features.
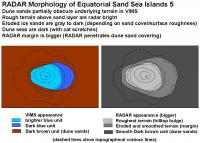
The relative height of the island above the equatorial dune sand level partly determines its appearance. Lower islands may not suffer erosion if they are covered by dune sands, so they may have a small or non-existant debris apron.. RADAR will penetrate the obscuring dune sands deeper, so the islands will appear bigger by RADAR than by VIMS or ISS. The eastern side of the island will have dark blue ice sands extending to the E as a tail. This may be visible in VIMS imaging until eventually obscured by a coating of dark brown unit dunes.
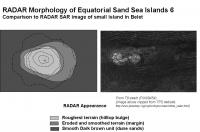
The islands and features in all the Equatorial Sand Sea basin should look very similar. Islands and ridges in Shangri-La, Belet, Senkyo, Fensal and Quivra should all share a similar appearance. Many of the island ridges may have started out as tectonic features, like parallel ridges (as observed to the W of the Huygens landing area), or hummocks poking out of the basin.
As an example, I pulled a RADAR image out of the T8 swath (http://photojournal.jpl.nasa.gov/catalog/PIA08454) {Actually, I used the http://www.planetary.org/explore/topics/saturn/titan_radar.html from TPS, for some reason it was clearer on my computer}
-Mike
|
Posted by: ngunn May 9 2007, 02:39 PM
Just in case you're wondering Mike I'm following your posts here with interest. It bothers me that if the prevailing winds are all one way there is still so much dune material out in the open that hasn't made it all the way to western side of a high obstacle by now. Either the wind reverses sometimes or the dune material is occasionally carried right over the 'continents' (without sticking) by exceptional gales. Also, what happens to a dune in a deluge? Shouldn't there be some dunes visibly damaged by flooding? Have we seen that anywhere? Does flooding somehow 'wipe the slate' from dark brown back to dark blue? Too many questions!!! I think we might answer some of them by following the Huygens flood deposits both upstream to their source and downstream to the first appearance of dune material, preferably with all of SAR, ISS and VIMS.
Posted by: remcook May 9 2007, 02:51 PM
I think a massive rain storm around the equator might be useful in that respect to shake things up a bit. I'm thinking equinox here  Let's hope all is still working and funded by then (only 2.5 more years!)
Posted by: Juramike May 9 2007, 05:35 PM

Those are excellent questions.
I'm trying to find RADAR images where an obvious stream crosses over either VIMS brown dark unit material or VIMS dark blue unit material.
If flooding does 'wipe the slate' from dark brown back to dark blue, I would expect to observe large dark blue margins in some areas along the Eastern shores. (as well as Northern, Southern, and Western shores - but the W ice sand margin is most susceptible to being covered up by windblown dune sands)
But we don't see any large ice sand margins in the E.
So the dune sand movement apparently happened AFTER the last major dark blue margin flood deposition event.
-Mike
Posted by: Littlebit May 9 2007, 05:55 PM
Very good questions. On earth, we definitely find 'prevailing drift' patterns to the east or west of mountains - even small hills.
Another factor to consider is the information released by NASA/Ciclops about the circulation of Saturn today. The atmosphere is flip-flopped from prior models - the 'dark bands' are thought to be drawn up from the deeper layers, while the 'light bands' are thought to originate in the upper atomosphere. This has application to Titan, if it is assumed the Dark bands of Saturn have the same or similar composition to the dark surface features of Titan. Is atmospheric chemistry on Titan a major or minor contributor to the color patterns we see on the surface?
Posted by: volcanopele May 10 2007, 07:15 PM
1. Hill/ridge formation, either before or after the Sand Sea basin forms or is partially filled in.
2. Water ice sand erodes off the hill, forming a debris apron or ice sand margin.
3. Mobile dark brown dune sands deposit on E side, but dont fill in downwind (E) in the wind shadow of the island.
Yep, that's just about right!
Posted by: Juramike May 10 2007, 11:00 PM
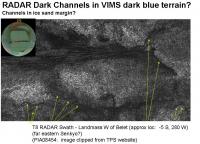
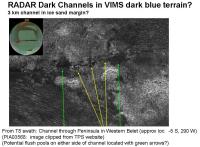
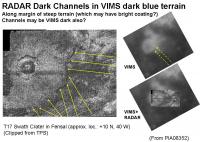
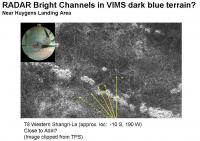
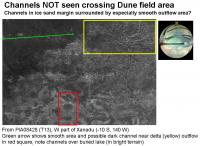
There are a few examples of both RADAR dark and RADAR bright channels lying on top of (presumably) VIMS dark blue deposits in the Equatorial Sand Seas.
These are shown here (channels indicated by yellow arrows):
|
|
|
|
I was not able to find any examples of a dune field clearly cut through by a channel (either bright or dark). The area near western Xanadu in the T13 RADAR swath shows a large delta complex that feeds into the Shangri-La. A channel may be barely visible, but it does not cut through a dune area located to the W. The dark smooth area may be where a broad outflow fan of ice sands was deposited, then overlain by dune seas. This is shown below (delta indicated inside yellow box, potential channel/outflow fan with green arrow):
|
So it appears that RADAR-dark channels and RADAR-bright channels overlay dark blue ice sands, but not dark brown dune sands.
So deposition sequence (first to last):
1) Dark blue ice sands
2) Channels (RADAR-bright/RADAR-dark)
3) Dark brown dune sands
This also implies that the dark blue ice sands are not always infinitely permeable to liquid. They can support a stream, at least in some locations. This is very similar to wet terrestrial sand. Perhaps the dark blue ice sands are almost saturated with liquid, or perhaps they have a slight barrier to the liquid (semi-permeable crust). Perhaps in most locations, a small decent-sized flow can soak in, but a massive flood event will scour across the surface for a distance. In some areas, permeability is locally reduced, and even normal amounts of flow will course across the surface.
Since a massive feeder network of channels and ponds is not observed, rain must be able to soak into the sands to some extent. (Impermeable dirt would quickly create an eroded out network.)
At the Huygens landing area, there are large and small channels visible in the straights off the island. There are also streams that flow off the island into the dark area. But I could not discern a connecting channel between the channels in the straight, and the outflow of the streams coming off the island. The outflow from the island streams seems absorbed by the dark blue ice sands. Perhaps the channels were carved during major flood events, presumably from the flow coming down the straight (SW to NE) and not from the island streams.
From the available data so far, RADAR-bright channels streaking across the ice-sands are not common. This implies that the equatorial sand seas are relatively flat. Irregular rough (RADAR bright) boulders cannot be supported by gradual slopes. The fact that we do observe channels does imply a slight change in elevation, so the Sand Seas are not totally flat. Further analysis should be able to determine flow direction (thus topography).
-Mike
Posted by: ngunn May 11 2007, 07:04 PM
1) Dark blue ice sands
2) Channels (RADAR-bright/RADAR-dark)
3) Dark brown dune sands
-Mike
Nice work, Mike. However I would propose an alternative caption to your 1 2 3 list as follows:
"Titan surface features in decreasing order of formation timescale:"
My reasoning is that the active processes involved are probably all concurrent over the long term. All that's needed to produce the apparent sequence is for the massive outwash floods to be very infrequent compared with 'ordinary' channel-forming rains and dune movement. I'm not even sure about the dunes coming third. Have you found any dunes that have drifted across (and blocked) a channel?
Posted by: Juramike May 11 2007, 07:34 PM
"Titan surface features in decreasing order of formation timescale:"
Ah, perfect: that the key phrase I was trying to come up with. Thanks!
All these process are occuring either simultaneously or episodicaly. From any given point, I'm asking "What is the last event that happened here to make it look this way?"
For example: a particular area may have had decades of stream deposition with dunes covering them at the same time, but then a massive flood came along and erased evidence of both of these events.
As for dunes covering over channels, I have not yet found any that clearly cut across a dark channel. (Anyone else seen one?)
-Mike
Posted by: Juramike May 11 2007, 09:46 PM
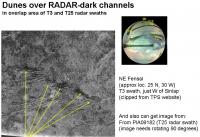
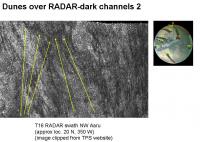
Here are some images and locations where dunes have partially buried a channel:
|
|
|
In the RADAR images of some of the dark channels in an earlier post (#8, above), dunes can be seen at the terminus of the channel.
I was not able to find any images where a channel was blocked by dunes, and then the channel was clearly modified by the blocking dune.
It appears that dune deposition is the "more-often happening event". The dunes are mobile. Or at least more mobile than the channels.
-Mike
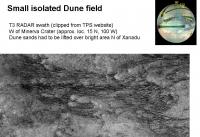
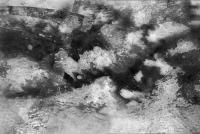
Posted by: Juramike May 11 2007, 10:08 PM
Here is an example of a smaller isolated Dune Sea. This is a smaller area to the W of Minerva Crater in an area North of Xanadu. It is bounded to the W by a bright area (continent? highland?) that presumably should block any sands from entering the basin.
|
Since there is a sand sea present, either:
A. Sand can go over the bright areas.
B. Sand can be washed in from bright areas.
C. Sand occasionally comes from other directions, but the prevailing flow is generally W. (In this case the basin would be a sand trap)
There are several (flat?) RADAR-darker areas in Xanadu that do not have cat-scratch dune fields. This implies that either the RADAR-bright material covers or modifies the sands, or that the sands are not able to flow over large continental masses.
Gee, I wonder what is the nature of the bright material?
-Mike
Posted by: lyford May 12 2007, 03:10 AM
Thanks for all the awesomeness, Juramike
Posted by: rlorenz May 12 2007, 03:40 PM
-Mike
Wish I had as much time to spend on analysing the Cassini data as you do!
Between Cassini observation planning and the Titan flagship study (presentation
to OPAG should go up on the OPAG website in due course), I'm barely
managing to read all the posts.....
I think in the bright area to the East of Menrva on T3 (with all the anabranching
channels) you will see a couple of faint dark streaks on the bright oval, suggesting
these are dunes that are superposed on a fluvial basin...
Posted by: ngunn May 12 2007, 07:35 PM
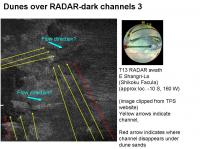
Mike, in your first illustration in post 11 (for example) I'm not quite sure what sequence of events is evidenced. Where your upper yellow arrows are pointing the dune pattern, including whatever constitutes the inter-dune surface, certainly continues uninterrupted. However it's not clear that the dark channel was continuous at this point until being buried by the dunes. Where the lower arrows are pointing is very interesting though. I can persuade myself that I am seeing a very narrow channel that has been 'recut' through the ends of the dunes. It would be interesting to look for more like that. (I'm sure you will!)
Posted by: ngunn May 12 2007, 08:01 PM
[quote name='rlorenz' date='May 12 2007, 04:40 PM' post='90040']
Titan flagship study (presentation
to OPAG should go up on the OPAG website in due course)
A b&w printout thereof is already on my coffee table. It's a lot easier to read than the Europa one if, like me, one isn't well versed in the latest management and planning jargon.
quote:
I'm barely
managing to read all the posts.....
 Thanks again for contributing here.
Posted by: Matt May 13 2007, 09:23 PM
I stumbled a publication (PDF) entitled: 'Comparative Sediment Transport By Flowing Liquid on Earth, Mars and Titan: Synthesis Of Theory And Observations'
It could be of some interest, although you probably already know about it.
However, it's the first time I have seen it....
Posted by: Matt May 13 2007, 09:28 PM
I stumbled upon a publication, rather.
Posted by: Mongo May 13 2007, 10:28 PM
^link?
Bill
Posted by: Matt May 13 2007, 11:00 PM
http://www.lpi.usra.edu/meetings/lpsc2007/pdf/2222.pdf
I'm new to all this linking stuff...let's see if I got it right....
Posted by: Juramike May 14 2007, 03:00 PM
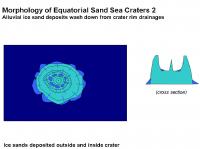
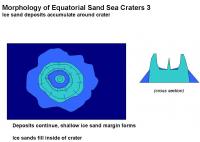
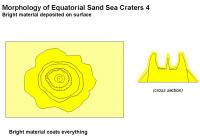
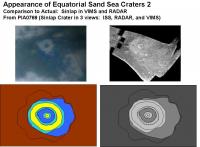
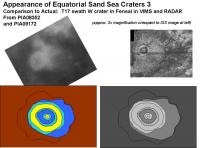
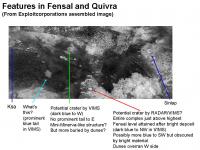
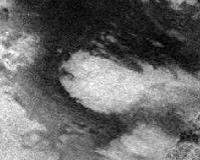
Ive put together a hypothetical sequence that could explain the RADAR and VIMS appearance of the craters observed in the Equatorial Sand Seas. (Craters such as Sinlap, the T17 swath crater in W Fensal, and Guabonito). This sequence also explains the puzzling appearance of the bright material which highlights the crater rims and central peaks.

|
|
|
|
|
|
|
1. Crater forms, either before or after the Sand Sea basin forms or is partially filled in..
2. Water ice sand erodes on outside of crater, forming a debris apron or ice sand margin.
3. Bright material is deposited.
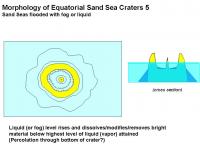
4. Liquid or fog percolates up to a set topographic level at the crater. All bright material below this line (highest sea level) is dissolved/modified/washed away.
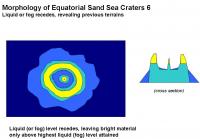
5. The liquid (fog) level retreats, leaving crater high and dry and revealing previous units.
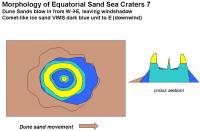
6. Mobile dark brown dune sands deposited on W side, but dont fill in downwind (E) in the wind shadow of the crater.
Here are some examples of what we would expect to observe from this scenario, compared to actual VIMS and RADAR images:
|
|
|
This nicely explains the bright material deposited on the rim of the crater, but not on the blue ice sand margins (in some of the craters like Sinlap). It also explains the bright deposit on the central peaks of Sinlap, as well as on the central peak of the crater-shaped feature NE of the Huygens Landing Site (seen in ISS)..
The key to this sequence is that the bright material was deposited BEFORE the last major sea level rise.
It is possible that each item in the sequence is periodic, rather than a one time deal. So the deposition of bright material is episodic and rare, floods are less rare, and dune sands move quite often.
The bright/dark line around the Equatorial Dune Seas are fixed by the last major sea level height attained in that basin after bright material was deposited.
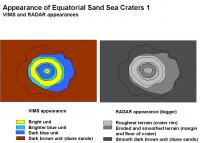
Craters that formed environments that were eventually deeply flooded will have a significant light blue and dark blue sand ice margin that extends outside the brightest material deposit (especially to the W). They will have a bulls-eye pattern in VIMS. Those craters that formed in areas that were only slightly covered in liquid at its highest point will have a very small blue ice sand margin that extends beyond the bright material these will have a very asymmetric look in VIMS (strong trailing to the E). Some craters were never inundated and thus would only have bright material covering the entire crater complex these may not show up by VIMS, only by RADAR.
Craters that formed in what was eventually a deep liquid environments include Sinlap, the Western T17 RADAR swath crater in Fensal, and Guabonito.
Craters that fomed in an enviroment that was eventually shallowly covered in liquid include Minerva, and the crater(?) that is on the W tip of Quivra (seen in the T25 RADAR swath)
Craters that formed in environments that were never inundated include the crater on the N end of Shikoku Faculae. (not obvious in ISS, but seen in RADAR).
By this analogy, Fensal is deeper than Aztlan. And Shangri-La nearest Xanadu is deep (subduction?) and Shangri La is very shallow near its contact with Adiri.
In general, areas with steep shorelines (highest level attained after the last bright stuff deposition event) will have fewer indentations and have a smoother light/dark border (i.e. Xanadu). Areas with shallow shores with relative highest topography closest to highest sea level height will have very jagged and irregular bright/dark borders (ancient bright stuff/liquid shorelines). From this we would predict that average elevation of Adiri is very close to the highest attained level. It may be an area that has been gently upwarped to a level just slightly above the highest attained sea level in Shangri-La basin after the last bright stuff deposition event.
The bright island at the Huygens Landing Site sits just above the level of the highest level of liquid attained in Shangri-La after the last bright stuff deposition event. The bright/dark contact line of the highland sits at the highest level of liquid attained in the Shangri-La basin. In the channel some of the sand bars have bright material deposited on them. This should allow us to link the two units. The bright stuff on the sand bars would also be just poking above the highest level of liquid attained in the Shangri-La basin after the last bright stuff deposition event..
The analogy of the Great Basin of North America, painted white, and then flooded with a Glacial Lake Bonneville amount of turpentine and then drained seems pretty close. (Possibly very close chemically).
-Mike
Posted by: Exploitcorporations May 14 2007, 06:30 PM
This seems like as good a place as any to deposit this experiment, rather than resurrecting the old map thread. This is a largely cosmetic retooling of the Fensal-Aztlan portion of the global map with the currently released SAR swaths overlain (T3. T13, T16, T17, T25). The resolution here is barely decent enough to make out the dunes in places, but it gives a pretty good indication of what sort of mapping products will be possible from these growing datasets.
|
Posted by: Juramike May 14 2007, 06:40 PM
Wow! Thank you, Exploitcorporations!
(Looks like I muffed the image of the VIMS inset of the T17 W Fensal crater. I thought it was the crater at the north nortwest end of your image (it just got missed by the T17 swath, although the southern debris apron might've gotten picked up). I should have grabbed the image of the crater much further to the W. It's interesting how those two craters look fairly similar with a slight "wing" off the NW part of the crater.)
I would predict that when this "bulls-eye crater" is imaged by RADAR SAR, that it will look very similar to the T17 W Fensal crater, and to Sinlap crater (but possibly with an even bigger apron).
-Mike
Posted by: remcook May 14 2007, 07:06 PM
simply...wow! amazing how sharp it is!
Posted by: volcanopele May 14 2007, 07:44 PM
-Mike
What crater? Are you talking about the feature that you thought was Ksa?
Posted by: Juramike May 14 2007, 08:22 PM
(I think when the boss-man finds out, I'm doomed!
 )
)But thank in advance for all your suggestions, input , and helpful guidance when you are able!
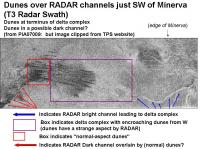
The perfect "smoking gun" SAR RADAR image would have a N or S flowing channel which is either cut by or cuts into the E-->W flowing dune features. I haven't found this yet. [Odd, I'm kinda suspecting that most tectonic features seem to trend E-W in the equatorial zone].
Based on Dr. Lorenz's suggestion, I found an interesting are to the SW of Minerva that consists of a bright stream (pretty much originating at the outer wall of the crater) that feeds into a delta complex that is being encroached upon by dunes. (Or is the delta encroaching the dune field? based on the sharpness of the dunes lines at the E edge, I think it is the dunes encroaching upon the delta). These dunes have a funky look. Further to the SW it appears to be a channel with dunes lying across a RADAR-dark channel.
Here is the annotated image:
|
Is the RADAR-dark channel continuous (in this location or the other locations)? I really can't say, but I would strongly speculate that the dunes are lying on top of a continuous dark channel.
-Mike
P.S. "Anabranch" is my new word for the day!
Posted by: Juramike May 14 2007, 09:15 PM
The RADAR image in my post is of Ksa (I got that one right).
The ISS image (which I thought was Ksa, but it is not) is of the feature at center top mentioned in the second image of your previous http://www.unmannedspaceflight.com/index.php?s=&showtopic=3177&view=findpost&p=67671.
I've indicated some of these features in a section clipped from the wonderful mosaic posted today (thanks, again!) by Exploitcorporations:
|
In Figure 6 of the Soderblom et al paper "Corellations between Cassini VIMS spectra and RADAR SAR images: Implications fo Titan's surface composition and the character of the Huygens probe landing site", this feature in the VIMS processing to make Figure 6 has a very small blue ring around it. (I'd also argue that his larger buddy to the E also looks similar). I suspect that this is a very low-lying crater (old?) that when eventually imaged by RADAR will look like a miniature version of Minerva. (Mini-Minerva?).
To the SW is an interesting feature that also has a blue tail in VIMS, but seems relatively dim by ISS. Could this be another type of feature (cryovolcano?) or a very low-lying crater that did not get a large dusting of bright material or suffered only partial scrubbing?
Can't wait for more RADAR!
-Mike
Posted by: volcanopele May 14 2007, 09:29 PM
hmm, I suspect that the feature you thought was Ksa is actually a Ganesa-type cryovolcano, with a flow to the east and north...
Posted by: Juramike May 14 2007, 09:40 PM
Are there easy ways to discern between a cryovolcano and an impact feature?
-Mike
Posted by: volcanopele May 14 2007, 09:56 PM
Well, it would be nice if it erupted. That would make it much easier 
To be honest, it would require a good ISS/VIMS observation of Ganesa to determine what a Ganesa-type feature looks like in VIMS and ISS images. My basis for saying, at the very least, to hold off on declaring that feature a crater, is that while it is circular, there are a number of other ways to form circular features, like the Ganesa-type pancake dome. The apparent flow to the east and north and the fact that it doesn't match the appearance of other dark terrain craters (Guabonito, Sinlap, Velas, and the guy north of Adiri), with very dark interiors, intermediate albedo crater walls, and bright raised rims/ejecta blankets also suggest that we should serious consider a cryovolcanic origin for this feature. But, I'll admit the evidence is about as conclusive as Tortola Facula (the VIMS snail from Ta) being a cryovolcano.
Posted by: Juramike May 17 2007, 06:43 PM
Hmmm. Actually, there might be a way to see a recently erupted cryovolcano, at least in the dark basins:
If the hypothetical scenario presented above (post#21) is correct, anything that recently coughed up bright material (ammonium sulfate + other salts?) AFTER the last bright-material-dissolving event should be pretty obvious by VIMS and RADAR.
In that case, we would expect a ISS and VIMS stain in the dark basin that would be larger than the RADAR signature. (Older features that had their bases scrubbed should have a smaller ISS and VIMS stain compared to RADAR.)
Similarly, any impacts (or bulges that did not release bright salt material) in the dark brown basins after the last bright-material-dissolving event should be dark brown. They should not have any VIMS or ISS bright material on them compared to their surrounding area. Are there any craters visible only by RADAR that appear dark brown by VIMS?
-Mike
Posted by: Exploitcorporations May 18 2007, 01:35 AM
Here's another work in progress. This makeover of the Adiri-Shangri-La regional view is cobbled together from the ISS basemap (10/06), the obligatory SAR swaths (T8/T13), raw frames from the 13 May T30 encounter, the nifty CICLOPS "looking ahead" Celestia mosaics, and a cannibalized 1/64th of Paul McCartney's birthday present. This is presented in the standard Exploitcorporations LLMF Equal-Area Projection ™, so plan on losing your blimp anywhere west of the center of the map.
|
Posted by: Phil Stooke May 18 2007, 01:48 AM
Very nice. I hope you will do more of these.
Phil
Posted by: belleraphon1 May 18 2007, 02:09 AM
Exploitcorporations
All your work is breathtaking. Agree with Phil Stooke. Please continue!!!!! Just Wonderful!!!!!
Craig
Posted by: Juramike May 18 2007, 03:28 PM
Wow!! That is totally awesome!!!
I just rearranged my office posters to make room for these!!
Thank you for all your efforts to make these images!!
-Mike
Posted by: Juramike May 21 2007, 08:06 PM
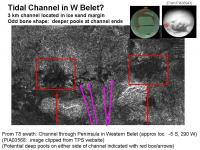
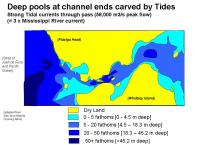
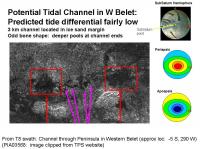
One of the dark channels from the T8 RADAR swath in western Belet (or eastern Senkyo) has a very curious appearance: at both ends of the of the 3 km channel there are RADAR dark smooth areas that is over 25 km2 in size. This symmetrical bone shaped appearance may have resulted from a tidal current flushing back and forth through the channel.
|
|
|
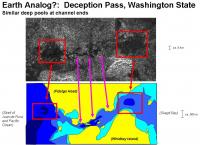
For comparision, I have compared the zoomed RADAR image of the Dark Channel in W Belet with a graphic showing marine topography of Deception Pass in Washington State (Deception Pass Coordinates: 48 degrees 24 23N; 122 degrees 5840 W). Deception Pass is located near the San Juan and Gulf Islands in Washington/British Columbia. This island group was formed through crustal extension and inundation to form an archipelago (sound familiar?). The entire the island group (especially the Gulf Islands of British Columbia) appear morphologically similar to areas on Titan. Deception Pass is notable for having an extremely strong current due to tidal effects. (A Seattle Times article on Deception Pass can be found http://archives.seattletimes.nwsource.com/cgi-bin/texis.cgi/web/vortex/display?slug=deception29m&date=20020729.)
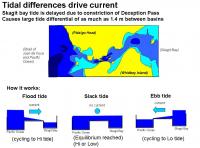
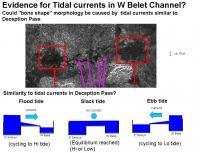
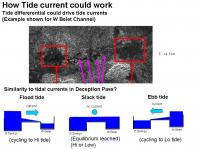
The way Deception Pass (and by analogy, the W Belet Dark Channel) develops ferocious tides is shown in the graphic below:
|
|
1. Tidal bulge reaches from the Pacific Ocean into the Strait of Juan de Fuca.
2. Sea level on the west side of the Pass rises faster than the sea level on the eastern (Skagit Bay) side of the Pass.
3. Height difference of 4.5 feet between the two sides causes eastward flow of 56,000 m3/s water through the channel
(for comparison, the Mississippi River average flow is 17,600 m3/s).
4. As the sea levels on either side of the Pass eventually equilibrate, from both water flowing into Skagit Bay from through the Pass, and the longer route around Whidbey Island, the flow through the channel drops to near zero.
5. Tide bulge leaves Pacific
6. Sea level on west side of Pass drops faster than Skagit Bay can empty out.
7. New height differenential sets up, now current flows west (Skagit BayPacific) through Pass (Ebb tide cycling to Lo).
8. Skagit bay sea level drops, sea level differential drops to zero, flow through channel drops to near zero.
In the Google Earth image you can actually tell which way the current is flowing when the Google Earth image was taken (Hint: Flood tide into Skagit Bay).
The deeper areas at the two entrances to the Pass are swept clean from the current. (The Skagit River dumps a huge amount of sediment into the bay, if the current did not sweep the sediment out to sea, all the topography on the Skagit bay side would become a mudflat, similar to the area at the extreme NE of the Deception Pass graphic). There are other tidal channels in the San Juan Islands that display almost the same pattern of bottom topography: a narrow channel with localized depressions (deeper areas) at both tide channel exits. (Examples include: San Juan Channel; Spieden Channel; Harney Channel; Upright Channel; and Thatcher Pass.)
The Dark Channel in western Belet (or eastern Senkyo) is approximately 3 km wide. This is 6x wider than Deception Pass.
Using the formula [Flow (m3/sec) = 0.46 X1.61 channel width (m) ^1.22] that was used for other channels on Titan, we arrive at a predicted flow of 13,000 m3/s for the W Belet Dark Channel..
Extrapolating from Deception Pass numbers (Pass width = 500 m), we instead arrive at an extrapolated flow of 336,000 m3/s for the W Belet Dark Channel.
Either way, its pretty impressive. Given the relative size of the dark areas at the ends of the channel (>25 km2!), I would be inclined to favor the larger numbers.
If this is a tidal channel on Titan, it tells us several very important things.
1. There was a large sea or ocean in this area.
2. The sea or ocean lasted long enough to experience several tide cycles (with a 14 day cycle?)
3. Large flow rates were set up through the tidal channel.
4. The basin on the W is approximately at the same level as the basin on the E (at least the high methane mark)
(An alternate possibility to be considered is that the channel is bi-directional and resulted from a single/multiple flood events going from E to W, then later from W to E.)
If the deposition sequence put forward in post http://archives.seattletimes.nwsource.com/cgi-bin/texis.cgi/web/vortex/display?slug=deception29m&date=20020729 is correct, we would expect that this channel should appear dark by ISS. I would expect that during the time the channel was inundated, tidal currents would have swept the Dark Channel clear of loose sediments. So this area may be relatively clear of ice sands and windblown dune sands compared to other areas in the Equatorial Dune Seas. If the channel bottom can be resolved by VIMS, the channel itself may be very interesting it may give us a glimpse into the bottom substrate that exists under the dune seas. Im hoping this area gets observed during the upcoming May 31 pass.
I wonder if other tidal channels can be found by further examination of RADAR or VIMS images of Titans surface?
Could we use these to infer the tidal pattern and current flows of past methane seas on Titan? (Astropaleohydrology?)
-Mike
Posted by: helvick May 21 2007, 08:19 PM
Surely Titan's Saturn synchronous orbit would inhibit tides ?
Posted by: Juramike May 21 2007, 08:34 PM
I woulda thought so, too.
But Tokano et al. invoke Titan's orbital eccentricity around Saturn as causing tidal winds on Titan. (Tokano, T; Neubauer, F. M. Icarus, 2002, 158 499-515. "Tidal winds on Titan caused by Saturn." Abstract available http://www.ingentaconnect.com/content/ap/is/2002/00000158/00000002/art06883)
Their paper is discussing tidal winds in the atmosphere, but their arguments (and diagrams) would also seem to extend to large bodies of fluids on Titan's surface.
-Mike
Posted by: alan May 22 2007, 01:04 AM
I remember reading a paper before Cassini reached Saturn that claimed Titan couldn't have oceans and continents because the tides would produce enough erosion to eventuallly wear down the continents until they were below sea level.
Posted by: Mongo May 22 2007, 01:42 AM
If Titan had global oceans on its surface, its tides would be enormous. Saturn's gravity well is far deeper than Luna's, and the eccentricity of Titan's orbit would be sufficient to induce tides measured in hundreds of metres. I worked through the calculation in an earlier post a couple of years ago, and came up with a result of about 150m.
(the tides are not caused by rotation within the tidally influencing body's gravity well, but by the local gravity differential across the diameter of Titan varying in strength due to the eccentricity of Titan's orbit)
Since there is no global surface ocean on Titan, the tides would be proportionately smaller. I have to imagine that even such relatively small seas as we do see must have a tidal range of several metres, depending on the differential distance to Saturn between the closest and farthest points of the sea surface. At a first estimate, each 100km difference in distance to Saturn between the closest-to-Saturn and farthest-from-Saturn points of a single sea on Titan should produce about 3m of tidal range at those extremities. This tide would take the form of a 'slosh' with a period of roughly 15 days, with the sea levels on the sub-Saturn hemisphere reaching a maximum at the point closest to Saturn, and minimum at the point farthest from Saturn, when Titan is closest to Saturn, and the opposite pattern -- the sea levels at a minimum at the point closest to Saturn, and maximum at the point farthest from Saturn -- when Titan is farthest from Saturn. The shoreline midway between these two points should have little or no tidal range. Seas on the anti-Saturn hemisphere would have the opposite tidal pattern.
Of course, local seabottom topography would have a big effect on tidal ranges too.
Bill
Posted by: AlexBlackwell May 22 2007, 01:44 AM
You're probably referring to one of the two following papers:
The tide in the seas of Titan
Carl Sagan and Stanley F. Dermott
Nature 300, 731-733 (1982).
http://www.nature.com/nature/journal/v300/n5894/abs/300731a0.html
Tidal effects of disconnected hydrocarbon seas on Titan
Stanley F. Dermott and Carl Sagan
Nature 374, 238-240 (1995).
http://www.nature.com/nature/journal/v374/n6519/abs/374238a0.html
Posted by: ngunn May 22 2007, 09:28 AM
We have a beautiful example of a tidal channel here in North Wales - the Menai Strait:
http://biology.bangor.ac.uk/research/wetland/conference/index_files/image032.jpg
Tidal range is up to 10m at one end and about half as much at the other. The phase difference is about one hour beween the two ends. Currents reach 8 knots. there are several deep spots including one near the NE end.
Posted by: ngunn May 22 2007, 12:17 PM
Menai Strait chart attached:
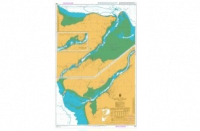
|
Note that this is quite a young feature - it has probably widened and deepened considerably even since Roman times. I guess the same could be true for the Titan feature, so you might only need a (relatively) brief wet episode to produce it.
Posted by: Juramike May 22 2007, 02:24 PM
(I sooooo totally could not resist this...)
Further support for the similarity between Titan's archipeligos and the San Juan Islands of the Pacific Northwest:
http://www.amazon.com/Gunkholing-San-Juan-Islands-Bailey/dp/0944257046.
-Mike 
Posted by: ngunn May 22 2007, 04:33 PM
If we are saying that the equatorial basins once contained liquid then presumably tides could have caused much larger scale erosion features than just that small winding channel in Western Belet. In fact it could have been a major factor shaping the morphology of the basins, particularly their margins. Is this what you have in mind, Juramike? That could mean that quite a lot of the streaky features that we have been thinking about in terms of dunes and prevailing wind patterns are really tidal erosion features merely exploited and rendered more visible (like a fingerprint) by a 'dusting' of dune material. Some of the funny directions might make more sense that way. I have never been entirely happy about the wind patterns on Titan being redirected in major ways by what is really quite modest topography, but liquid would be another matter.
Posted by: Juramike May 22 2007, 06:02 PM
Yup. That's what I'm thinking:
1. Basic morphology of the archipeligoes set up from impacts and crustal extensions (maybe even plate subductions?)
2. Grabens and basins partially filled up with eroded sands.
3. Bright stuff deposited from cryovolcanic venting.
4. Inundation with methane (removes lower parts of bright stuff, and sets up tidal channels which accentuates topography of grabens ("dancing monkey" of T28?).
5. Dune sands blowing around with the prevailing W wind.
There may have been several cycles of inundation/tidal erosion and bright stuff deposition.
If we see an obvious tidal channel (from RADAR) that is VIMS bright, we could argue that the particular tide channel was set in place in an earlier inundation/ocean event that occured BEFORE the last bright stuff deposition. (i.e. massive big huge inundation/tidal erosion-->bright stuff deposition-->big inundation leaves the lower bathtub ring).
I have not seen any obvious signs of earlier pre-latest-bright-stuff shorelines or benches (except maybe the "Ghost Coast" area in NW Xanadu in the T13 RADAR swath).
-Mike
Posted by: David May 22 2007, 07:10 PM
Are the sand basins really very far below the surrounding light-colored regions? If they were liquid-filled, how deep would they be?
Posted by: Juramike May 23 2007, 02:28 PM
Those are really, really good questions!
How deep from "highest sea level since bright stuff deposition" to lowest sediment level in the basin?
(How much liquid did the basins hold at the last flood event?)
And also how deep is the dune/ice sand layer to the basin substrate?
(How much sediment has washed in?)
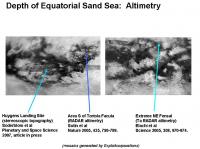
The only papers I have found with altimetry data tracks over Equatorial Sand Sea basins are:
Soderblom et al Planetary and Space Science, 2007, article in press. (Topography of Huygens landing site areas)
Sotin et al. Nature, 2005, 435, 786-789. (Topography of line offshore S of "Snail" feature in Shangri-La)
Elachi et al. Science, 2005, 308, 970-974. (Topography of line in NE Fensal? (or did it just miss the basin?))
Rodriguez et al LPS (2007) Abstract (and figure) freely available http://www.lpi.usra.edu/meetings/lpsc2007/pdf/1679.pdf. (I think this is the same track as in Elachi paper - NE Fensal?)
Does anyone know if there have been any other altimeter or topograhic data released of an Equatorial Sand Sea basin?
-Mike
Posted by: ngunn May 23 2007, 02:53 PM
Another question, Mike. I'm looking at the 'sliced carrot'/'Mcnaught tail' feature to the north of Adiri. To me that looks like a wide ridge (possibly a very large ancient crater rim) eroded through in several places by tidal currents. The northeastern margin of Belet shows a lot of lineation trending roughly the same way which could also have arisen from somewhat more random original topography modified by tidal action. Does that fit with your picture?
Posted by: Littlebit May 23 2007, 03:16 PM
Excellant theory, Mike. If the sand dunes are still active - not frozen, we should see patterns change; and if the dunes are moving, the channels are likely being replowed, at least seasonally, by active tides. This is the best explanation I have seen for both the oddball flow patterns suggested by the 'channel', the connected 'lakes'; and the competing dune and gorge terrain.
Posted by: Juramike May 23 2007, 03:23 PM
Ngunn, it fits pretty close.
I suspect that there may be some type of fracture/fault? lines that trend more or less E-W in many areas of equatorial Titan (the parallel "ski tracks" in the T8 swath are really curious). This might hasten erosion along the fracture/fault? lines (erosion first by rain, wind, then eventually tidal action during inundation).
So the "sliced carrot" feature N of Adiri does look like the eastern wall of a crater that got eroded to the point of breakthrough. It'd be neat to see if there are any EW trending RADAR-dark tidal channels between the remaining ramparts.
Here's a pretty cool abstract regarding streamlined features on Titan: Burr et al. LPS 36 (2005) "Theoretical calculations of sediment transport on Titan, and the possible production of streamlined forms." Abstract available freely http://www.lpi.usra.edu/meetings/lpsc2005/pdf/2044.pdf.
The kicker quote: "Additionally or alternatively, streamlining could occur in hydrocarbon oceans due to coastal currents or basin scale circulation, in a manner analogous to streamlining in marine environments on Earth."
If the ramparts do show tidal channels, I wonder if the E side of any islands in the channel are now streamlined? (So instead of a comet shape pointing W, maybe in these areas the currents shaped a symmetrical streamlined island so that the E side is also bullet shaped like the W.)
-Mike
Posted by: ngunn May 23 2007, 03:50 PM
I certainly find these ideas plausible - and now you have some specific testable predictions at a specific location. Does the sliced carrot coincide with any planned RADAR swath as far as we know?
Thanks for that link.
Posted by: alan May 24 2007, 01:00 AM
Would the strength of these tides tides vary with latitude? If so I can see this as an additional reason for the lakes being concentrted at the poles. Stronger tides at low latitudes could result in liquid filled basins being enlarged by tidal motion. Eventually they could reach the point where increased evaporation or seepage caused them to dry up.
Posted by: rlorenz May 26 2007, 01:29 PM
Yes - the strength varies with latitude (and longitude) - specifically with distance
from the subsaturn point.
A brief intro to tides on Titan and their effect on lakes (from 1993 - it includes some
predicted landforms that, er, well, havent been borne out by observations so far, let's
say - but it lays out some useful fundamentals) is at
http://www.lpl.arizona.edu/~rlorenz/craterlakes.pdf
Tides are generally weaker at high latitudes. I dont think tides explains why we find
liquids where we do (but they may be responsible for the lack of wave-type features
on shorelines like sandbars - tidal displacement of the waterline is larger than typical
waveheight..)
Posted by: Juramike May 29 2007, 04:33 PM
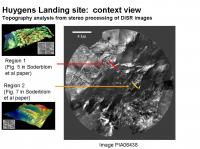
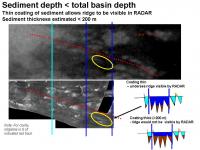
I used the published altimetry data to try and estimate the average depth of the Equatorial Sand Seas. The slides below show estimated traces adapted from released data.
|
|
|
|
|
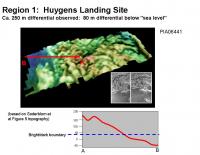
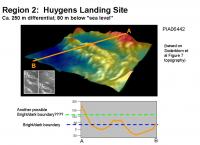
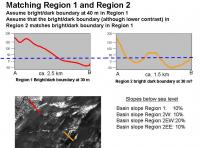
DISR image interpretation gave relative topographical maps of two regions near the Huygens Landing Site. Region 1 is the island, and Region 2 is one of the potholes of the sandbar in the offshore channel (the spooky dude formation. It is assumed that the absolute topographic elevation of the two determined regions (Region 1 and Region 2) is the same. In both regions, the bright/dark boundary was estimated to be at ca. 30 m in the referenced figures.
[The highest points of the channel sandbar (region 2) are at 140 m above the bright/dark boundary. It is difficult to understand how a streambed deposit could have an elevation above the maximum sea level. (Unless maybe the sandbar was emplaced by an earlier and even higher inundation??) ]
|
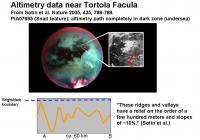
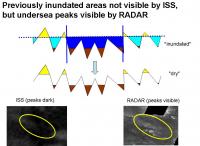
Altimetry data from the Shangri-La basin immediately S of Tortola Facula showed a series of parallel E-W ridges that varied by several hundred meters. Since these are not ISS-bright, they must lie below sea level, (below the bright/dark boundary). Thus, the elevations below sea level are estimated to be at least 0-200 m deep. [200 is minimal interpretation of several hundred meters]
|
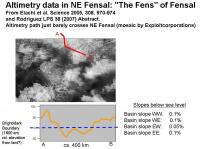
The Ta altimetry trace just crosses extreme NE Fesal. Altimetry shows a shallow dip, indicating that Fensal is very shallow in this area.
|
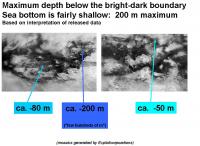
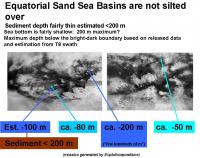
Maximum depths observed:
Shangri-La basin (Huygens Landing site): at least 80 m deep
Shangri-La basin (S of Tortola Facula): at least 200 m deep
Extreme NE Fensal basin: 50 m deep
With this limited data, it appears that the basins (or at least its edges) are fairly shallow. Thus during the last inundation, the basins would have resembled shallow seas, not deep oceans.
-Mike
Posted by: JRehling May 29 2007, 05:10 PM
[...]
With this limited data, it appears that the basins (or at least its edges) are fairly shallow. Thus during the last inundation, the basins would have resembled shallow seas, not deep oceans.
-Mike
Nice work.
A companion analysis would be to say what kind of relief can be supported by H2O ice at these temperatures / acceleration due to gravity. Ganymede makes a very handy reference. DEMs from G1/G2 and from Voyager/G8 show delta-elevations of about 1500 m.
Take that empirical result with a grain of salt or two -- the uplift could be different in the two cases, and Titan may not be in steady state. And moreover, the stereo coverage of Ganymede is extremely limited. Also, the sand seas should be able to make steep icy slopes more "buoyant" than when they are exposed to the vacuum of space. That could preserve some deeper gorges that are under "sea level".
We shouldn't be surprised, though, if we find out that most of Titan's surface (including the icy surface submerged under sand seas) is within a range of 1500 meters or so of elevation. Since the sand seas occupy only a small fraction of the distribution [at the bottom, obviously], one would naively expect a depth that is a comparable fraction of the range. Eg, 1/10th of the range is about the bottom 150 meters. That happens to nail Juramike's estimates working from another direction.
Given the sharp linear features around Aztlan in particular, perhaps there are some isolated "Marianas Trench" locales where the sand seas are particularly deep, but that wouldn't operate across their full breadth, for sure.
Posted by: Juramike May 29 2007, 06:18 PM
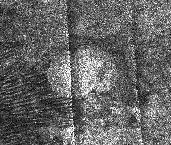
I used the "ski tracks" feature in the T8 swath to attempt to speculate on the depth of the sediments in W Shangri-La.
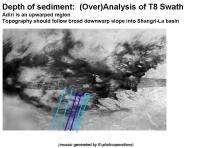
|
|
|
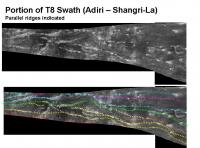
The bright terrain Adiri appears to be an upwarped terrain that was left above sea level during the last major inundation. There is an interesting series of parallel ridges in the T8 swath that run predominantly E-W along the southern margin of the Shangri-La basin and continue across Adiri. These ridges have been upwarped across Adiri (or downwarped to form the Shangri-La basin). In Adiri, the ridges are coated in bright material, but as one tracks eastward, the ridges slope gently down below sea level and the bright material is no longer present. Entering the Shangri-La basin, the ridges can not be discerned by ISS, but still remain visible in RADAR images. As the ridges begin reemerge above "sea level" further E, the ridges reappear in ISS imagery in the area to the N of Perkunas Virgae. (The ridges (and valleys) themselves are parallel to Bacab Virgae).
Several of these ridges can be traced in the T8 swath. (I highlighted about 8 trending EW).
Interestingly, the fault highlighted by Soderblom et al. on the island next to the Huygens Landing Site runs parallel to these ridgelines. It seems likely the island closest to the Huygens Landing Site is an exposed section of one of these ridges.
Across the entire southern section of Shangri-La there are features that are oriented parallel to these ridges: these include Bacab Virgae, and the undersea parallel ridges S of Tortola Facula that were examined by altimetry.
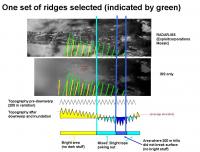
|
It seem reasonable to estimate that the that the ridges and valleys in the parallel system have elevation differences of 200-300 m. (Based on Huygens Island topography analysis 250 m and the similar set of EW undersea parallel ridges S of Tortola Facula that varied by several hundred meters).
If we select one ridge in RADAR (green dashed line), we can follow it in ISS from the bright Adiri terrain into where it breaks up into exposed bright islands at the margin of Adiri (light blue line), until it disappears into Shangri-La (dark blue line), only to reemerge again into exposed bright islands (dark blue line). The light blue line shows where the valley was inundated (no more bright material on valley floor), and the dark blue line shows where the ridge tops were inundated (bright material removed even from ridgetops). Assuming the ridgeline to valley floor has an elevation difference of 200 m, the distance between the light blue line and the dark blue line can be used to derive the slope of the warp. This is approximately 200 m in 200 km, or 0.1%.
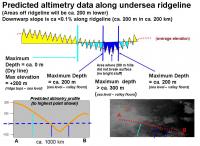
|
|
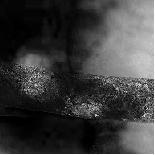
Extrapolating this slope into the "sea", we can estimate the depth of this section of Shangri-La basin. (In the slide, the red line is drawn in the valley just N and parallel to the ridgeline track in order to not obscure the ridge.) This would be estimated to be 100 m from sea level to ridgeline top. (Or 300 m from sea level to valley floor). An estimated (predicted) altimetry track is shown. [This track is close to the future T41 RADAR track]. These values are in the same ballpark as previously determined depths (above posts).
The area bounded by the dark blue lines and along the ridgeline is highlighted in yellow. By ISS, no bright ridges are observed. This makes sense: from the above analysis, the ridgetops would have been inundated (by 100 m of solvent) , and no bright coating would be expected. But in this same area, ridges can be observed by RADAR. This implies that the ridge tops are RADAR-visible above the lower level of sediment or loose dune sands. Since the ridge tops are 200 m above the valley floor, that implies that the sediment layer lying on the valley floor is less than 200 m thick.
(If the sediments were thicker than 200 m, the undersea ridges would not be visible by RADAR).
|
So the bottom line ( yup! I intened that!
 ) is that the Equatorial Sand Seas are relatively shallow (compared to Earth) but are not silted over.
-Mike
Posted by: Stu May 29 2007, 06:45 PM
Fascinating reading as always Juramike, thanks. You put a lot of effort into those posts, and it's appreciated.
I'm interested to hear what you think this feature - I think it's been called "the Spaghetti" somewhere here - actually is?
|
Silted-up drainage channels? Faults? Cryo-volcano run-offs?

Posted by: Juramike May 29 2007, 07:17 PM
My WAG about the "dancing monkey" or "spaghetti" feature is that faulting, erosion, inundation, and cryo-volcanism were all players.
1. Faulting makes a bunch of grabens. (generally trending EW)
2. Erosion during methane rainstorms and inundations occur. (Tidal flushing a factor interconnecting the lines?)
3. A cryovolcano somewhere (Xanadu?) coughs up bright material that gets distributed all over. Bright stuff deposited.
(My wild suspicion is that Xanadu is a major cryovolcanic complex and coughs bright material that distributes mostly in the equatorial/mid latitude region. I suspect Xanadu on Titan is the equivalent of Tharsis on Mars).
4. The last major indundation occurs and strips bright stuff below "sea level". Dark blue ice sand sediments washed in to basins. (Are any blown in? VIMS could provide evidence by seeing if any of the dark brown dune sands are present in the bottom)
I'm not sure what made initial graben as a series of curvy cross cut patterns in this area compared to the straight lines in other areas. Maybe a comparison can be drawn with Callisto, Ganymede, and Europa with regards to the formation of ridges and grooves seen on those icy moons?
-Mike
Posted by: Juramike Jun 4 2007, 04:31 PM
http://www.lpl.arizona.edu/~rlorenz/craterlakes.pdf
I attempted to relate the tide effects mentioned above and in other (papers you gotta pay for) to the Channel in W Belet.
Here are the non-free references:
Sagan and Dermott Nature 1982, 300, 731-733. "The tide in the seas of Titan".
Dermott and Sagan Nature 1995, 374, 238-240. "Tidal effects of disconnected hydrocarbon seas on Titan".
Tokano and Neubauer Icarus 2002, 158-499-515. "Tidal Winds on Titan Caused by Saturn."
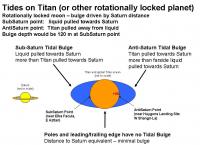
The figures attached describe the tidal effects of tidally locked planet with significant orbital eccentricity and a global ocean. (e.g. Titan, but with a global ocean):
|
|
|
The tidal bulge is set by the gravitational attraction by the influencing body (e.g. Saturn on Titan).
At the sub-Saturn point, Saturn pulls on the hydrocarbon ocean since the ocean is closer to Saturn than the core of Titan. (Think of it as Saturn trying to accelerate the ocean away from Titan).
At the anti-Saturn point, Saturn pulls on the core of Titan more than the hydrocarbon carbon ocean which is further from Saturn. (Think of it as Saturn trying to accelerate Titan away from the ocean.)
At the poles and hemisphere edges, the ocean is at the same relative distance from Saturn and the core of Titan, so there is no bulge at these locations.
(For more info, check out: http://en.wikipedia.org/wiki/Tidal_bulge
http://home.hiwaay.net/~krcool/Astro/moon/moontides/ )
Since Titan is tidally locked, and the same point (more or less) faces Saturn, the tidal bulge is pretty much frozen in place. From Sagan et al. the tidal bulge of a theoretical global hydrocarbon ocean on Titan would be 120 m higher at the sub-Saturn point and at the anti-Saturn point.
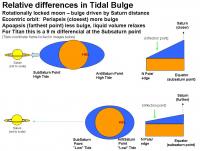
The tide is set by the relative height differential of the tidal bulge. If Titans orbit were perfectly circular, there would be no difference and the sub-Saturn point tidal bulge would always be at 120 m. So no differential, thus no tide.
But Titan has an eccentric orbit. (e = 0.0289).
When Saturn is closer to Titan, the tidal bulges are more accentuated than when it is farther away. This is by 9% (3e = 3 x 0.0289), or 9 m higher at the sub-Saturn point.
When Saturn is farther away, the bulge is lower by 9 m. But since the liquid volume is fixed, the excess mass gets distributed to the remainder of the ocean. So the ocean height at the hemisphere edge increases (slightly all that 9 m of bulge differential is distributing over a much, much larger area). This increase would be the local high tide at the periphery of the hemisphere and poles.
There will also be a point of inflection that would not experience any tidal differential.
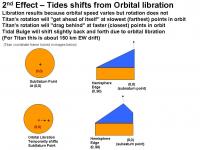
In addition, there is a slight effect due to orbital libration. This causes a drift along the equator of 150 km of the tidal bulge of the sub-Saturn (and thus anti-Saturn) points. This would result from the rotation of Titan being fixed but the orbital speed is variable. At it reaches periapsis, Titan is zipping along and the rotation will be dragging behind. As it whips around the periapsis point, the rotation is still slower so the Tidal bulge will appear to move forward. The net effect will be to ratchet the Tidal Bulge forward (eastward) a small amount. There would be a similar drift westward at the far end of the orbit for the same reason, but the effect will be much smaller (since the bulge will be smaller at apoapsis). This will also smear the Tidal Bulge along the EW direction.
|
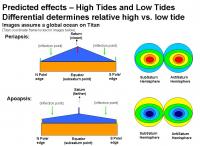
Combining these effects we get a theoretical picture of the global ocean height at periapsis (closest to Saturn) and apoapsis (farthest from Saturn). The sub-Saturn and anti-Saturn point will have the largest effect (9 m!). The poles and hemisphere edges will have a much smaller effect (<9 m) and there will be zone of inflection with no differential is shown in green.
This model is assuming a global ocean. On Titan, it appears that there were multiple shallow sea basins that were flooded during the last major inundation. That means that any relaxation of tidal volume from a bulge at one end of a sea would need to be taken up at the other end of the sea. For example, the Anti-Saturn point is at the W end of Shangri-La basin; as Titans orbit swings farther from Saturn, the liquid under the tidal bulge would be somewhat redistributed to the farther parts of the Shangri-La basin (and would also try to redistribute to other connected basins, such as Ching-Tu and Belet).
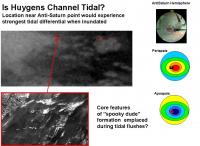
From the logic above, the best places to look for tidal channels would be nearest the sub-Saturn and anti-Saturn points in the narrow constrictions between basins or archipeligos.
|
|
|
In the Anti-Saturn hemisphere, the dark areas between Dilmun and Adiri (the channel between Shangri-La and Belet) should be a really good place to look for tidal channels (sliced carrot feature?). Another place would be the passages connecting Shangri-La and Ching Tu, as well as Ching-Tu and Belet. (Is the Huygens channel a former tidal channel? Its location fits nicely with predicted tidal differentials!) .
In the Sub-Saturn hemisphere, narrow channels between Aztlan and Aaru, narrow channels between Aztlan and Fensal (extreme E Quivra) and Senkyo/Fensal and Aaru/Senkyo would be interesting to check out. The areas between Senkyo and Belet may be also of some interest. The possible Tidal channel in W Belet is located in an area that may not have the largest possible tidal differential. (But heck, the potential Earth analog, Deception Pass, gets an impressive flush from only a 1.5 m tide height differential.)
The poles should have almost zero tides, especially if they are/were disconnected from any bodies of liquid involved in the SubSaturn or AntiSaturn Tidal Bulges.
Other effects that may influence tidal flushes include both sea bottom topography and tidal resonances.
-Mike
Posted by: ngunn Jun 5 2007, 10:32 AM
Are you sure about this? I would expect these to be points of maximal rise and fall, but minimal horizontal flow (and that due to libration only). The great circle where Saturn is on the horizon would also be a place of high rise and fall but little horizontal displacement. I would expect the zones of maximal horizontal flow to form small circles midway between in both hemispheres, say 30 - 60 degrees from the sub and anti Saturn points.
Posted by: ngunn Jun 5 2007, 11:12 AM
I've given some thought to that. For the moment I accept that the local topography could have been modified by tidal action at some time(s) in the distant past. However I don't think it can be responsible for the (more recent/more frequent?) emplacement of the giant gravel banks. Those are, I think, just too big, and they look much more like the products of individual catastrophic events than the result of regular tidal washing.
Posted by: Juramike Jun 5 2007, 04:34 PM
Your are totally correct. Further digging into the articles states that maximal horizontal displacement will be in an area near 45 degrees of the SubSaturn and AntiSaturn points. (Due to libration they would have a time-averaged slight oval shape, however.)
But also remember that we are looking at constricted channels. So a large vertical displacement (inside 45 degree zone) on one side of the channel will translate to a height differential across the channel if the flow is sufficiently restricted on one side. (e.g. an open bay on one side, but a narrow channel on the other).
Here is a corrected map of maximal horizontal tidal flush (overlaid in the Equatorial Dune seas area)
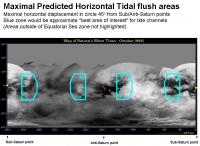
|
(Happily, the W Belet Channel at 290 W is only slightly outside this zone (on the "bad" side, however))
But remember, only a differential of 1.5 M carved out Deception Pass.
-Mike
Posted by: Juramike Jun 5 2007, 05:52 PM
Those gravel banks are really, really big. (Almost as big as the summit of the island at the Huygens landing site.) I'm invoking their initial placement during an even earlier and even bigger inundation (at least to the 120 m level in the terrain model.)
I was speculating that the gravel banks were dumped during a massively huge ancient indundation (an inundation before the last indundation, or inundation N-1). That put the material there initially, then tidal action, (again during the N-1 inundation) reworked the gravels and scoured out the potholes.
I'll further speculate that the last (most recent) inundation's tidal action would not have been sufficient to gouge out the huge initial potholes, they must have been pre-existing. But it may have been enough to carve lower lying channels and fill in/carve out some of the lower parts of accessible potholes.
(30 m level in the topography models = bright-dark boundary = putative max most recent inundation level )
Anything accessible to liquid during the last inundation would have been fair game for carving during a tidal flush. Anything above 30 m in the terrain model, or anything surrounded by a 30 m high wall should have been cut off and insulated from carving during the most recent big inundation.
I wonder if it is possible to tell from morphology the difference between bottom features carved during a catastrophic event or from back-and-forth tidal flushes.
(Tilt table with sand and a garden hose on a hot summer evening?)
-Mike
Posted by: ngunn Jun 5 2007, 06:07 PM
Well, one striking characteristic of the 'hooded dude' gravel banks is their unidirectional appearance. Another is evidence from the Huygens surface view that the pebbles look remarkably fresh and clean, not at all as if they'd been lying about under a dirty atmosphere for geological time spans. That's why I go for a recent weather/cryovolcanic-induced deluge (which could also have erased any dunes at this location?). Of course the whole channel that this flood poured through could have been formed much earlier, possibly in part by tides.
Posted by: Juramike Jun 5 2007, 07:46 PM
That's a really good point on the clean-looking cobbles. Maybe the last rain event cleaned them off?
(I'm not totally convinced that tholins are plooping out of the atmosphere all over the place - at least we know that the tholin deposition rate rate less than 1 mm/ h at the Huygens site)
The flow in the Soderblom article has the Huygens channel major flow going from SW to NE. But the "hooded dude" formation seems tapered as if the flow was going from NE to SW. At least the pointy part is on the NE side.
(Then you also have the small channels cross-cutting the bars going from W to E - that's probably from "normal" flooding rain events.)
I'd love to find a marine chart with bottom features resembling the "hooded dude" formation. At least it might give us a clue which way the current could go to make analogous formations.
-Mike
Posted by: ngunn Jun 5 2007, 08:12 PM
I'm not sure they have to be 'bottom' features. The pebbles could be bouyant flotsam. In that way the terminal gravel bank at the end of a flood wash could actually be higher than the depth of liquid transporting it. Maybe images of rubbish washed inland by tsunamis would be somewhere to look for analogues.
Posted by: Juramike Jun 5 2007, 09:10 PM
Hmm. That's interesting. I have been assuming that the pebbles were made of primarily ice.
The density of methane should be around 0.6 g/mL and that of ice-sand (or pebbles) should be around 1 g/mL.
BUT there is the chance that the ice cobbles are nanoporous ice (density = ?) or that maybe the cobbles were coated in low density stuff that dissolved away? But to bring the average less than the hydrocarbon liquid (d = 0.6 g/mL) it would have to be really low density stuff.
In a really turbulent white-methane flow, air (nitrogen) would get incorporated in the frothy mess, that would drive the density of the liquid lower and make it even less supportive of denser materials.
One possibilitie to make the gravel stuff behave like it floated would be glacial (methane/ethane glacier?) - ice rocks get transported along top of the glacial flow, then dumped moraine-like at the terminus and along the base after melting/sublimation. This would result in an unsorted deposit. (But maybe the deposits we see in the surface images have been later reworked - Huygens did not land on the very top of the big gravel bank).
Another possibility would be a lahar or landslide on an air cushion, (followed by reworking at the Huygens site). But you'd need a really big mountain somewhere close.
(I'm partial to the glacial idea, the m.p of methane is about 90 K at Earth pressure)
-Mike
Posted by: Juramike Jun 5 2007, 10:07 PM
Following the calculations in the Sagan, Dermott, and Lorenz papers, I repeated their calculations for the putative W Belet channel to see if tidal resonance could furnish exteme tides (like in Bay of Fundy)
From the Sagan, Dermot and Lorenz papers, the formula for a tidal resonance is:
Tg = 2L/[N(gD)^0.5]
where N is the mode number (well use 1), g is the surface gravity (g = 1.34 ms-2), D is the depth of the basin, and L is the length of the basin along the direction of wave propogation. Resonance arises when one of the periods of the normal modes equals the tidal period, or in the case of Titan, the orbital period of the satellite, T (T = 5.4E6 s).
For the channel in W Belet/E Senkyo, the basin to the NW (from the ISS image) has a EW length of 500 km. (Happily, the E Senkyo side to the SW is about the same size.)
Assuming a depth of 1-200 m from the above posts estimation we then get:
(gD)^0.5 = 1.2 16.3 ms-1 [similar values as the articles above indicated]
Applying this to the W Belet basin:
Resonant period is 1E6 m/1.2 ms-1 = 8.3E5 s. Which is still shorter than the orbital period of 5.4E6 s. (Bummer).
However, if we consider a larger basin with a large EW fetch, such as Shangri-La (2000 km EW basin size), we get a resonant period of:
4E6 m/1.2 ms-1 = 3.3E6. Which is approx half of the orbital period (so its close, but no cigar (Bummer)).
For there to be tidal resonance, the seas would need to be much larger, but still shallow.
However, just like on Earth, local tide effects on Titan could be strongly controlled by bottom topography, currents and complicated gyres in the sea basins. These would need to be invoked for above average tidal currents, since resonance effects do not seem a likely player. (Happily, I have absolutely no idea how to predict or calculate these).
-Mike
P.S. Assuming a bottom slope of 0.1% due to downwarp, the maximum tide range of a 9 m tide bulge differential would give an intertidal distance of 10 km. So really impressive beaches are possible in large tidal basins where the tidal height range is largest, near the Anti-Saturn or Sub-Saturn points (W Shangri-La basin or E Aztlan) Then E Fensal (where we have altimetry data) area should have been a large intertidal zone and will be interesting to examine by ISS and upcoming RADAR passes. (Sadly, the Fens of E Fensal are probably covered by dune sands now no more Titan oyster beds!)
Posted by: Juramike Jun 5 2007, 10:18 PM
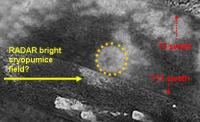
Does anyone have an idea what the heck these are? (clipped from ISS, RADAR and ISS/RADAR combos)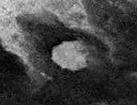
|
They have RADAR/ISS bright centers (rough, high domes?) with a RADAR-dark ISS dark halo (low, smooth moat?). They sometimes appear squished in the direction of putative tectonic extension. (I'm calling them "center-bright circular features"). I'm seeing them everywhere in the Equatorial Sand Sea basins...
Speculation, anyone?
-Mike
Posted by: ngunn Jun 6 2007, 10:07 AM
The density of methane should be around 0.6 g/mL and that of ice-sand (or pebbles) should be around 1 g/mL.
BUT there is the chance that the ice cobbles are nanoporous ice (density = ?) or that maybe the cobbles were coated in low density stuff that dissolved away? But to bring the average less than the hydrocarbon liquid (d = 0.6 g/mL) it would have to be really low density stuff.
-Mike
On possible low density pebbles:
Recall that terrestrial silicate rocks are about 2.5 times denser than water, yet pumice pebbles can float right across terrestrial oceans. I'm not saying all the surface ices on Titan are similarly aerated and impermeable in this way, only that a fraction of them may be. But it is precisely that fraction that would be carried furthest in a flood and which you'd expect to find uppermost in the resulting debris pile. Gases escape more easily from liquids than from solids so it would not surprise me if the mean liquid density of even a frothy Titan outwash flood were still greater than at least some of the solid material being transported.
Posted by: ngunn Jun 6 2007, 12:02 PM
A further thought - two plausible eruption products from Titan cryovolcanism are large volumes of condensable methane and aerated 'pyroclastic' (or should we say cryoclastic) bombs and ice-ash. Thus one could envisage such an event providing both the gravel-bank material seen by Huygens and, via a rain-bearing eruption cloud, the exceptional supply of liquid needed to transport it to Curien Station.
Posted by: ngunn Jun 6 2007, 02:47 PM
Speculation, anyone?
-Mike
Diapirs?
Posted by: Juramike Jun 6 2007, 05:36 PM
Cryopumice is a very interesting concept. Those types of ice rocks would also be more prone to erosion and rounding. (As the walls between vesicles should break easier).
I wonder what a cryopumice field would look like by RADAR?
Would the Titan equivalent of a cinder cone look like a bright zone? How high would it get thrown?
What would it look like from above? Would the pumice field be a cone shaped feature pointing downwind, or would the eruption be low enough that the flat parabola trajectory would make a circle shaped feature?
-Mike
Posted by: volcanopele Jun 6 2007, 06:35 PM
You mean, like Omacatl Macula
ISS sees a parabola-shaped dark deposit. RADAR sees a small, smooth deposit centered around a 6-km wide caldera-like feature. I've always attributed the smooth deposit to indicate a low-dielectric constant material with small particle sizes compared to the wavelength of the radar. Basically an ashfall deposit with relatively few large pumice.
Posted by: Juramike Jun 6 2007, 09:16 PM
ISS sees a parabola-shaped dark deposit. RADAR sees a small, smooth deposit centered around a 6-km wide caldera-like feature. I've always attributed the smooth deposit to indicate a low-dielectric constant material with small particle sizes compared to the wavelength of the radar. Basically an ashfall deposit with relatively few large pumice.(Image of Omacatl Macula http://www.unmannedspaceflight.com/index.php?s=&showtopic=2745&view=findpost&p=54391)
I guess that would be one flavor of an ashfall eruption.
I was wondering if there might be another flavor of eruption with larger chunks of pumice that wouldn't fly as far or distrubute downwind. I would think something like that might appear bright to RADAR, but may or may not appear bright to ISS/VIMS. (I'm speculating that ISS brightness is dependant on altitude above or below the last inundation high-sea mark.)
-Mike
Posted by: volcanopele Jun 6 2007, 09:47 PM
I think such a feature might have been seen in northern Fensal, surrounding a possible Ganesa-like pancake dome with a flow to the north.
Posted by: Juramike Jun 6 2007, 09:49 PM
Cool-o! Was that by RADAR or VIMS?
Got coordinates?
-Mike
Posted by: volcanopele Jun 6 2007, 10:20 PM
You know, ISS does take images of Titan too... 
The feature, which I really should get a name submitted for, is located at 12.3 N, 43.8 West. RADAR saw rough, IR-dark terrain just to the south of the feature on T17.
Posted by: Juramike Jun 6 2007, 10:46 PM
Got it. Bingo!
Actually, I was thinking that the parent feature (just to the N and out of view of the T17 RADAR swath) may actually be a tiny version of a multi-ring crater (mini-Minrva, rim diameter = ca 120 km). There appears to be a dark halo surrounding this feature as well (approx halo diameter 475 km x 300 km, squished in the direction 20 degrees to N).
(I suspect that three [two for sure, maybe a third] of the Minrva-type multi-ring craters are wedged in the space between the T17 and T3 swath. All three were just barely missed by the two paths (Bummer!), although some of the associated bright patch for the 12.3 N, 43.8 W are visible in T17 swath. )
So maybe another possibility for the bright center dark halo circle features are cryopumice fields, along with diapirs and their kin, or anamolous dome craters like seen on Callisto.
Any ideas for why there is a dark halo/depression surrounding some of these features?
-Mike
Posted by: Juramike Jun 6 2007, 10:57 PM
Here is an image of the feature (multi-ring Minrva style crater?) at 12.3 N, 43.8 W. :
|
Yellow arrow indicates the putative pumice field discussed in the above posts. Outline of "outer bright rim" of crater in dashed orange.
(I also indicated the location of the T3 and T17 swaths in the image just to show how close they were to snagging this feature. Double-bummer!)
Image modified from Exploitcorporations Fensal-Aztlan mosaic.
-Mike
Posted by: volcanopele Jun 6 2007, 11:21 PM
Yeah, I just don't see how that is similar to Menrva (or Sinlap, which it is close in size to). To me, it would appear that the feature outlined in the yellow ring of dots is a Ganesa-like pancake dome. It doesn't appear to be a depression, like Sinlap, given that dark material has not covered what would be the crater floor, but some intermediate albedo material has been deposited on it. That material is not nearly as dark as the material that has partially filled in Sinlap and Menrva. Several flow like features can be seen spreading out from the eastern margin, the most prominent of these makes a left turn and flows to the north of the volcanic dome.
Posted by: Juramike Jun 6 2007, 11:59 PM
I was taking the analogy of it looking like it had a multi-ring appearance (like Minrva). It looks kinda like a squished blurry sand dollar.
Maybe a better term would be "multi-ring circular feature". That leaves open the possibility that it is impact, cryovolcanic, or impact/cryovolcanic, (and diapir).
There is another similar looking thing at 5 N, 343 W (in Aaru). Actually, I think there are a couple of these multi-ring things in the Fensal-Aaru area. I'm working on a huge post of speculative "circle features".
-Mike
Posted by: volcanopele Jun 7 2007, 12:11 AM
Now that feature in Aaru reminds me of Menrva, with a central bright spot, surrounded by a ring of dark material, surrounded by a ring of bright material. I just don't see a multi-ring structure at that feature at that feature northern Fensal.
Posted by: Juramike Jun 7 2007, 12:36 AM
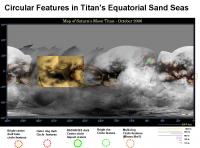
I've put together a list and maps of speculative (perhaps even imaginative) "circular features" in Titan's Equatorial Dune Seas. Some of these appear to have been squished in a particular direction (indicated by the black arrow in the second slide of each set).
Here are the circular features I've imagined in Fensal-Quivra-Aztlan-Aaru region:
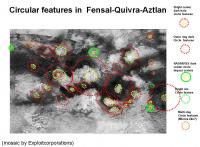
|
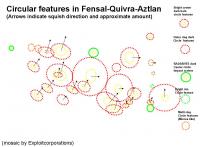
|
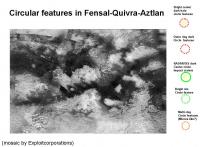
|
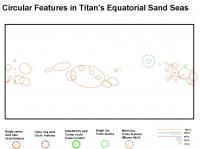
And here are the circular features I've imagined in Shagri-La/E Belet region:

|

|

|
Here is a global map of Titan with the imagined circle features in the Equatorial Dune Seas indicated:
|
|
I've put all this data in an attached EXCEL file. These show the named area, the inner diameter (for bright center features this is the diameter of the bright center, or dark centers this is the diameter of the dark center), and the outer diameter (for dark halo features this is the outer limit of the dark zone, for impact craters this is the diameter of the bright ejecta zone). Both the long axis and short axis are entered. (If the craters are not squished, they are the same). If the craters appear squished, I've noted the vector of the compression from North = 0. I've classified them into five morphology types:
bright center dark halo circle features (bright center by ISS or RADAR)
outer dark halo only (no bright center)
multi ring circle features (maybe like Minrva, or maybe not)
dark center bright rim (actually apron) impact craters
bright rim craters (eroded impact craters?)
I've also calculated the ratio of inner/outer rim diameters (using the longest axis), as well as the "squish factor" by dividing inner(long) diameter/inner(short) diameter as well as outer(long)/outer(short) diameters)
The EXCEL file is available here:
 Equatorial_Sand_Sea_Crater_Morphology_20070606.xls ( 31.5K )
: 320
Equatorial_Sand_Sea_Crater_Morphology_20070606.xls ( 31.5K )
: 320Happy sorting and data analysis!
Enjoy!
-Mike
Posted by: volcanopele Jun 7 2007, 12:56 AM
The problem is that most of those are oblong features, not circular features and I think it is doubtful those are actually impact features.
Posted by: Juramike Jun 7 2007, 01:07 AM
Yup. I think you're right. Most the features may have an entirely different (non-impact) type of origin
I find it interesting how the apparent compression seems to be parallel for many of the "features" (similar generation?)
I also find it interesting how the compression in the Shangri-La basin seems to be perpindicular to the long parallel ridges. Did a later tectonic extension squish originally circular features into oblong shapes?
If it is not impact, it's probably cryovolcanic (or cooler diapir). Do you have any idea of a cryovolcanic process that could cause a depression to make the outer dark halo?
(Thermal plume?)
-Mike
(P.S. There is one feature that I'll bet is an actual impact feature: -22 S, 340 W in W Senkyo. In my imagination it has a dark center, but a broad bright circular apron in ISS. ).
Posted by: ngunn Jun 7 2007, 09:40 AM
Where do you find the time, Mike???? Anyhow thanks for that spreadsheet- the one download was me.
Posted by: Juramike Jun 7 2007, 06:50 PM
Science never sleeps.
-Mike
(Actually, at 90 F and 90% humidity, spending weekends gardening in the hot sun seems less attractive than thinking about a frozen world without ticks, mosquitoes, or browsing deer...)
Posted by: Juramike Jun 14 2007, 02:49 PM
Approximately 60% (30 out of 50) of the circular/oval features in the EXCEL table from post 85 (above) can be described as bright center dark halo circular features.
Here are a few examples by ISS, RADAR and RADAR/ISS imaging:
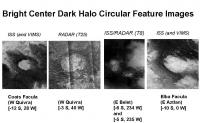
|
From the supposed deposition sequence and topology above, the ISS brightness is assumed to be terrain that was above the high methane mark during the last big inundation (after bright stuff was deposited). The RADAR brightness is assumed to be due to rough terrain.
So:
ISS bright, RADAR bright center = rough terrain left high and dry during last inundation.
ISS dark, RADAR dark = smooth low lying terrain where bright stuff was dissolved/modified/washed away during the last inundation. (Either low lying dune sands (VIMS dark brown) or ice sands (VIMS dark blue)).
Most likely, the bright center dark halo circular features have a rough central plateau or dome surrounded by a smooth depression.
Taking Coats Facula as an example, here are images showing hypothetical makeup that could explain the observed morphology:
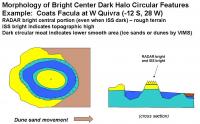
|
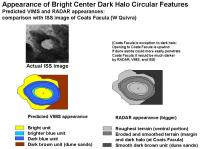
|
(Coats Faculas opening is downwind, thus dune sands were not able to penetrate into the dark halo. VIMS imaging of Coats Facula shows that the halo consists of dark blue ice sands. Other halo depressions where dune sands can easily penetrate should appear dark brown by VIMS).
The proposed deposition sequence is the same as in post 21 (in this thread), except instead of the word crater substitute the awkward phrase bright center dark halo circular feature.
-Mike
Posted by: Juramike Jun 14 2007, 07:23 PM
Here is a short list of possible suspects for the bright center dark halo circular features:
(Listed in order of drama: high energy impact is high drama (and would be way rad to watch happen!), a slow cold diapir slowly working its way to the suface is low drama (and not real exciting to watch).
External: Impact origin followed by modification (impact then maybe cryovolcanism or slow crustal rebound?):
1) Modified impact crater (up-lifted dome)
2) Modified palimpsest/type II palimpsest/penepalimpsest
3) Modified central dome crater
Internal: Cryovolcanic origin
4) Collapsed pancake dome
5) Thermal plume
6) Ice pluton
7) Diapir
The difficult thing to explain is the formation of a topographically depressed halo around the central dome or plateau.
Any ideas?
-Mike
Posted by: ngunn Jun 15 2007, 09:28 AM
I have to say that I feel uncomfortably out on a speculative limb here. In particular I think your assumption that elevation and liquid levels are the only determinants of the light/dark patterns is unsafe. However, going along with it for now I don't find it too hard to imagine the outer skin of an ice diapir being richer in volatile materials, making it more prone to deflation by outgassing and/or erosion. One could envisage a dark depression appearing first, acquiring a bright centre later as more of it emerges.
Posted by: Juramike Jun 15 2007, 06:24 PM
I'm totally cool with your concerns.
All of these speculations are built up on the original speculations of a bright/dark level being pretty much set by "the last inundation sea level". (= "house of cards"?) (There may be some effect of dark brown dune sands drifting in from the W as well).
It is also built up on the speculation that most of the sand sea basins (exception: Mezzoramia) are interconnected and have a "last inundation sea level" at the same gravitational level of the geoid. (The semi-permanent tidal bulge will make a difference in absolute elevation).
A key observation that supports this hypothesis is that at the Huygens site (granted, only one local observation), the bright dark boundary appeared to be very close to the "seashore" of the islands.
Hopefully this hypothesis would be easily testable from an altimetry track across one or several Sand Sea Basins. If the above hypothesis is correct, we should observe the bright/dark boundary at the same (tidal bulge effects taken into account) absolute elevation across all the basins.
Alternate hypotheses for setting the light/dark boundary include:
* local "bright stuff" snow line: (if bright stuff is solid material)
* local methane rain virga limit (assuming bright stuff has been scrubbed clean by methane percolation)
* local "fog elevation" (assuming methane fog helped dissolve out bright material)
(If y'all got any others?)
Like any other supposition, if data comes in that torpedoes these assumptions, it'll be time to modify the hypothetical sequence.
But so far, everything seems kinda consistent....
So far....
-Mike
Posted by: Juramike Jun 15 2007, 11:18 PM
From the circular features EXCEL table http://www.unmannedspaceflight.com/index.php?s=&showtopic=4177&view=findpost&p=91758, I attempted to plot the morphometry of the Titan circle features using a plot similar to that found in Jones et al. Icarus, 164 (2003) 197-212 Morphology and origin of palimpsests on Ganymede based on Galileo observations. (Pay article: Abstract http://www.sciencedirect.com/science?_ob=ArticleURL&_udi=B6WGF-48SP654-4&_user=10&_coverDate=07%2F31%2F2003&_rdoc=1&_fmt=&_orig=search&_sort=d&view=c&_acct=C000050221&_version=1&_urlVersion=0&_userid=10&md5=c5b43ee31c32dc39122f826c98d474c1) . The data in the referenced paper can be found in Table 2 and the plot is in Figure 12 (p. 209 in the reference).
Taking the data for the circular features on Titan in the EXCEL table, I plotted the outer diameter (long axis) as the x component and the inner diameter (long axis) as the y component in a logarithmic graph. I also included (red circles) the unity line for [outer diameter (x), outer diameter (y)]. Only circle features that have two measured diameters (outer and inner) will lie off the unity line.
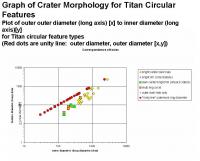
|
Yellow diamonds are bright center dark halo circle features [dark halo diameter (x), bright center (y)].
Purple dots are bright rim only circle features [bright rim diameter (x), bright rim diameter (y)). These are buried on the unity line.
Green squares are dark center bright apron impact craters [pedestal deposit = apron [x], crater rim [y]]
Orange squares are multi-ring impact basins [outermost rim diameter (x), innermost rim diameter (y)]. If the inner rim could not be measured, the point will be buried on the unity line as [outer (x), outer (y)].
Deep purple crosses are dark halo circle features [outermost rim diameter (x), outermost rim diameter (y)] and the points are buried on the unity line.
It is interesting to note that the putative impact craters (green squares) and the bright center dark halo circle features (orange squares) all pretty much lie on the same line (at least as far as a log plot goes).
This shows that the ratio of crater rim diameter/pedestal deposit diameter for putative impact craters on Titan is similar to the ratio of the bright center diameter to dark halo diameter when plotted on a log scale.
Where multi-ring craters had two rings measured, these points also fit in the same log-scale relationship.
The Jones et al. article defined the correspondence of morphological units between craters, palimpsests, and penepalimpsests on Ganymede and Europa.
So: (palimpsests, craters)
Outer deposits = continuous ejecta
Concentric massif facies = pedestal deposit
Unoriented massif facies = crater rim
Central plains = central pit
Here are pictures of a crater (Melkart), a palimpsest (Buto Facula), and a penepalimsest (dome crater) (Nieth) showing the defining units. (All are on Ganymede).
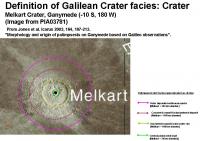
|
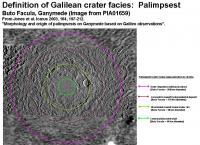
|
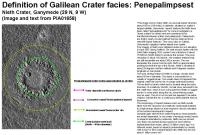
|
In the paper, several impact craters, ring structures and palimpsests on Europa and Ganymede were plotted in the same type of graph. (Palimpsests and ring structures used in the text: Callanish, Tyre, Buto Facula, Zakar, Memphis Facula, Epigeus; Craters: Achelous, Sebek, Isis, Melkart, Osiris, and Enkidu).
Adapting the derived lines from the Jones et al paper onto the graph of circle features of Titan we get this plot:
(By definition in the paper, the crater rim or unoriented massif facies is the unity line, so it should be no surprise that it lines up with the Titan circle feature unity line (red dots) as well.)
It is interesting that the central plains/central pit to unoriented massif facies/crater rim points line up almost with the yellow diamond, green squares and orange squares in the Titan plot.
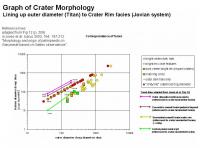
|
Adapting the derived lines from the Jones et al paper onto the graph of circle features of Titan, but this time shifting the reference diameter to concentric massif facies/pedestal deposit we get this plot.
(So by the new definition, the pedestal deposit/concentric massif facies is the unity line, so it should be no surprise that it lines up with th eTitan circle feature unity line (red dots) as well.)
Again, it is interesting that the central plains/central pit to unoriented massif facies/crater rim points line up almost with the yellow diamond, green squares and orange squares in the Titan plot.
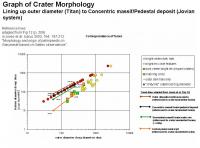
|
Neither plot proves that the circle features of Titan have an impact origin. But they do show that the ratio of corresponding morphological facies with those of craters, palimpsests, and ring structures of the Jovian moons (well, at least Ganymede and Europa) are similar, at least at the level of a log plot.
A better plot would show Saturn system inner dome craters and their relationship to Titan circle features
-Mike
Posted by: Juramike Jun 20 2007, 01:57 AM
I plotted the outer/inner diameter measurements of the selected large craters on Tethys, Rhea, and Iapetus on the same plot as the circular features of Titan. The selected craters are: Odysseus on Tethys, Tirawa on Rhea, and the crater located at 5N, 38W on Iapetus. The topoglogy of Odysseus and Tirawa was described in Moore et al. Icarus 171 (2004) 421-443. "Large impact features on middle-sized icy satellites". Below are the topological profiles of Odysseus and Tirawa and a plot of Titan circle features with selected craters from some of Saturns other moons.
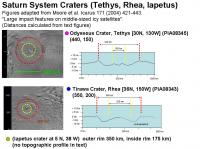
|
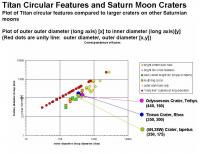
|
Here are the measurements and plots of Titan circle features with 4 selected larger craters from Ganymede and Callisto (measured values are from the text). (Two central dome craters, an anomalous central dome crater, and Gilgamesh which may also be a central dome type crater):
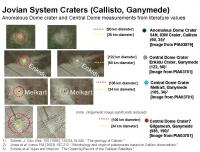
|
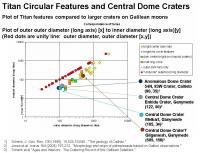
|
According to the text in Schenk et al Ages and Interiors: The Cratering Record of the Galilean Satellites (Available in html-only http://%5burl=http://66.102.1.104/scholar?hl=en&lr=&q=cache:JiLkrv35ocQJ:dosxx.colorado.edu/JUPITER/PDFS/Ch18.pdf+Ganymede+author:p-schenk+Ages+and+Interiors
]here[/url]): These domes have rounded profiles up to 1.5 km high but at high resolution are characterized by web-like networks of narrow fractures. (They also invoke that Gilgamesh and Lofn may qualify as central dome craters). Also, Like cental pits (craters), the dome/crater size ratio increases with increasing crater diameter.
In contrast, the ratio between dome and rim diameter for [anamolous dome craters] (whether observed or estimated from ejecta deposit scaling) is roughly constant at 0.4, regardless of crater size. (I hope I got the correct diameter for the rim of the 54N, 43W Crater on Callisto: I measured 90 km, but the text stated 180 km for the rim)
Below are the measurements for a (putative) cryovolcano on Titan, Ganesa Macula. The ratio of outer diameter to central radar bright zone is about 0.11 for the 200 km pancake dome (n = 1, so who knows if this is typical.) In contrast, a 200 km bright center dark halo feature usually has a 60 km bright center, for outer/inner diameter of 0.3. Below are the images and plots.
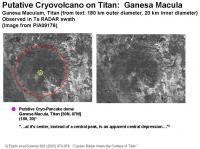
|
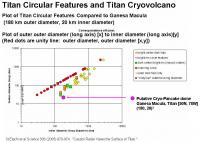
|
Below are the measurements from topographical analysis of dome-like bulges in chaotic terrain on Europa. These bulges are thought to be diapirs. Below are the images and comparision a plot of Titan circle features.
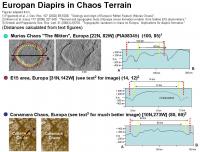
|
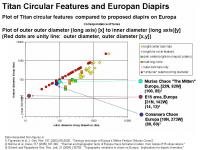
|
As described in Shenk, Journal of Geophysical Research 100 (E9) (1995) 19,023-19,040. The geology of Callisto: Bright domes fill most central pits in craters larger than 60 km (in Galilean moons), and have morphologies consistent with an intrusive origin. Dome formation could have occurred after crater formation as diapiric intrusions of soft ice, or during crater formation and collapse by the uplift of deep material, as occurs in central peak craters on Earth and the Moon. Im curious to know if a web-like network of narrow fractures would create a chaotic terrain that would then appear RADAR-bright by SAR.
At least for the Galilean satellites, Fracture domes on these [Galilean] domes resemble those formed in a thin chilled crust over plastic material deforming under gravity (e.g., pancake domes on Venus). This suggests that uplifted dome material deformed plastically during or after emplacement, as would be expected for warm material rapidly uplifted several kilometers and left to cool to space. Dome profiles can be used to model the rheology of the uplifted material during emplacement.
From all the graphs and plots, it seems that a cryovolcanic pancake dome, like Ganesa Macula, seems to be the worst fit with the data (but remember, n = 1).
The best fit seems to be for an impact origin, at least for most of the smaller craters (<900 km). As stated above, diapiric rise of material after impact might explain the observed morphology of the bright center, dark halo circle features.
A pure diapiric origin may fit for some of the largest circle features (those >900 km). Unfortunately, I couldnt find any really big examples (>1000 km) of diapirs so I cant compare morphology with Titans bright center dark halo circle features.
Smaller craters: impact
Bigger circle features: impacts and diapiric doming
Biggest circle features impacts and diapiric doming OR just plain old diapirs.
-Mike
Posted by: ngunn Jun 20 2007, 09:42 PM
Juramike I salute your work, but sadly I doubt if there is an 'amateur' here now who can enter a critical discourse on your evidence and findings at the level they deserve. I excuse our resident professionals because of course they conduct most of their discourse in their own arena. I'd just like to register a few points, easily made armchair comments compared with what you are doing.
Philosopy
My preference at the moment is to hedge my bets as far as global models for Titan are concerned. Many of my ideas about the place are mutually contradictory (you've probably noticed!) but I'm happy with that and prefer to keep it that way until we have done more plain and simple looking. I'm not comfortable in a 'house of cards', even one that seems to be holding up well at the moment. I'm on the lookout for surprises - the sort of thing that brings card houses down. I don't want to miss one because I've formed a view too early.
next bit in following post
Posted by: ngunn Jun 20 2007, 10:02 PM
Ganymede et.al.
Undoubtedly we can look to the Galileans and other moons of Saturn for guides to Titan's likely bulk composition. Also, large impacts might be expected to produce comparable surface features. However I think it's worth reviewing the actual and potential differences. In the first place neither the ISS albedo patterns nor the topography revealed by radar on Titan remotely resemble any other body. Secondly it is reasonable to expect that the the geology of Titan will reflect the fact that volatiles brought to the surface are not immediately vented into space. On Earth the recycling of water lubricates plate tectonics. We have no idea what analogous processes may operate on Titan. Thus we don't know even if ancient circles would remain circular - or even remain at all. More data required!
Mars
There are craters on Mars with narrow rims and others with wide aureoles, plus a huge variety of other circular forms. The role of volatiles seems to be important there. Have you tried out your ideas on Martian circular features?
Posted by: Juramike Jun 21 2007, 03:15 PM
My preference at the moment is to hedge my bets as far as global models for Titan are concerned. Many of my ideas about the place are mutually contradictory (you've probably noticed!) but I'm happy with that and prefer to keep it that way until we have done more plain and simple looking. I'm not comfortable in a 'house of cards', even one that seems to be holding up well at the moment. I'm on the lookout for surprises - the sort of thing that brings card houses down. I don't want to miss one because I've formed a view too early.
I can respect your caution. My philosophy is to try to build a model that tries to fit and explain the current observations and is hopefully predictive of future observations.
My personal scientific philosopy that even a bad model is better than no model. (If it's proven wrong, at least we can say "Well, it's not that!")
Building a model will hopefully tell us where to look to support/disprove the model.
Always bearing in mind the important rules of science:
"You can never prove a theory." (You can provide evidence that supports a theory, but you can never prove it.)
"Absence of evidence is not evidence of absence."
"You can't zoom a zoomer." (Zoom, schwarz, profigliano, beterman rules http://en.wikipedia.org/wiki/Zoom_schwarz_profigliano)
I'm hoping that an initial model will also help to develop experiments in the lab as well as plan what future observations might be helpful.
And scientific models are built to be modified, mangled, ripped up, parted out, and reassembled, and if need be, totally thrown out the window. [The standard scientific bet in our lab is a quarter: some days I'm lucky and the quarter is on my desk, other days when my hypotheses don't do so well, it goes to a someone with a better predictive model]
And please continue to be on the lookout for suprises, those are the key observations that will help build the next (always better) model...
-Mike
Posted by: dvandorn Jun 21 2007, 03:36 PM
OMG! I haven't played that particular drinking game in 30 yers! (I believe, at the time I learned it, that 'Beterman' hadn't codified it yet -- it was simply known to me as "Zoom-Schwartz-Profigliano-Zoom.") I learned that game in my junior year of college (otherwise known as the Great Sodden Semester...
)I totally agree in terms of developing models, even on insufficient data, Mike. It is often the process of building a model that shows you what's not consistent with your base assumptions, and sends you out looking for data to confirm or deny certain of those base assumptions. It is perhaps possible to learn more by simply going out and collecting every scrap of data that you possibly can, but we all know that data-collection schemes (and the sensors used to collect the data) are so specialized these days that you have to triage -- you have to decide in advance what kind of data you're going to collect in any given scheme (read: any given mission).
For that task, you need a model and you need a set of base assumptions that you want to test. Without that, you can end up either getting tantalizing hints of things you just didn't have the tools to investigate or, worse, you miss something extraordinary that you could have seen if you had flown the proper types of sensors.
-the other Doug
Posted by: Juramike Jun 21 2007, 04:04 PM
Undoubtedly we can look to the Galileans and other moons of Saturn for guides to Titan's likely bulk composition. Also, large impacts might be expected to produce comparable surface features. However I think it's worth reviewing the actual and potential differences. In the first place neither the ISS albedo patterns nor the topography revealed by radar on Titan remotely resemble any other body. Secondly it is reasonable to expect that the the geology of Titan will reflect the fact that volatiles brought to the surface are not immediately vented into space.
The geology of most the Saturnian moons should be very, very similar. Geologically, they are all brothers and brought up in the same house (Saturn orbit). The big differences with Titan compared to the other Saturn moons are with regard to impactors are:
it has weather and floods (erosion will erase many of the features)
it's bigger: tectonic activity? cryovolanic activity? (might erase many of the features)
it's bigger (compositional makeup, depth of lithosphere)
it has an atmosphere (small impactors burn up, a big impactor should not be affected, but venting might be suppressed [very good point, ngunn])
it has organics on the surface (but this might not be enough to make a difference)
it's bigger: faster impactor speed???
The first two factors could help explain why there are so few obvious impact craters (they get wiped), and may explain their different form compared to other moons.
IIRC (but I can't remember the source), the impact features of Saturnian moons (other than Titan) seem to resemble the impact features of terrestrial planets more than those of Galilean satellites. The Galilean satellites seem to be sorta "oddball" (compositional differences of target material? lithosphere differences? impactor differences?).
So we would predict that without erosion, Titan craters should look like other Saturn moon craters/terrestrial craters with a possible trend to Galilean craters. (The trend being due viscous relaxation of icy surfaces on larger bodies).
On Earth the recycling of water lubricates plate tectonics. We have no idea what analogous processes may operate on Titan. Thus we don't know even if ancient circles would remain circular - or even remain at all. More data required!
I don't think ancient circles remain circular at all....(I think some of this data might already exist)...
-Mike
Posted by: Juramike Jun 21 2007, 06:29 PM
Attached please find a plot of circle features' (outer diameter, feature inner diameter) for the entries in the EXCEL spreadsheet from the post above along with their proposed speculative identification:

|
I have tentatively identified these features as (in order of drama):
- "normal" impact craters (green squares)
- "multi-ring basin" impact craters (orange squares)
- central dome impact craters modified by diapirism" (yellow diamonds)
- diapirs (blue squares)
Some of the larger "bright center dark halo" features have been split out as speculative diapirs (identified as blue squares in the plot). These features have a inner/outer diameter ratio >=0.75. (There seemed to be a break at this point.)
I have also included the point for the Minrva outer dark halo, outer bright ring (purple square).
Minrva seems to be a pretty cool feature. It appears midway between a multiring basin and a central dome crater with a dark outer halo.
For all these identifications please insert the words "speculative", "tentative", "hypothetical", "putative" (my favorite) and any other appropriate scientific weasel words that will allow me to save face when this is all proven wrong by further observation and analysis.
-Mike
Posted by: Juramike Jun 21 2007, 06:33 PM
The Big Diapirs of Titan....

|
Posted by: ngunn Jun 21 2007, 09:12 PM
Thanks for taking the trouble to reply to my points. You didn't mention Mars though so I thought I'd clarify what I was suggesting. The idea was to provide a sort of test for the process of analysing inner and outer diameters as a diagnostic tool. Pretend you don't know what the features are, plot them as you have for the Titan features and see how they look. What would you deduce from the plots alone? Could you define categories? Then look at how that fits with what is really known about the nature of the Martian features. It might well vindicate your method.
Posted by: alan Jun 22 2007, 04:43 AM
-Mike
How about I stir things up a bit
http://www.lpi.usra.edu/meetings/lpsc2007/pdf/2402.pdf
Earlier abstract:
http://adsabs.harvard.edu/abs/2004AGUFM.P53A1447P
Posted by: Juramike Jun 22 2007, 02:36 PM
http://www.lpi.usra.edu/meetings/lpsc2007/pdf/2402.pdf
Earlier abstract:
http://adsabs.harvard.edu/abs/2004AGUFM.P53A1447P
"TITAN: The red-headed step-child of Saturn?"
I'll stand stand corrected and modify my earlier comparison...
"Geologically, they are all brothers (or close cousins?) and brought up in (or adopted into) the same house (Saturn orbit). (Oh yeah, and Titan's brothers might've beat on and messed Titan up a bit.)"
-Mike
Posted by: Juramike Jun 22 2007, 07:14 PM
Does anyone have any good papers that describe MOLA topographical sketches of Martian craters?
Hokay....
So the plan will be to pull up craterform data on Mars and put them on a similar plot as done for Titan.
On a good day, "wierd" Martian craterforms will seperate out from the "normal" Martian craterforms.
To be fair, I would plot corresponding characteristics for Martian craters (crater rim diameter, inner dome diameter) as for the Titanian bright center dark halo objects (outer dark halo diameter, inner bright center diameter).
So only Martian complex craters with a domelike bulge in the center will be plotted. I have found MOLA data for several north polar craterforms on Mars: Garvin et al Icarus 144 (2000) 329-352: Freely available http://geodynamics.gsfc.nasa.gov/personal_pages/sakimoto/icarus_craters6298a.pdf.
(I'll use the MOLA trace to guesstimate inner and outer diameters. I'm assuming the inner dome corresponds to Titan bright center and crater rim is the equivalent of the outer dark halo diameter.)
That will be a start...but my knowledge of Mars crater literature is limited.
So I'm activating the UMSF Mars Brain Trust (and I'm sure there are many flipping between Titan and Mars forums), if y'all know of any good papers (or craters!) that have MOLA traces described for complex craters that are between 10 km and 4000 km in width. (As always, bigger is better.)
Anybody gots any good papers?
-Mike
Posted by: Juramike Jun 23 2007, 03:01 AM
I entered all craterforms in the USGS topographical plot of Mars that are greater than ca. 70 km in diameter and that show both an inner and outer diameter. (For a fair comparison for the Titan plot, I wanted to select "circle features" that could flood and form a ring lake). There were about 45 features on Mars that fit this criteria that I identified.
The Mars topographical plot I used is here: http://pubs.usgs.gov/imap/i2782/i2782_sh1.pdf
Another handy reference was this Mt. Holyoke thesis from Jared Howenstine with a list of Mars crater diameters (and depths) available http://www.mtholyoke.edu/courses/mdyar/theses/Jared%20Howenstine%20thesis.pdf
(Go Jared!)
Here is the plot of the Martian circular features, done in the same way the plot was done for Titan in the earlier posts http://www.unmannedspaceflight.com/index.php?s=&showtopic=4177&view=findpost&p=93065:

|

|
It is interesting to see that three crater forms split out nicely in this plot. (It's also interesting central peak craters are not observed larger than 200 km, this is evidently the transition point to multi-ring basins.)
[Three of the craters entered were also described in the Garvin et al article as "Feature B, D, and E (Korolev Crater)" in the text.]
[I also entered an 1100 km multi-ring basin centered at -20S, 30W; I'm not sure if this was already described in the literature, but I included it in the spreadsheet as an eroded multi-ring basin.]
For comparison, here is a plot of the Titan circular features alongside the plot of Mars circular features:

|
And attached please find a spreadsheet for Martian craters (the plot is also in the sheet):
Mars_Crater_Morphology_Comparison_20070622.xls ( 49.5K )
: 311Enjoy!
-Mike
Posted by: ngunn Jun 23 2007, 07:30 PM
Fast work, Mike, and nice results too. But you left out the Martian volcanoes! They are after all 'circular features' and plenty big enough. Since you don't know that all the Titan features are impact-related why exclude non-impact-related Martian features? I think you would get another [/i]very[i] distinct (and un-Titan like) group on your plot - which would be interesting in itself.
Posted by: The Messenger Jun 24 2007, 10:19 PM
This is very interesting. Early in the mission, Cassini scientists (Larry Soderblum(?)) questioned whether or not Titan features were impact craters because they seemed to have depth-to-radial ratios similar to those of Venus. If the distribution of crater sizes is similar to Mars, what is this telling us about the crater forming history? Were there fewer impacts in the same ratio of sizes over the same time scale at this greater distance from the sun? Have the ratios remained constant? Is resurfacing of Titan biasing the sample in a manner that masks the true distribution? Is Cassini just as pock-marked as Mars, but the blemishes are buried in the deep sand?
Posted by: ermar Jun 24 2007, 11:24 PM
I hope it hasn't been through the rings that many times yet...
Posted by: Juramike Jun 25 2007, 02:10 PM
Thanks! Actually, it was too fast. I muffed something up. (One of those things that you realize as you are just waking up on Saturday morning and think "Aw, cr....".) I 'll put a revised post out today.
I left out the Martian volcanoes because they do not have a central peak or dome. (I also left out Martian simple craters for the same reason).
I will make a plot showing the measurement between the volcano rim, and the cone. This will correspond to the ratio between the crater rim and the outer apron. (And yes, this is also the goof I made in the plot with the Titan and Martian craters.)
"There's never time to do it right, but there's always time to do it over."
-Mike
Posted by: Juramike Jun 25 2007, 06:02 PM
Attached please find a revised plot of Titan craterform features.
(The revision is that I've now added seperate points for central peak-->rim measurements for impact craters Ksa and Sinlap - these are the aqua-colored squares):

|
I've also attached a revised plot of Mars craterform features. Likewise this includes the central peak-->rim measurements for central peak impact craters on Mars where the apron was easily discerned (aqua-colored squares) and the rim-->apron measurements for central peak craters (green-colored squares).
In addition, I threw in points for rim-->apron measurements for Martian volcanoes (purple circles). Note how the volcanoes in the plot also seperate out with ratios of inner/outer diameter of ca. 0.1-0.4 (gee, kinda like Ganesa Macula with a inner/outer ratio = 0.11).

|

|
For comparison, here is a corrected plot of the Titan circular features alongside the plot of Mars circular features:

|
Here is the corrected EXCEL spreadsheet of Mars circular features (New! Improved! Now with volcanoes!):
Mars_Crater_Morphology_Comparison_20070625_REVISED_with_volcanoes.xls ( 47K )
: 314Enjoy!
-Mike
Posted by: Juramike Jun 25 2007, 07:41 PM
Those are really good questions. Some of the tentative ID's are pointing to some really big impacts: 5 tentative dome craters > 700 km in diameter indicates some major whoopin' going on out there. (Or the tentative ID's could be wrong: these numbers are outside the "norm".)
Hmmm, there might be a way to see if the ratios remained constant....
I'm guessing that the blemishes are actually more visible in the Equatorial Sand sea area. There may be some additional resurfacing going on in the polar and temperate regions that is obscuring obvious crater shapes.
So while the craters are being hidden and being buried by dune sands in the Equatorial Sand Seas, they are being obliterated and eroded even more by other processes further away from the equator. Possible candidate reasons include:
* more methane rain eroding features quickly,
* more rain bringing atmospheric shizzle coating down to the surface
* equatorial sand sea floods wash/modify surface gunk into something that can percolate down or make a thinner coating
* Something in the terrain features of the temperate/pole regions make craterforms harder to detect. (If the material is naturally higher in altitude and radar rougher, it will be difficult to see a bright center-dark halo feature - if they are indeed craters).
-Mike
Posted by: Juramike Jun 28 2007, 02:18 PM
Taking the data from the circular features EXCEL table http://www.unmannedspaceflight.com/index.php?s=&showtopic=4177&view=findpost&p=91758, I plotted the global coverage of circular features in the Equatorial Sand Sea basins as can be seen in the first three images below. Some of the circular features appear squished (compressed) while others do not. One of the two possible squish vectors (I picked the one closest to N) is shown in the third image. The blue arrow roughly approximates the squish ratio (1-[short axis/long axis of outer diameter]) (These are also in the EXCEL spreadsheet).

|

|

|
I plotted the circular features squish ratio and squish vector in a graph. (For clarity, those circular features that are not squished are given an arbitrary vector of 180; thus, those circle features not squished at all are all buried under the spot 180,0). The points are colored up by basin: Shangri-La (red squares), Belet (blue circles) and the Fensal-Quivra-Aztlan-Aaru-Senkyo (FQAAS) mega-basin (green diamonds).

|

|
There seem to be natural clusters in the plot. Assuming that more deformed and squished circle features are older, I broke these out into three generations for each basin: Generation III (oldest, most deformed), Generation II (sorta deformed), and Generation I (not deformed at all). Generation I circular features are assumed to be the youngest since they have not yet been modified by squishing.
{This is not too weird. On Earth, the originally circular Sudbury impact crater in southern Ontario has been squished and overfolded to give the oval shape see today. Check out Morris, W.A. Geophys. Res. Lett. 29 (2002). The Sudbury Structure: A circular impact crater? Abstract available http://adsabs.harvard.edu/abs/2002GeoRL..29t..63M.}
As an example, in the plot above circle features in the FQAAS mega-basin that are squished in a NNE direction with a squish ratio from 0.05 - 0.55 are placed in the Generation III (FQAAS) group. Those that are squished somewhat less with a squish ratio from 0.05 0.25 and squished in the E direction are assigned to the Generation II (FQAAS) group. Those not squished at all (plotted at 180, 0 in the graph) are considered Generation I and are assumed the youngest. (It is also assumed that when two features of the same generation are in close proximity, the one with the lower squish ratio is assumed to be younger.)
(Notice how the tectonic ridges in southern Shangri-La match up with the squish vector, and how the graben long axes in northern Tseghi also matches up with the squish vector.)
If we use the same plot but then light up the points by the circle feature type, we notice that the presumed diapirs are only found in Generation III (older), while putative recent impact craters (Ksa and Sinlap) are placed in Generation I.

|

|
So it appears that pure diapirs (not impact related, so with a thinner dark outer halo) occurred long ago, before the Generation III squish events. So far, we have not identified any recent (unmodified) circular diapirs at least in the Equatorial Sand Sea area..
-Mike
Posted by: Juramike Jun 28 2007, 08:40 PM
The image below shows the Fensal-Quivra-Aztlan section of the FQAAS mega-basin. Circular features are indicted on the mosaic:

|

|
In the FQAAS mega-basin, there seemed to be a general large squish to the NNE (or it could have been to the SSW) of existing Generation III circle features in the region. Then, there was a slight squish to the E (or W) of the Generation II circle features. In contrast, the relatively fresh Generation I features are perfectly circular. The sequence of events (Generation III --> Generation II --> Generation I) is shown in the next three slides for the Fensal-Quivra-Aztlan section (for clarity, only the circle features of that Generation are shown):

|

|

|
Proposed time sequence in the Fensal-Quivra-Aztlan region
1) Generation III Diapirs and Central dome features emplaced (+ multi ring basin)
2) Compressional squish to the NE (tectonic plates? Crustal extension?)
3) Generation II Central dome and Multi-ring basins emplaced
4) Slight compressional squish to the E (tectonic plates? Crustal extension?)
5) Generation I circular features emplaced (impact craters, central dome features, and multiring basins)
-Mike
Posted by: volcanopele Jun 28 2007, 08:45 PM
I'm not sure I understand why these apparently squished circular features are related. I mean there are some obvious circular features like Nath and Guabonito, but many of these just seem to have only partially curved margins that and the brain has filled in the rest of the oval.
Posted by: Juramike Jun 29 2007, 04:29 PM
I think a pretty safe statement is that "a plethora of craters on Titan's surface is not screamingly obvious."
My working hypothesis is that craters on Titan, like craters on Earth, have been heavily modified/eroded/mangled (scattered, smothered, covered, and chunk'd) and identifying them is not going to be obvious. (Examples like Sinlap and Ksa aside)
{How difficult even here on Earth? The >200 km Vredefort Impact structure in the center of the Witwatersand Basin, South Africa which produced 50% of the worlds gold over the last 100 years (so youd figure itd be pretty heavily studied), was really only nailed down as an impact structure in 1993. The evidence that resolved the issues was transmission electron microscopy of quartz grains from the crater. And the detection and identification of the 180 km Chicxulub impact crater (the one that gave us mammals our chance onstage 65 MYA) was only put to rest in 1993, although the exact diameter is still in question.)}
So I dont think determining craters on Titan is going to be straightforward.
I tentatively identified circular features that seemed to fit a pre-existing pattern in my mind; Ill be the first to admit I mentally filled in loops, partial walls, etc, all in an attempt to identify what might possibly be associated circular features. Its all about my imaginations pattern recognition algorithm: I mightve blown it big-time on some, but I actually mightve gotten lucky on others. (And I mightve totally overlooked still others).
The evidence I have for calling the circular features associated features on the surface rests on three weak arguments:
1) They seem to cluster into patterns of similar inner/outer diameter ratio (all them scatterplots above). (Course, this could be observational bias on my part: you only see what you want to see).
2) They seem to cluster into similar squish vectors (this is harder to dismiss whod a thunk theyd all be oriented with the short axis to the NE?)
3) For those that are in RADAR swaths, the brightness temperature Tb of the centers seems significantly cooler than the surrounding dark halo. (Reference: Paganelli, Icarus (2007) doi: 10.1016/j.icarus.2007.04.032 Titans surface from Cassini RADAR SAR and high resolution radiometry data of the first five flybys.) [Im under the impression that it is double-plus uncool to reproduce a figure from a published article here correct me if Im wrong.] (the scatterometry data is really hard to dismiss the data is indicating compositional differences and may have predictive value in finding previously unobserved circular features and I didnt use this in the initial identification of the circular featues, so its a possible cross-check).
So what further evidence could support these assignments? Uhhh, dunno. (Can anyone think of something?)
Here are a few possibilities:
* Higher resolution VIMS data could show the dark blue ice sands around some of the predicted craters in relatively dune-free areas.
* Some support could occur if this model helps predict locations/characteristics of as yet unobserved circular features immediately outside the zones. (For example, very close to the Sand Sea Basins the squish vectors should be similar, this model predicts that there may be dark halo bright center features that would be squished in the NE direction near Shangri-La and the FQAAS mega-basin. Future RADAR observations may help find these features. (My speculation is that craters are more obscured outside the Equatorial Sand Seas. So I would predict less squished craters can be easily identified in the Temperate/Polar zones. But I'm betting that there are circular features to be found in Belet, E Senkyo, NE Shangri-La, and around Menrva (them dark blue ice sand speckles in VIMS around Menrva are intriguing!). I've got a short list of "RADAR swaths I'd like to see."
So what further evidence/observations would discredit these assignments?
* Finding a way to make the dark halos completely disassociated from the bright centers.
* Finding that the bright centers are unexplainably different from each other (that could not be explained by subsurface geology) example : altimetry data that shows some bright centers are really high peaks, but some bright centers are really deep depressions.
* Finding huge compositional differences (VIMS) between dark halos that do not fit the above model of dune sands blowing in or that could not be explained by local winds (paisley or plaid patterns would be tough to explain away).
* Finding evidence for cryolava oozing from a dark halo would also not fit the above model. (Remember how Ganesa Maculas morphology didnt match these features?)
* Finding RADAR brighter terrain in the outer ISS dark halo compared to the center would also not fit the current model.
My basis arguments rest on:
1) there are circular features with associated parts (bright center + dark halo) on Titan's surface.
2) most of these circular features seem to be consistent with an impact origin.
For the right now, the data seems self-consistent and may even be predictive. (Check). Im totally willing to jump to another model if someone can propose an alternate hypothesis that fits the observations better. [Is the standard lab bet still a quarter?]
-Mike
Posted by: volcanopele Jun 29 2007, 05:58 PM
I get the bright center, dark halo part, but what I don't see is their circular nature, modified or otherwise. I think you have identified some interesting features, but to categorize them as "circular" is a bit misleading, and suggests that some thing is making the circular, either mangled impact craters or volcanism. I just done see anything circular about these features. Concentric maybe a much better term to describe some of these features you are identifying. Not circular...
Posted by: Juramike Jun 29 2007, 06:44 PM
Cool.
I'll call them concentric.
Many of the concentric features seem to appear squished, or compressed, in one direction. So they appear elliptical, although they may not be complete. In my mind, I was extrapolating back to a complete, uncompressed version which I was referring to as "circular".
To be absolutely correct, even the most "complete" biggest concentric feature, the one centered around Elba Facula, could only be described as a semi-circle ('bout 60% complete even on a good day). The next most complete, centered at Coats Facula is only about 50% complete. So quite a bit of imagination (= wishful thinking?) is being used to fill in the gaps of the surrounding rim of the dark halo.
Had they been stretched apart, they would have a different aspect. Like two hyperbolas with longer lines connecting them (and I'm not sure what this shape would be called). (And they would've been much, much harder to draw in Powerpoint.)
-Mike
Posted by: Juramike Jun 29 2007, 08:30 PM
Zooming out a bit, I made a cheap-o mosaic of the Fensal-Quivra-Aztlan-Aaru-Senkyo mega-basin. (Quivra is not a basin, but FQAAS mega-basin sounds cool). I've also indicated the concentric features identified in the EXCEL spreadsheet. This zoomed area now includes Menrva and a few of the features identified in western Senkyo. This area has the most circular features identified (and also is centered on the leading edge of Titan. Coincedanza? Could be...)

|

|
I've then plotted the total concentric features, then those assigned to Generation III, Generation II, and finally Generation I (presumably the most recent since these features have the least deformation).

|

|

|

|
Next (after struggling to learn how to use the FREQUENCY function in EXCEL), I plotted histograms of the outer (longest) diameters of the these features. This is for the total features in FQAAS, then Generation III, Generation II, and finally Generation I.

|

|

|

|
From the admittedly limited sample, it does seem that larger features (excluding diapirs) were more common or at least survived better in Generation III and Generation II (rough distribution around 512 km). (The limited sample of Generation II makes it real difficult to draw conclusions - at least it is not radically different from Generation III or Generation I histograms). Smaller features are more visible in Generation I (rough distibution approximately centered around 256 km).
What is very strange is that smaller features <128 km are pretty rare. Cratering follows an exponential progression. There are oodles more small craters than there are larger craters.
So the histograms suggest some possibilites:
1) These ain't craters.
-or-
2) Smaller craters are wiped from the surface by some process.
-or-
3) Small impactors never hit Titan (other Saturn moon's say likewise)
-or-
4) Resolution of features (ISS resolution, RADAR coverage) hasn't found the smaller ones yet.
-Mike
Posted by: The Messenger Jun 30 2007, 04:40 AM
Good work, Mike.
Remember, the crater population of Titan should be size limited, since small meteors and such will often be destroyed in the atmosphere.
Posted by: Juramike Jul 2 2007, 05:54 PM
Ive made a putative sequence of events for formation of the Coats Facula feature (-12S, 28W) below. This builds on the previous posts in this thread (http://www.unmannedspaceflight.com/index.php?s=&showtopic=4177&view=findpost&p=90121, and http://www.unmannedspaceflight.com/index.php?s=&showtopic=4177&view=findpost&p=92441) and adds a post-impact diapirism/breaching of water/ammonia to the surface of Titan similar to the process on Europa as described in Turtle et al (Turtle and Ivanov, LPS XXXIII (2002) Abstract 1431. "Numerical simulations of impact crater excavation and collapse on Europa: Implications for ice thickness." Abstract freely available http://www.lpi.usra.edu/meetings/lpsc2002/pdf/1431.pdf). The sequence below also includes a faulting and compression similar to that described for the Sudbury impact structure on Earth.

|

|

|

|

|

|

|

|
So the sequence is:
1) Impact
2) Transient Crater excavation (+rim expansion + viscous relaxation)
3) Diapirism/Breach/Extrusion of water/ammonia into central dome
4) Faulting
5) Compression
6) Erosion
7) Bright stuff Deposition (further details see this thread, post 20 http://www.unmannedspaceflight.com/index.php?s=&showtopic=4177&view=findpost&p=90121)
8) Dune sands
Key observed features resulting from this sequence, as well as a comparison to the ISS image of Coats Facula, are shown below:

|

|
This sequence nicely explains the squished appearance, as well as the linear edges of the bright central part of Coats Facula. It also predicts that the central dome will appear RADAR bright and uniform (like the featue in the T25 swath) and that a further section of the wall at the SE corner just might be revealed by RADAR penetration. The linear sections of the bright central part of Coats Facula, as well as the thin bright wall surrounding the dark outer halo shouldl all have similar angles to the the faults and joints of the Shiwanni Virgae graben.
Examples of other concentric features that are predicted to have followed a similar sequence as Coats Facula are centered at these locations:
[-20S,7W] ca. 700 km outer dimension (SW of Elba Facula, Aztlan)
[5N,45W] ca. 400 km outer dimension (Fensal)
[-10, 45W] ca 400 km outer dimension (Aztlan)
-Mike
Posted by: Juramike Jul 3 2007, 07:03 PM
Ive made a similar diagram for a putative sequence of events for formation of the Sliced Carrot feature (putative concentric feature centered at +3N, 209W) below. This is even more speculative but follows a slightly altered sequence from the post above.

|

|

|

|

|

|

|

|
So the sequence is:
1) Faulting
2) Compression
3) Diapirism/Breach/Extrusion of water/ammonia into central dome
4) Impact
5) Transient Crater excavation (+rim expansion + viscous relaxation)
6) Erosion
7) Bright stuff Deposition (further details see post 20 here)
8) Dune sands
I've also put together a diagram showing key features, as well as a comparison of the diagram to the ISS image (cobbled together from images from CICLOPS site and edstrick):

|

|
The first thing that in the sequence is the set up of tectonic faults and compression, then followed by impact. During the set up of the tectonic fault system, there may have been several periods of uplift and erosion (either before or after impact). Additionally, there may have been a gentle uplift of fault blocks at some period following the impact. After impact (and uplift?) the erosion progresses along the fault and joint lines. This may have been accelerated during catastrophic episodic floods or during tidal flushes such as described in post 36, this thread (http://www.unmannedspaceflight.com/index.php?s=&showtopic=4177&view=findpost&p=90526) for the feature located in W Belet at (-5S, 290W). [Ive unofficially named this The Straits of Charybdis, but this probably wont make it officially since Charybdis is not a happy, happy, joy, joy diety].
During flood stages or when the Equatorial Sand Seas were filled with solvent, the features of the Sliced Carrot feature would have resembled sea stacks.
During deposition of the dune sands, episodic floods may have carved deeper channels in between the sea stacks. There is the remote possibility that the lowest substrate (blue ice sands) may be exposed at the very bottoms of the narrow channels between the sea stacks.
The zoomed in cross section in the top right of the Bright Stuff Depostion slide shows channels between the sea stacks. This may also be a fairly valid sequence (except for the impact?) and cross section diagram for the underlying geology of the Huygens Landing Site. (The breach the formed Huygens channel may have been from erosion along a joint or fault perpendicular to the main tectonic ridges/fault pattern).
{Way speculative, but there may have been a previous impact immediately to the E of the Huygens Landing Site. This putative ancient impact is just to the W of the eroded crater seen in the T8 swath. (and may explain the bonus uplift of the W wall of the E of Huygens Impact Crater. The Huygens landing site may have been just to the W (<40 km?) of the older crater rim/uplift area)}
The overall sequence explains the appearance of the sliced carrot feature, as well as predicts VIMS observations (hopefully, real, real soon?) in this region.
Other concentric features that are predicted to have followed a similar sequence are eroded Generation I (but old enough to have been eroded) crater rims such as seen at (none of these seem to have a central dome, perhaps not a big enough impactor?)
(in order of newest (relatively most intact) oldest (crater wall most breached and eroded)):
[-10S,165W] (Shikoku crater visible in T8 swath) ca. 40 km outer dimension (Shangri-La)
[-10S,151W] (Guabonito) ca. 60 km outer dimension (E Shangri-La, visible in T13 swath)
[-10, 190W] (Anitilia Faculae crater, eroded crater to E of Huygens Landing site visible in T8 swath) (Shangri-La)
-Mike
Posted by: Juramike Jul 3 2007, 10:31 PM
Random question time:
How kosher is it to post an image clipped from Google Earth?
Is it OK as long as I reference "clipped from Google Earth" in the post text?
Or if I include the "copyright Google Earth" portion of the image?
Is it OK to include/modify pictures that were on the internet that were hotlinked to Google Earth, as long as I mention the source?
(I'm trying all I can to avoid a visit from the UMSF Goon Squad at 2 AM...)
-Mike
Posted by: The Messenger Jul 4 2007, 05:20 AM
Google is one of the few places this should be kosher. It certainly is with NASA images, and there is a NASA - Google collaboration...
Posted by: Juramike Jul 5 2007, 02:32 PM
Thanks, Messenger!
After your message (!), I dug and found the Google Earth legal page. They seem very cool about stuff like that.
(For handy reference: http://earth.google.com/support/bin/answer.py?answer=21422&topic=1141)
-Mike
Posted by: djellison Jul 5 2007, 02:35 PM
It's technically illegal to copy and reproduce any imagery from Google Earth or Google Maps without retaining the copyright message - as Google's paid for the imagery. The majority of it is not NASA imagery and is infact, nothing to do with NASA.
Doug
Posted by: Juramike Jul 5 2007, 02:53 PM
Earth analog of the Sliced Carrot feature (in appearance only, this is NOT necessarily an impact feature):

|
It shows the weathering that followed the joints and fractures to make blocky little islands poking out of the lake (sea). There are many other examples in the same area.
This image is of a section of the 30,000 islands area of Georgian Bay, Ontario (which is about 120 km to the SSE of Sudbury crater epicenter, so it may be sorta kinda associated with the Sudbury structure as rocks of the Grenville orogeny intruded and squished the crater from the SE)
(Google Earth image (and copyright symbols included)).
-Mike
Posted by: Juramike Jul 5 2007, 06:40 PM
Comparision with Sliced Carrot feature (zoom and reorientation of image above):

|

|
(image on left from PIA08968; image on right from Google Earth)
-Mike
Posted by: Juramike Jul 5 2007, 07:17 PM
To try to estimate the projected cratering rate on Titan, I used three sources:
1) Lunine et al. LPS XXXVI (2005) Abstract 1504. Numerical modeling of impact cratering on Titan with implications for the age of Titans surface. Available freely http://www.lpi.usra.edu/meetings/lpsc2005/pdf/1504.pdf.
2) Zhanle et al. Icarus 163 (2003) 263-269. Cratering rates in the outer Solar System. Gotta pay for the article, but abstract available [url=: http://www.sciencedirect.com/science?_ob=ArticleURL&_udi=B6WGF-48GVSC7-2&_user=10&_coverDate=06%2F30%2F2003&_rdoc=1&_fmt=&_orig=search&_sort=d&view=c&_acct=C000050221&_version=1&_urlVersion=0&_userid=10&md5=2667cd080d0ad975bc68e6d439c27d74.
3) http://www.psi.edu/projects/mgs/template2004c.jpg (these are rates for Mars from William Hartmanns webpage: http://www.psi.edu/projects/mgs/chron04a.html)
An EXCEL spreadsheet that uses the estimated (and extrapolated) cratering rates from all these sources and projects them for the total Titan surface, as well as any given area (entered in km2, in column D), can be downloaded here:
Literature_Projected_Cratering_Rates_for_Titan_20070705.xls ( 32K )
: 715
For the total surface area of Titans surface, I used the value 8E+7 km2.
For the total area of the Equatorial Sand Seas, I used the value 1.09E+7 km2 (approx. 14% of Titans surface)
For the total area of the FQAAS mega-basin, I used the value 6.6E+6 km2 (approx 8% of Titan Surface). [This also includes the area N of Xanadu where Menrva sits]
A projected histogram of frequency of crater diameters in the FQAAS mega-basin is shown below for a 4.5 Gyr (Lunine, Zhanle) and a 4 Gyr (webpage) surface. The plot to the right shows the observed distribution of concentric features in FQAAS (based on identified features from above) compared to the projected frequency.

|

|
A second histogram shows the projected histogram of crater diameters for the entire Titan surface. The plot to its right shows the observed distribution for crater diameters for the Equatorial Sand Seas.

|

|
From the plots, it can be seen that there are far too few craters smaller than 128 km. (Titans present atmosphere should scrub out any impactors that would make craters less than 20 km assuming normal impactor/diameter relationships Lunine et al. abstract )
On the large end, there are waaay too many large diameter craters that would be expected even for a 4.5 Gyr surface. (Weird. Its almost as if the projected histograms have all been shifted to the right. As if the inbound impactors blew away much, much more material than wouldve been expected).
Hmmm. Maybe
1. These aint craters.
or-
2. The cratering rate for Titan is abnormally high: Titan got pummeled big-time with larger impactors compared to other moons in Saturn orbit.
-or-
3. Some impact craters are exaggerated by surface process to make the ultimate feature diameters much, much larger (bonus drama?).
Counter arguments to these:
(1. What the heck else are they? Its reasonable to expect impacts on the surface of Titan, and they seem to fit the gross morphology for other cratered surfaces. Im not comfortable proposing totally new geological processes that havent been observed on similar bodies.)
(2. Could Titan have been a separate planet as the reference in post above suggests and suffered big impacts (w/big shrapnel hitting later) on getting incorporated into Saturn orbit?)
(3. Could an extraordinary amount of viscous relaxation enlarge a crater? To fit the project histogram for impacts, it would require a 8-10x diameter enlargement for a 4.5 Gyr surface. Or could the properties of Titans surface make it behave different than previously observed icy bodies (fr instance: methane-saturated nanoporous ice?))
Any ideas or opinions?
-Mike
Posted by: volcanopele Jul 5 2007, 07:45 PM
Well, I think it is largely issue #1. I seriously doubt most of these features you have identified are impact craters/basins, WAY too non-circular. Sure, you can get shear deformation on impact crater, but I can't think of a single LARGE impact basin that is as non-circular as some of the features you point out. I think most of these are either illusions (seeing arcuate shapes and your brain filling in the rest of the "circle") or they are created through other processes. For example, the sliced carrot could be explained by a combination of thrust faulting and aeolian erosion.
It is nice that you are identifying all these neat features, but I think this is a long way from saying all of these are impact features. Some are intriguing and warrant further investigation.
Posted by: Phil Stooke Jul 6 2007, 02:56 AM
I also doubt the exitence of most of these features. Our eyes and minds play tricks on us when it comes to finding shapes and patterns. A good test would be to have several people all map circular features on the same image, and see how many are common to all interpretations. I would not count most of these. Sorry!
Phil
Posted by: Juramike Jul 6 2007, 01:53 PM
I think we can agree that some of these may be features of interest. (Being an overly aggressive detective, think Fontana in Law and Order, Im referring to these as suspect craters.)
Are most of these features real or just my own illusions?
Beyond the reasons in post http://www.unmannedspaceflight.com/index.php?s=&showtopic=4177&view=findpost&p=93844 above, here are my main arguments for why I suspect most of these are real:
1) The surprise revelation that most of the features are aligned along the same vectors tends to support that they may be real features on the surface.
If this was a pure illusion, I would expect the squish vectors to be randomly distributed.
2) The observation that the squish vector seems to lie perpendicular to the local tectonic ridges also fits.
Again, if this was a pure illusion, there should be no relationship to local tectonic ridges.
Given an original circular feature, we would expect that a large-scale regionally uniform tectonic compression could generate an oval shape. Sudbury crater on Earth is one confirmed example of tectonic compression, at 200 km estimated original crater size. (Sudbury crater was not subjected to an evenly distributed tectonic compression so it got squished up goofy.)
The constraint with my proposed model is that it requires large-scale regionally uniform tectonic compressions in order to make the resulting oval shape of the features uniformly squished and not misshapen.
Are at least some of semi-circular features real and of impact origin?
It seems so. Two putative examples so far: the feature centered at Elba Facula and Menrva.
The semi-circular feature centered at Elba Facula is described in the PIA09034 caption (link http://photojournal.jpl.nasa.gov/catalog/PIA09034) as: The large circular feature near the center of Titan's disk may be the remnant of a very old impact basin. I identified this feature in the EXCEL spreadsheet as being a bright center dark halo object with a 750 km outer diameter. Images below:

|
Menrva is clearly of impact origin and has a clear rim at 450 km (link http://photojournal.jpl.nasa.gov/catalog/PIA07707), and an outer dark halo identified in the EXCEL spreadsheet at 1000 km diameter. Is the outer dark halo associated with Menrva? Or was Menrva a lucky hit close to the center of a bright center dark halo feature? Not sure. Images below:

|
At least two of the bright center dark halo features (Elba Facula and Menrva) identified in the spreadsheet may be of impact origin. The inner diameter/outer diameter ratio of these fits with the other identified features, so Elba Facula and Menrva are not obvious outliers. By necessity, does this indicate that all the other identified features are of impact origin? No. But it is plausible (given the constraint above).
{Insert Mythbusters Plausible sign here.}
****
But here is the kicker: From Elba Facula and Menrva, there are at least two putative large impact features that are present on Titans surface that are larger than 400 km.
According to projected numbers for a 4.5 Gyr old surface in Saturn orbit, there should only be one crater >256 km diameter visible on the surface. Finding at least two putative impacts larger than 400 km is becoming downright spooky IMHO this provides support that the Equatorial Sand Seas basin (or at least the FQAAS mega-basin) is an old surface.
-Mike
Posted by: Phil Stooke Jul 6 2007, 02:29 PM

|
This is how I would have plotted a circle at Elba. I expect it's a circular basin on a regional slope, so dark material collects preferentially on one side of it. Possibly it is an old impact basin - yes, I would allow that as a hypothesis, but radar mapping of its rim would be necessary to add weight to the argument.
The point is, circular patterns are notoriously easy to spot once you start looking for them. I repeat, let lots of people do it and lets see how much agreement there is.
Phil
Posted by: Juramike Jul 6 2007, 03:34 PM
Phil
That is an excellent suggestion and a fun experiment for classrooms and kids! (Friday Family Fun Night = "Find features on another world").
It would probably be best for an unbiased audience as well (so I've "contaminated" everyone reading this thread) in order to see if they identify the same features and orientations.
Attached please find a Titan base map suitable for printing and scribbling (with distance scales included)!

|
Enjoy!
-Mike
Posted by: Juramike Jul 6 2007, 07:18 PM
Here are the basic assumptions for the formation scenarios Ive outlined:
1) Bright material = above flood level, dark material = below flood level
2) There are associated concentric features on Titans surface, many having a bright center and a darker halo.
3) These were all originally circular
4) The concentric features are of impact origin
How to check:
1) Does bright = high, dark = low?
RADAR Altimetry data across some Sand Sea basins. (resolution enough to be able to see the islands would be really helpful).
2) Are concentric features associated?:
The central dome is key: Most of these features should have a central dome and this would be the diagnostic feature to tie all these features together. I would expect similar characteristics for these domes across the features, but due to the proposed nature of the domes (uplift or something else from down deep) they should be significantly different from surrounding materials. These should be diagnostic and observable by:
RADAR brightness temperature
RADAR dipole measurements (??)
RADAR (gross appearance and reflectivity of central dome: uniform, mottled, possibly with straight edges oriented along tectonic lines; also might help define outer rim as mentioned by Phil Stooke)
RADAR Altimetry might detect the dome and any associated outer rims .
3). Were they orginally circular?
Observed similarities (same techniques as above) between oval and cicular features would be crucial. In addition, finding regional alignment would be provide a plausible mechanism (tectonic compression)..
Observing that the common squish vectors lie perpendicular to tectonic ridges (determined by RADAR) would provide further support for a possible mechanism.
4) Are the concentric features of impact origin? (Assuming all the features are associated, how could we prove if they are of impact origin?)
Unfortunately, the standard D/d (diameter/depth) plot for impact craters would probably not be applicable to Titan, the wind distribution of dune sands, plus any possible flood deposition of material would not allow fair comparison to other moon systems.
The best way would be to be able to morphologically tie known impact craters to bright-center dark halo features. (i.e. find the missing link between the largest of the obvious impact craters and the smallest of the suspected impact craters).
This will require identifying more obvious impact craters on the surface to define the morphological characteristics at the larger diameter end of the obvious impact craters. The best way to identify obvious impact craters seems to be by RADAR (although ISS/VIMS can give clues where to point the RADAR)
Bottom line: More RADAR (and RADAR-associated experiment) swaths across the Equatorial Sand Seas are needed to support/refute the proposed scanario!
-Mike
P.S. Anyone know the proposed RADAR swaths for the Extended Mission?
Posted by: Juramike Jul 9 2007, 01:40 PM
Plotting the morphology type vs. diameter reveals an interesting relationship among the features.
I created a plot of morphology type vs. outer diameter for the identified features listed in the EXCEL table above. In this plot, bright rim dark center impact features are given y = 1,multi-ring features identified are given y = 2, bright center-dark halo features are given y = 3; and putative diapers (bright center objects with a much thinner dark outer ring) are given y = 4. (For impact craters, I also included measurements of the apron boundary, and the rim so some of the larger diameters will be only for the apron diameter)
The plot is shown below:

|
If there is a relationship between normal impact craters and bright-center dark halo features, it appears that the transition occurs somewhere in the range of 100-500 km. Thus, impact features < 100 km are normal bright rim dark center (central peak) impact craters, while impact features > 500 km take the form of bright-center dark halo features.
In an article describing diameter/depth relationships for the icy Galilean satellites (Schenk, Nature 417 (2002) 419-421. Thickness constraints on the icy shells of the Galilean satellites from a comparison of crater shapes. Pay-for article, but abstract available http://www.ncbi.nlm.nih.gov/sites/entrez?cmd=Retrieve&db=PubMed&list_uids=12024207&dopt=Citation), there were three breaks in the slope of a diameter/depth plot for craterforms on each moon. These three transitions also correlated with a change in crater morphology.
Transition I: [Simple complex(central peak) craters]: 2-3 km (Europa, Ganymede, and Callisto)
Transition II: [Complex(central peak) cratersComplex(central dome) craters]: 8 km (Europa) and 26 km (Ganymede, Callisto)
Transition III: [Complex (central dome) cratersMultiring basins, central pit and central dome craters, anomalous dome craters and multiring basins]: 30 km (Europa) and 150 km (Ganymede, Callisto)
Going from simple to complex cratershapes happens on moon craters, Mars craters and pretty much everywhere at more or less the same diameter. This is not really applicable for Titan, because Titans atmosphere should filter out smaller impactors, so even the smallest of Titans craters should be complex (central peak). Schenk proposed that Transitions II and III reveal at least two [such] temperature induced rheologic transitions or phase changes with depth on all three icy satellites. Basically, crater shape is influenced by how deep you penetrate and the elastic properties of the layer the crater excavates.
In the article, it was also stated that the modification process and crater shape begins to be unduly influenced when an anomalously weak layer is roughly 1 to 1.3 times as deep as the transient crater width. Put another way, if you punch through to the subsurface ocean on Europa, crater shapes go weird.
On Ganymede and Callisto, Transition II craters (D = ca. 26 km) scale to transient craters about 16.5 km wide for a depth to the first anomalous layer of ca. 16-22 km. A similar analysis was used for Transition III to infer the depth of the subsurface ocean on Europa as being at 19-25 km deep under the surface. (A similar transition analysis on Ganymede and Callisto were also used to also infer that their oceans lie at least 80 km deep.)
For Titan, a change in crater morphology could be indicating a property change at transient crater depth. This could be a subsurface ocean or a coherent but very warm ductile ice in the lower ice shell.
The trick will be to determine the transient crater depth on Titan that corresponds to a 100-500 km final crater.
According to Moore et al (Moore et al. Icarus 171 (2004) 421-443. "Large impact features on middle-sized icy satellites". Paper freely available http://www.es.ucsc.edu/~lbruesch/Moore_etal04IcarusFinal.pdf), the final diameter of a crater is related to the transient diameter by this formula: D(final) = AD(simple to complex)^-0.108 x D(transient)^1.108 (where A is a constant). For Ganymede, AD(simple to complex)^-0.108 is 1.176. Assuming the values for Ganymede are applicable to Titan (I suspect this may not be perfectly translatable due to differences in materials, for example ammonia content) we get: D(transient) = [D(final) ^ (1/1.108)]/1.176.
So the range 100 500 km for final crater size on Titan translates to a transient crater size of 50 250. Thus a penetrating depth of 50 350 km If this relationship is valid, it implies that somewhere around 50 350 km there is a significant phase change in Titans crust.
This also implies that it might be very interesting to examine features in the 100-500 km range to see if any are hybrid morphologies between different morphologies.
(The feature at (5N, 343) with a 200 km outer diameter is my top pick).
-Mike
Posted by: Juramike Jul 10 2007, 02:12 PM
Image of feature at [5N, 343W] 200 km in diameter:

|
Hopefully, this will get imaged in the upcoming ISS/VIMS imaging to be done on Rev 48 (T34) on July 19. (two weeks to data!)
In the CICLOPS looking ahead link for Rev48, this feature is smack dab in the middle of the image shown for Titan: http://ciclops.org/view.php?id=3337.
-Mike
Posted by: volcanopele Jul 10 2007, 04:23 PM
See now THAT I buy!
We will not get that feature in our highest resolution data set (ISS anyway). All of our high resolution data will be in the large bright area to the east of that feature. Not sure about VIMS. Like the last orbit, we are wanting to obtain some of our highest resolution data over areas RADAR SAR got data to see if we can see some of the small scale feature they were seeing. During the last encounter, the goal was to see if can see dunes. During this orbit, our goal is to see if we can observe some of the river-like features RADAR saw during T16.
Posted by: Juramike Jul 11 2007, 09:37 PM
I recreated the plot of projected and observed* (based on the EXCEL spreadsheet of circular features in post http://www.unmannedspaceflight.com/index.php?s=&showtopic=4177&view=findpost&p=91758) cratering rates on Titan. This is the same data as in post http://www.unmannedspaceflight.com/index.php?s=&showtopic=4177&view=findpost&p=94261, except presented in a format that is similar to those in the literature (same literature references as in post http://www.unmannedspaceflight.com/index.php?s=&showtopic=4177&view=findpost&p=94261). I also included the projected cratering rate as shown in Engle et al. Planet. Space. Sci. 43 (1995) 1059-1066. Cratering on Titan and implicataions for Titans atmospheric history. (Pay-for-article: abstract http://www.sciencedirect.com/science?_ob=ArticleURL&_udi=B6V6T-3YS8MD4-23&_user=10&_coverDate=09%2F30%2F1995&_rdoc=1&_fmt=&_orig=search&_sort=d&view=c&_acct=C000050221&_version=1&_urlVersion=0&_userid=10&md5=ba2374346883aef6a42c0ab05e554efa.) For observed features, putative diapirs were excluded from the plot. Impact craters with an apron were counted twice (once in the bin corresponding to crater rim diameter, once in the bin corresponding to apron diameter).

|

|
(Note: These plots were done freehand, I couldnt figure how to have EXCEL do a log10 y-axis, with a log2 X-axis.)
Attached please find an EXCEL table which now includes the Engle cratering rates, as well as the observed data placed in bins. To calculate rates for other basins or areas, change the area values in columns C or D and drag down. (The spreadsheet also has a goofy-looking log10-log10 plot):
Cratering_Rates_for_Titan_Hartmann_projection_20070711.xls ( 34.5K )
: 619Although the absolute numbers are too low to allow a significant comparision, the cratering rates (no. craters/km) for the Shangri-La basin and for the FQAAS mega-basin do not appear wildly different. (Example: for feature diameters between 257-512 km diameter, in the FQAAS mega-basin the rate is 2.3E-6 craters/km2; in Shangri-La the rate is 1.3E-6 craters/km)
The observed* cratering rates on Titan extend beyond the projected rates for 4 Gyr surfaces.
From this (speculative) data, it appears that the surface of the Equatorial Sand Seas is very old.
Hmmm, and that double-hump pattern is interesting .
-Mike
*based on speculative identifications listed in EXCEL spreadsheet in post http://www.unmannedspaceflight.com/index.php?s=&showtopic=4177&view=findpost&p=91758
Posted by: Juramike Jul 12 2007, 07:28 PM
There are two possible explanations that jump to mind for the double-hump pattern of the speculative cratering plot of Titan's Equatorial Sand Seas area: a thicker atmosphere in Titans past, or selective erosion of older mid-size and older smaller craters.
On an airless ancient (4.0 Gyr) geologically dead world, the number of craters should increase exponentially with decreasing crater size. So while there should be only a few craters above 500 km in diameter, there should be oodles more smaller than 0.25 km. (In the case of the lunar highlands, oodles more translates to a factor of 2E+6 (two million times more)). (See plot below:)

|
In the Engle et al article [Engle et al. Planet. Space. Sci. 43 (1995) 1059-1066. Cratering on Titan and implicataions for Titans atmospheric history. (Pay-for-article: abstract http://www.sciencedirect.com/science?_ob=ArticleURL&_udi=B6V6T-3YS8MD4-23&_user=10&_coverDate=09%2F30%2F1995&_rdoc=1&_fmt=&_orig=search&_sort=d&view=c&_acct=C000050221&_version=1&_urlVersion=0&_userid=10&md5=ba2374346883aef6a42c0ab05e554efa.)], it was postulated that the thicker ancient atmosphere on Titan would filter smaller bodies by breaking them up before they impacted Titans surface. The point that the cratering rate drops is referred to as the turndown point. For the current atmosphere of 1.5 bar, the turndown point is about 46 km. For a putative past atmosphere of 100 bar, the turndown point would be about 500 km for an impactor coming in from solar orbit. (These values are from Table 2 in the Engle et al article). Combining the crater population from an ancient thick atmosphere during heavier bombardment, with that of the current atmosphere during the current level of bombardment could provide the double humped curve that we see currently. The Thick Ancient Atmosphere scenario is illustrated below (and follows Figure 2a + Figure 2c in the Engle et al article):

|
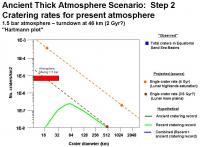
|

|
Another possibility is that the current atmosphere was maintained, but that over time a large number of ancient mid-size and smaller craters were erased through erosion (aeolian, fluvial, chemical deposition, etc.). From the Engle article:
Thus if erosion or geologic activity is efficient enough the crater retention ages will be young. In other words, the older cratering record would be destroyed (as on Earth). The net result of erosion actually detected in the cratering records of Earth and Mars is a flattening of the slope, due to shorter lifetimes, but continued production of smaller craters. The predicted cutoff sizes for the smaller craters [due to atmospheric effects] would remain the same.
One possible twist on this would be that really large features might make such a large scale modification that all traces might not be easily removed. (Big splat, big mess - hard to erase). In this scenario, the craters less than about 250-500 km are wiped over the lifetime of the Basins, but that vestiges of the bigger features (>500 km) are still evident. So only the most recent crater population is observed along with the really big ancient splats that were so widespread that it was hard to completely wipe them away. This Small Crater Erosion Scenario is illustrated below:

|

|

|

|
It is also possible that both scenarios were operating: thicker atmosphere filtering out smaller impactors + rapid erosion of any of the smaller craters that did form.
In all the scenarios described above, the distribution of smaller craters (30-250 km) that are observed are all from more recent impacts.
Conversly, all the scenarios above predict that smaller (<250 km) ancient impacts will not be observed. So squished (squished = ancient) normal impact craters (from post above craters < 200 500 km would appear normal) are not expected to be observed on Titans surface.
-Mike
Posted by: qraal Jul 13 2007, 02:06 AM
Hi All
Forgive my ignorance, but just when did Titan have a 100 bar atmosphere? And what was it made of? Are we talking about an impact-generated steam atmosphere during the LHB? But that can't be right because there'd be no icy crust back then. Where would you stash 100 bars of nitrogen at the present day?
Adam
Posted by: rlorenz Jul 13 2007, 12:31 PM
As you say, it probably had a steam-ammonia atmosphere immediately post-accretion
(bet with the methane there too that was interesting astrobiologically..) but
even after it settled down to a nitrogen-methane job it was likely >10 bars.
There is evidence in the N14/N15 ratio that many bars of nitrogen were lost
(IIRC the ratio for N14/N15
determined in HCN by groundbased millimeter wave observations a few years ago
is different from that measured in-situ by the Huygens GCMS in N2, so the loss
may not have been as large as some earlier work suggested e.g.
http://www.lpl.arizona.edu/~rlorenz/isotope.pdf
Interestingly the C12/C13 ratio shows that methane was not correspondingly
fractionated, suggesting the present inventory was delivered to the surface-
atmosphere system (perhaps still ongoing) after the fractionation event, perhaps
T-tauri winds from the early sun..
Forgive my ignorance, but just when did Titan have a 100 bar atmosphere? And what was it made of? Are we talking about an impact-generated steam atmosphere during the LHB? But that can't be right because there'd be no icy crust back then. Where would you stash 100 bars of nitrogen at the present day?
Adam
Posted by: rlorenz Jul 13 2007, 12:36 PM
From this (speculative) data, it appears that the surface of the Equatorial Sand Seas is very old.
The less speculative radar interpretation so far is a global average age of 500 Myr or so,
but (not least having a spouse who did impact craters for her PhD) I have not been generous
in what I call a crater
http://www.lpl.arizona.edu/~rlorenz/titancraters.pdf
I do wonder if as more data come in we may end up with a real leading/trailing asymmetry...
Posted by: Juramike Jul 13 2007, 01:54 PM
Wow, Aaarrgh, and D'oh!
Thank you very much for the reference. Unfortunately, I had not seen paper before I did all that stuff way up in the earlier posts else I would have referenced it. (I didn't even know 'Hartmann plot' was an official term, and having a log/log plot to reference would've made plotting a heckuva lot easier...)
Blame very poor research on my part....my bad.
"A week in the lab can save an hour in the library".
I completely agree on the erosion rates of craters. If we extend this out, we would expect that older (thus possibly bigger) craters to be heavily eroded and possibly not easily recognizable as craterforms. This is where I'm thinking that some of those strange bright center dark halo objects with incomplete rims might be the eroded and degraded remnants of older big impacts. And that those big impacts caused a different morphology than the smaller "normal looking" craters already identified.
(I think that Menrva was a recent big hit. A very, very lucky hit in many ways).
-Mike
Posted by: Juramike Jul 13 2007, 02:26 PM
The following sequence of images show RADAR images of putative normal impact craters in various stages of erosion, starting from most pristine to most degraded:

|

|

|

|

|
Sinlap must be a fairly fresh impact, as evidenced by the huge amount of bright blue ice visible in VIMS and little, if any, erosion noted. Ksa is similar, but in a semicircle paralleling the central rim, a dark channel can be seen cutting between what might be the debris apron and perhaps additional softer material thrown downwind by airfall deposit. This might be just the first stages of fluvial erosion. The next image in the sequence shows the Shikoku craterform, which has a more developed stream network along the debris apron margin as well as a partial loss of the apron to the NE. It is possible that the NE corner was sapped by a large flood or wave action of a temporary sea. The next image shows Guabonito, here the debris apron has been eroded back considerably and the crater rims have been breached in several places. The gaps all seem to trend WNW to ESE, parallel to local tectonic ridges. The dunes directly W of Guabonito (barely visible in the RADAR image) are facing EW, indicating prevailing wind (and Aeolian erosion) comes directly from the W. So it seems that tectonic faults are setting the weakness fracture lines for further erosion by Aeolian or fluvial (flood) processes. The final image shows the craterform E of the Huygens landing site. This crater has been completely breached by erosion and is rapidly turning into a set of isolated sea stacks in the Shangri-La dune sea.
Taking a quick poll of RADAR-observed obvious impact craters we get:
Fresh craters w/very little erosion (debris apron continuous with airfall deposit): Sinlap
Craters with a little bit of erosion (visible streams cutting into surface of apron): Ksa, Menrva, T23 Swath crater (26.5N, 9W)
Craters with breached walls: Shikoku crater, E Huygens Crater, W Huygens Crater
So even this small sample shows that 3/7 craters are eroded with breached walls (40%). It is also interesting that most of the crater walls that are most degraded are those that are closest to open channel (Example: Shikoku crater). This speculative observation support fluvial (or tidal) erosion as a stronger component than Aeolian.
Erosion rules on Titan.
I wonder how many craters have already been eroded and obliterated beyond obvious recognition?
-Mike
Posted by: Juramike Jul 13 2007, 06:28 PM
Whoa! Check this out:
While staring at the RADAR image of Shikoku facula for the previous post, I identified an additional bright center dark halo feature in the southern portion. The RADAR image and tagged RADAR image is below. Also is the corresponding ISS image.

|

|
This feature fits the bright center dark halo morphology: a RADAR bright but uniform central oval, surrounded by a dark oval halo with an outer heavily eroded rim. The outer incomplete rim is squished in the same direction as the center oval. (In this case, in approximately the same direction and amount as other identified Generation III features and perpendicular to the local tectonic ridges.) It also weighs in at 240 km diameter. According to the analysis in post http://www.unmannedspaceflight.com/index.php?s=&showtopic=4177&view=findpost&p=94530 above, we would expect an impact feature this size to be a bright center dark halo object, and we would also expect it squished in this direction if it was a Generation III and we would also expect it to be heavily eroded. So it fits in nicely with the other bright center dark halo features previously identified.
The erosion pattern also fits the putative formation sequence (from post http://www.unmannedspaceflight.com/index.php?s=&showtopic=4177&view=findpost&p=94072) for the sliced carrot feature, with a similar EW breach along tectonic fracture lines.
Shikoku facula has both a recent (but eroded) obvious impact feature as well as a heavily eroded and squished bright center dark halo object. There may also be a smaller recent and eroded 20 km impact feature to the SW of the Shikoku crater (is that a dim central peak I see way in there?) as well as a possible barely heavily eroded 40 km impact crater to the E of the 20 km crater (not indicated in the image, but if anyone ever confirms it, Ill get to do my happy dance.)
Shikoku may have been constructed mainly of impact feature debris.
It is very noteworthy that the bright center dark halo feature is NOT evident in the ISS image. But it could be picked out by its RADAR characteristics.
Ill bet that additional RADAR coverage of Equatorial Sand Seas basins and associated margins will reveal more bright center dark halo objects.
-Mike
Posted by: Juramike Jul 13 2007, 09:36 PM
Here is a summary of the hypothetical model for the Equatorial Sand Seas that I've got in my head based on the speculative list of craterform features:
It is an old, but eroded surface, possibly 4 Gyr.
Ancient large diapirs may have surfaced in the early Equatorial Sand Sea basins.
Large-scale basin-wide uniform tectonic compression occurred in the Equatorial Sand Sea basins: these squished older craterforms and diapirs in a uniform manner across the basin.
Squished craterforms/diapirs = ancient impacts/diapers
Circular craterforms = recent impacts
Many impacts occurred, but many have been eroded and degraded beyond obvious recognition.
A thick atmosphere in Titans past may have prevented craters < ca. 500 km from forming during ancient times.
Impacts less than 200 km take the appearance of obvious impact craters. Although most obvious impacts are recent, some appear heavily eroded.
Impacts larger than 500 km take the appearance of bright-center dark halo objects. Most are ancient, heavily eroded and have incomplete outer walls.
There may be a crustal transition (deep ocean or warm ductile ice) between 50 km and 300 km deep.
Erosion begins along tectonic fault lines, and may occur by a combination of fluvial, pluvial, and Aeolian processes.
Bright material was deposited throughout the equatorial region (maybe of volcanic origin)
Large scale floods and seas may have removed bright deposits from inundated parts of the basin surface.
Windblown dune sands are the most recently mobile and have obscured past evidence of impacts and erosion.
If plate tectonics is operative on Titan, the sea mega-basins are all part of the same plate (or at most 3: FQAAS, Senkyo-Belet, and Shangri-La-Ching-Tu) and these plates are ancient and have not been significantly subducted or otherwise recycled.
The ocean basins of Titan may be the equivalent of stable continents on Earth. On Titan, the continents and volcanic constructs may be the mobile players.
-Mike
Posted by: volcanopele Jul 13 2007, 11:47 PM
Again, I'm not sure I buy that the feature you have identified as a possible crater in southwestern Shikoku Facula is in fact a crater. Like a number of the features you have identified, the non-circular shape (or to be more accurate, the too-oblong) of the features without any other suggestion of shear deformation would cause me to dismiss that as a crater.
I kinda like the diapir idea for some of these bright spots. I think you have identified a definite pattern, but I don't think those are craters.
Now the other list you recently gave, with Sinlap, Ksa, and Guabonito, and the feature in northeastern Shikoku, those I can buy as craters, or suspiciously circular features, or CRATERs. These are roughly circular and it isn't difficult to explain their current RADAR/ISS appearance.
Posted by: Juramike Jul 14 2007, 12:03 PM
What is needed is a compelling link to tie the two populations of objects (obvious impact craters and bright center dark halo features) together.
Ill contend that we may have already found an outlier example of the link: Menrva.
Menrva has been described as an impact crater, but lacks an obvious debris apron, and has a hummocky central zone instead of a central peak or central plain. (This sets it apart from smaller impact craters such as Sinlap, Ksa and the T23 crater). Menrva has a barely discernable outer dark halo at 1000 km diameter, which is discernable by ISS but not easily by RADAR (unlike most bright center dark halo features). With a central zone/dark halo diameter ration of 0.27 (270 km/1000 km) and an outer dark halo rim size size bigger than 500 km, Menrva fits these characteristics for a Generation I (no squish) bright center dark halo feature. Menrva has also not been significantly squished, heavily eroded, or infilled with dune sands. I strongly suspect that Menrva is a very big and very young version of a bright center dark halo feature located just outside the Equatorial Sand Seas.
As Mernrva evolves, the central hummocky zone would become more RADAR-uniform as the hummocks erode and relax (and uplift?). Over time, the thin ring would erode away and might allow dune sands to penetrate and fill the center. The outer halo rim would also erode and might be breached by surrounding dune sands. The erosion, infilling and breach of the outer halo rim might be accelerated if the region was low enough to allow episodic floods to occur. Menrva is located close to the transition zone between the Equatorial Sand Seas and the Northern Temperate Region. Topographically, it is not clear if the region is low enough to be inundated repeatedly by episodic floods. Meteorologically, the northern part of Menrva (which is centered at 19N) sits in the transition area where seasonal (rather than episodic) rains may bring down atmospheric shizzle on a regular basis. I suspect that rain-plooped gloop dulls the contrast and obscures the RADAR border of Menrvas outer dark halo (but look careful on the W side and you can almost see it as a slight discontinuity in the T3 radar swath).
If Menrva was slightly smaller (25%), with a central dome more uniform, evolved and RADAR-uniform, and with a breached and eroded outer rim, and if the ring section was evolved or buried, and if it were located squarely in the Equatorial Sand Seas, with infilling of the halo section by dune sands, and if the whole shebang were squished ever so gently to the E, then it would look exactly like the feature centered at Elba Facula.
This is why I think that Menrva is lucky: it hit just the wrong place, at the wrong time, and was just a little too big to be the obvious link between the two feature populations.
Im pretty confident that further RADAR coverage of Equatorial Sand Sea basins will find more solid examples.
-Mike
Posted by: Juramike Jul 15 2007, 08:00 PM
WARNING: Highly speculative content ahead
]
If the bright center dark halo features have an impact origin, then the Equatorial Sea Basins are very old and have been subject to large scale tectonic compression.
From the overall orientation of the craterforms we can map the trend of the large scale tectonic compressions in the basins. This shown below:

|

|

|

|
One possible way that the large-scale tectonic compressions could occur on Titan is shown below:

|

|

|
In this hypothetical scenario, cryovolcanic constructs on Titan act as point spreading centers and extrude material out onto the surface. This material pushes surrounding Titan basin material and causes it to scrunch up. Contrast this to Earth, where mid-ocean ridges behave as spreading centers and make new surface, scrunching (or subducting under) continents. On Titan, the basins are squeezed between surrounding cryovolcanic constructs or continents. In this scenario, the Equatorial Sand Sea basins would be ancient terrain and the cryovolcanic constructs would be younger. [There may be also a density difference between the types of terrain: the freshly erupted ice may be porous ice, while the sand sea basins may have porous ice partially filled with methane.]
On Mars, the Tharsis Bulge construct caused a localized downwarping of surrounding terrain (see: Phillips et al Science 291 (2001) 2587-2591. Ancient Geodynamics and Global-Scale Hydrology on Mars. Pay-for article: Abstract available http://:%20%20
A series of cryovolcanic constructs could thus form and compress the basins to provide the surface pattern we see today. In this hypothetical model, the Equatorial Sand Seas basins were created as a result of the eruption of surrounding cryovolcanic constructs.
-Mike
Posted by: Juramike Jul 15 2007, 08:13 PM
[WARNING: Still more highly speculative content ahead
]
Following the scenario posted above, here is a hypothetical formation sequence of the Equatorial Sand Sea Basin:

|

|

|

|

|

|
The first thing that happens in this sequence is emplacement of the large diapirs (and most of the bright center dark halo features). These include Adiri as well as the Dilmun peninsula which may be either a large diapir or a cryovolcanic construct. These were originally placed as roughly circular features.
Next, large volcanic constructs begin to form which cause tectonic compressions in the basins. This is the Generation III compression. It is predicted that there is a secret volcanic construct that is roughly centered at 40S, 240W. This construct will compress Shangri-La to the NE, and Belet to the NNW. In the Shangri-La protobasin, this compression compresses Aidri, as well as Bacab virgae and also emplaces the general EW trending tectonic ridges across the W Shangri-La basin. Similarly, both Tseghi and young Xanadu cryovolcanic constructs begin to form. Overall, the compressions from these constructs combine to compress Fensal, Quivra,Senkyo basins and features therin in a general NE trend. (It is predicted that there will be tectonic ridges across this region that is approximately oriented along a NW-SE trend.).
Following emplacement of Generation II features (impacts, etc.), there is further (continuous?) activity at Xanadu which compresses the FQAAS basin to the E and perhaps Shangri-La to the W. Each volcanic event coughs material into the atmosphere which is deposited globally (although maybe zonally?)
All of these volcanic constructs and diapers cause regional or localized downwarping which causes a moatlike basin around each feature. These combine to produce the topography patterns that are observed in the Equatorial Sand Seas and associated areas. These areas are flooded during episodic inundations.
In the mid-latitudes and northern temperate and southern temperate zones, seasonal rains bring down atmospheric chemistry products. (While Earth rains can be romantic, Titan rains are icky.) These materials will coat everything, filling in topography and basins and generally dulling contrast in both RADAR and ISS. There will be a general gradient of increasing shizzle away from the Equator. The higher latitudes will have the lowest constrast. The downwarped areas further from the equator will have much lower contrast and may have been filled in with the large amounts of atmospheric crud.
Closer to the equator, we will find the bright materials resulting from cryovolcanic venting coating topographically high areas. While in the mid-latitudes we will see a mix of cryovolcanic materials and atmospheric products. Further from the equator, we will find a ratio that favors atmospheric chemistry products brought down by rains.
At the poles there may be different materials due to chemical reactions in the dark polar hood.
Finally, the episodic large-scale massive flood events remove/erode/chemically modifies the bright material coating below the highest level attained by the liquid in the Equatorial Sand Sea Basins.
This sequence of events provides a mechanism to explain the VIMS data presented by Barnes et al (Barnes et al. Icarus 186 (2007) 242-258. Global-scale surface spectral variations on Titan seen from Cassini/VIMS. Paper freely available http://c3po.barnesos.net/~jbarnes/publications/papers/Titan.spectral.diversity.pdf.) The predicted surface properties from the model above and the observed VIMS terrains presented in the Barnes et al. article are shown below:

|

|
This model also explains the lack of contrast in RADAR and ISS images of the north and south temperate regions as well as many of the features observed in the Equatorial Sand Seas.
-Mike
Posted by: Juramike Jul 15 2007, 08:17 PM
For all you hip-hop kiddies way out there in UMSF-land, Grandmaster Mike-Mike gonna lay it down
A new impression,
tectonic compression
Place is so cold,
Basins way old
Oceans down deep,
Volcanoes that creep
Comets are smackin,
Crust is crackin
Building up hill,
Deep in the chill
Stop! Break it down
(erosion solo)
Fluids in motion
A liquid flash ocean
Sediment loading
Craters eroding
Ice is groovin
Sands are movin
Vents are dustin
and salts are rustin
Zig-a zig-a zig-a wiff-waff zig
Methane drizzle,
Bringing down shizzle
Places all smothered,
Craters all covered
Check out the spectra!
Seein what you expecta?
Craters w/out rims?
Check out the VIMS!
SAR RADAR fishin
In the extended mission!
And a whole new chapter
Sends me to rapture
Wiff-wiff wiff-waff wiff-wiff wiff-waff zig-a zig-a zig
(fade)
Peace out, yall.
-Mike 
Posted by: mchan Jul 16 2007, 01:25 AM
LOL! Stu for the hip-hop crowd.
Posted by: Stu Jul 16 2007, 06:55 AM
Genius Mike, absolute genius! You da man!
Now all we need is to convince one of the CASSINI team to stride up to the mike at the next media briefing, dressed in black shellsuit and shades, draped in gold chains and bling, and perform that rap for the cameras and the watching world.
Any suggestions, or volunteers? (cough... rlorenz... cough)
Posted by: ngunn Jul 16 2007, 08:38 AM
I know I'm a bit behind the times here but I'd just like to thank Juramike for that eroding crater sequence in post 146. Very nice handy format reference - and almost uncontroversial!
Posted by: Juramike Jul 18 2007, 07:32 PM
If the model developed above is correct, it should also be predictive.
[But even if it does turn out to be predictive, it is not necessarily correct.]
According to the above model, these are the predicted markers and patterns in order to find putative craterforms (impact craters, bright center dark halo features, and diapirs) in the different regions:
Temperate zones/polar zones:
Huning craterforms in this area may be very difficult. Older craters will be deeply buried. Even younger craters will be barely discernable. More difficult to find the further poleward away from the equator.
ISS/SAR RADAR will probably not be helpful, due to low contrast.
RADAR dipole measurements/VIMS may show chemical signatures of central halo/fresh ice from impact. Once located, SAR RADAR may be able to confirm the shape under the shizzle.
Are any of the polar lakes craters, bright center dark halo objects or flooded diapers?
On temperate areas and polar areas of continents and volcanic constructs (Xanadu/Tseghi) finding craters will be most difficult. The expected erosion of the continental masses will create topological contrasts (valleys ridges, etc.) that may make it difficult to identify craters. In addition, due to the differences in crustal properties and thickness, the larger craters may have a very different morphology. (Would central pit craters substitute for bright center dark halo objects?). Old craters, if present, may be stretched, squished, valleyed, washed, and eroded quickly beyond recognition.
Temperate basin areas around the volcanic constructs may be relatively easier due to slight topographical contrast and the expected age and relative stability of the basin regions. The portion of the basin furthest away form the volcanic constructs might be the best area for hunting.
In the Equatorial Sand Seas:
SAR RADAR will be the best tool for detection and confirmation of regular impact craters and bright center dark halo features. The expected contrasts with the dark sands will make it easier to spot possible craterforms.
VIMS will be helpful for spotting recent impacts due to the strong blue ice signature, and may also help find eroding ice sands in areas protected from invading dune sands for older structures.
Due to fluvial, tidal, pluvial, and Aeolian erosion, craters may erode quickly to barely discernable shapes having chopped or incomplete rims (usually on the dune sand side).
Given the expected age of the equatorial basins, the bright center dark halo features may be squished and non-circular. Vectors should be similar to others in the region previously identified. (So wed predict that a bright center dark halo object in NE Fensal should be squished to the NE if it is a Generation III feature)
The best place to look would be in shallow margin areas bordering the Sand Seas. I would guess that NE Shangri-La, N Aaru, and NE Fensal, as well as N Belet and N Senkyo might be good craterform hunting grounds. (Southern areas might have been downwarped due to the putative volcanic landmasses and encroaching dune sands may have then swallowed craterforms.). Areas protected from the encroaching dune sands might also have a better contrast. (NE Fensal? NW Senkyo?)
Given all these tips, it should be possible to examine all the current and future RADAR swaths, images, and other products to hunt for putative craterforms (obvious impact craters, bright center dark halo objects, and diapirs) on Titans surface.
(I just got buried at work preparing two monster patents [Juramike get paid to obfuscate research], so Ill give yall until August to beat me to it!)
Happy Hunting! Set them dawgs loose! Tally Ho!
-Mike
Posted by: Juramike Jul 20 2007, 03:37 PM
Here is an example of some interesting features definitely worth a closer look.
This is an expansion of an ISS-VIMS combination made by Ian R (from post http://www.unmannedspaceflight.com/index.php?s=&showtopic=3168&view=findpost&p=93381) in the area around Menrva (edging into the North Temperate shizzle zone):

|
A feature to the SSW of Ksa is indicated by a red arrow. This is a potential bright center dark halo feature that would be about 400 km diameter. Further examination would be of interest for this feature:
For a bright center dark halo feature we sould expect:
SAR RADAR - (uniform bright mottled center possible straight edges)
higher resolution ISS - (possible straight edges of the center section Ill guess WNW-ESE general trend)
RADAR bistatic experiment - (nothing weird)
high resolution radiometery data [expect Tb about 80 K (putative older) or slightly lower Tb 70 K(putative younger) if I read the graphs correct].
[Course, the SAR RADAR swath data will probably be released before the high resolution radiometery data is published.]
Another very interesting feature is directly to the W of Menrva, indicated by a blue arrow in the image. This shows up nice and bright in ISS, as well as having a bright ice sand signature in VIMS. The VIMS signature surrounded by a darker outer ring makes this a very interesting feature for futher examination. (Since it lies in the outer dark halo of Menrva, Id guess that this is a more recent feature than Menrva.) Sadly, it was just missed by the T3 RADAR swath (the feature is a tad too far to the north).
The spots marked with a ? are of interest for further examination when more data come available. They could be concentric features on the surface, imaging artifacts, or lucky pixel alignments. It would be interesting to reexamine them if higher resolution ISS becomes available or if a future RADAR swath passes over this area.
-Mike
Posted by: Juramike Jul 23 2007, 07:48 PM
Are surface features primarily Aeolian or tectonic?
Assuming that bright areas in the Equatorial Sand Seas are areas that were not inundated during the last flood event, I attempted to connect the dots to show the pattern of exposed ridges and bright islands. (Ridges in W Shangri-La and Adiri were evidenced by SAR RADAR in the T8 RADAR swath. These were presented back in post http://www.unmannedspaceflight.com/index.php?s=&showtopic=4177&view=findpost&p=91115 (this thread) for the depth calculation in W Shangri-La. Those lines are indicated in red.)

|

|

|
Most of these lines trend W-E. This is the same direction as the prevailing W global wind on Titan in the Equatorial regions.
Are the ridges tectonic or Aeolian in origin? There might be an easy way to check .
The key will be to examine areas where we expect that a tectonic ridgeline will be off-angle to the prevailing W wind. This might happen in a few areas (indicated below with a blue circle): N Belet, NE Shangri La, E Aztlan, and perhaps S Senkyo. (and maybe SE Belet?).

|

|

|
By examining these areas using we may be able to determine if the dunes (thus local wind pattern) line up with the bright islands as expected for Aeolian origin, or if they smack into the islands at an angle, as wed expect for tectonic origin.
By VIMS dark blue ice sands will reveal the wind shadow, since the dune coverage will be less in the lee of the islands. If the bright islands are of Aeolian origin, then the local wind shadow, and thus VIMS dark blue ice sands, will be in line with the islands. If the bright islands are of tectonic origin, then the wind shadow, thus the exposed VIMS dark blue ice sands, will be off angle to the islands.
-Mike
Posted by: Juramike Jul 27 2007, 07:18 PM
Attached find a pieces of the recently released T28 RADAR swath (PIA09217 http://photojournal.jpl.nasa.gov/jpeg/PIA09217.jpg) pieces placed into the Exploitcorporation Fensal Aztlan mosaic.

|
[My computer can't handle big images, so I chopped sections into a series of screenshots then reassembled them in Powerpoint. It's not super pretty, but its a first pass approximations]
<Illuminate Batsignal for Exploitcorporations>
I referenced on the 'starfish-looking thingy' (Sotra Facula) seen in the T25 Swath.
That's the W half of of Coats Facula down there in the lower right of Quivra.
-Mike
Posted by: Juramike Jul 27 2007, 07:38 PM
(Staring at that RADAR image above, it looks almost like the feature surrounding the center of Coats facula and Quivra itself are two separate items. As if looking at an underwater shoal (the Coats Facula part) with spume and seafoam on the top (the Quivra part).)
(Maybe the only reason that they look combined in ISS/VIMS is that the elevations of both parts happened to have been above the "inundation zone"?)
-Mike
Posted by: Juramike Jul 27 2007, 07:58 PM
Evidence that supports that Islands and ridges are tectonic, rather than aeolian, in origin (at least for these two in N Quivra):

|
(From T28 RADAR swath). Brown arrows indicate averaged winds (evidenced by dunes) and yellow line indicates presumed tectonic "feature" connection between islands. (And no, I hadn't seen T28 data before I made the diagram in post 159 above).
-Mike
Posted by: volcanopele Jul 27 2007, 08:43 PM
No one has argued that the bright features within dark terrain are aeolian in origin. I think it is pretty clear that they are tectonic. What we have argued is that they have been later sculpted by aeolian forces, likely through the deposition of dark particulates into dunes.
Posted by: Juramike Jul 27 2007, 09:11 PM
I've been puzzling over the bright features ever since the bright island chains in the T8 RADAR swath W Shangri-La "ski tracks images" were released.
I had all sorts of wild ideas:
Tectonic (seems like the winner)
Aeolian
Fluvial (flood remnant)
Rough methane snow patch (??)
Vented water/thrust up diapir
Some sort of wierd previously floating organic-berg that was dropped in place by a big flood
Chemical (crashout of an organic species, an organic equivalent of Lake Natron (cool-o image http://earthobservatory.nasa.gov/Newsroom/NewImages/images.php3?img_id=10852)
[And if I was in any other forum I wouldn't even dare mention it, but I also considered biological origin, which is pretty much the same as a chemical origin. [Biology is just a subset of chemistry ]]
There is always the possibility that it is a combination of many of the above:
F'r instance, tectonic cracks release an organic species circulating in an underground methanofer (acetonitrile?) which crashes out and makes a big pile, then gets eroded by floods, rain, and wind.
(But I prefer the tectonically forced ice hill idea)
The key is that the ridges and islands can be used to trace local tectonic force lines. Just like the dunes can be used to trace the local wind patterns. It just seems that both line up pretty close to the same vectors in the Sand Seas.
-Mike
Posted by: Juramike Jul 27 2007, 11:34 PM
The lineup of the T28 Swath with the Exploitcorporations mosaic shows the W section of the Coats Facula feature. A putative formation sequence for this feature was described in post 122 (http://www.unmannedspaceflight.com/index.php?s=&showtopic=4177&view=findpost&p=93997). The ISS vs. RADAR appearance of Coats Facula is shown in the next graphic. The comparison of actual vs. predicted is pretty close for the RADAR image. A zoom of the RADAR image is shown in the next graphic, with key features highlighted.

|

|

|

|
The yellow and orange rings show what might be multiple concentric features at the center of the overall features. A blue zone to the SW shows an area that corresponds with the terminal SW peninsula in the ISS image. This area might resemble the spooky hooded dude formation near the Huygens landing site: fluvially sculpted ice sand cobble pile that is fairly high where the higher portions are painted with bright material.
Further away from the center of the Coats Facula feature, there is a broad oval zone of radar medium (not dark) area that may correspond to roughish ice boulders (cobble field) washed down and deposited by the large streams that seem to surround an apparent basin. This area is dark blue ice sands by VIMS. (Interesting, in Fig. 6 of the Soderblom et al article, the NW bright-dark boundary of Coats Facula in ISS retreats to the NE when viewed by VIMS. This indicates that the area is bright by ISS but shows the chemical signature of dark blue ice sand one interpretation is that it is an upland ice-sand basin. Immediately beyond this is an area of RADAR darker (smoother or flatter) terrain. This could correspond to an area of finer particles of dark blue ice sands, or perhaps the edge of a mesa. (Perhaps it is a dark blue ice sand beach emplaced by a larger flood earlier in Titans history?). Rivers cut through this area, some with a delta network with RADAR bright rough ice boulders. (Remember the bright boulder delta to the E of Menrva?) The slightly brighter boulders brought down by the rivers can be traced through the ice cobble basin. Further out from this appears to be an area of uplifted brighter terrain (blue dashed line). And futherest out (purple line) is a tectonic ridge. A closeup of this ridge looks like the ridges of Sotra Facula (which to me looks lke a fossil brittle star). The tectonic ridges almost look like the ski track ridges of the T8 swath in W Shangri-La. Perhaps the backbone of Quivra is slightly higher, rougher, and lack the inter-ridge dune deposition of the W Shangri-La ridges.
I also highlighted an area that almost looks like a mini version of the basin complex. Maybe a little eroded, lopsided and breached crater. (Note the inner medium bright ice cobble area surrounded by a RADAR darker ring of beach sands VIMS still has this as primarily dark blue ice sands and not dark brown dunes.)
Finally, I made an image comparison with Coats Facula and Menrva. If Mernrva was smaller, squished, and older, it could fit with the current appearance with Coats Facula.

|
Menrva-->Coats Facula:
* Larger steam channels network
* Central hummocky terrain eroded down to RADAR blandness
* More ice cobbles emplaced in outer basin
* Little to no dunes emplaced (Coats Facula is wind protected by the Quivra ridges compared to Menrva).
* Outer ridges worn/relaxed down
* Outer wall breach on SW side
-Mike
Posted by: hendric Jul 28 2007, 04:12 AM
-Mike
Mike,
I'm surprised you didn't continue the potential hotspot line to the third island, further E. Also, the two islands directly above also form a line, nearly parallel to the first. Potential island chains? You can keep playing the game even further, looking east to where the first line intersects the "mainland", it looks like there is a start of a fourth island there.
Posted by: belleraphon1 Jul 28 2007, 04:42 AM
WOW Mike...
apologize that I have not had the time to really get through this thread. You have been quite productive.
We REALLY need GOOD altimetric data. So far, for the most part, we are dealing with albedo data only. There are obvious elevation effects visible, such as dunes being herded around higher obstructions, but I think that is it.
I have always thought of Xanadu as being a Tharsis type bulge region, but I believe northern and southern plains have similar VIMS profiles....
I REALLY NEED TO GET CAUGHT UP HERE.
On slide 19 of http://saturn.jpl.nasa.gov/multimedia/products/pdfs/20070626_CHARM_3Year.pdf
a Tharsis type region is mentioned for the Ganesa Macula area.....
I wonder if the H2O/NH3 ice bedrock is more prone to taffy like squeezing than a silicate crust? If your crater speculations are correct, than maybe the same tectonic forces that have caused the equatorial "lowlands" have also squeezed the circular crater forms into ovals, etc.,
This ain't Earth and the materials and rheologies are different.
On that note, just want to share a scare I had viewing the raws of the TA encounter. Specks and digital defects in the images looked like craters at first glance and I thought, SHOOT!!!!! Titan is just a lunar surface under a thick atmosphere..... first impressions are deceiving.
Craig
Posted by: Juramike Jul 30 2007, 06:40 PM
Quivra!

|
-Mike
Posted by: Juramike Jul 30 2007, 06:47 PM
W Quivra RADAR mosaic (T25 + T28): W_Quivra_RADAR_mosaic.bmp ( 618.01K )
: 374
W_Quivra_RADAR_mosaic.bmp ( 618.01K )
: 374
-Mike
[EDIT: I apologize in advance. The mosaic is impressively high-resolution on my computer screen when displayed in Powerpoint - the dunes stand out like fingerprints. But both the .bmp or .jpeg are at mush lower resolution.
Does anyone have any tips on how to save or post this on UMSF so that the same resolution is maintained?]
[EDIT2: Oh yeah. The original Powerpoint file is 18 Mb.]
Posted by: Juramike Jul 30 2007, 10:31 PM
Here is an improved resolution W Quivra mosaic that I can paste in:

|
I messed around this afternoon and was able to convert the high-res but memory intensive .ppt file into a OK-res .GIF file (Thanks to Pavel for some really helpful advice!)
Enjoy!
-Mike
Posted by: Juramike Jul 31 2007, 12:30 AM
Zooming into Coats Facula reveals some interesting features. (Sorry, I can do this with my file - please check it out on the original PIA08352 jpeg of the T28 RADAR swath).

|

|
It appears that just at the edge of the RADAR swath there is a small circular rim with a depression in the center of the RADAR bright center of the bright center dark halo feature.
Could this be the evidence supporting an impact origin?
I've compared the image and derived geologic map of Callanish crater on Europa (impact) with that of Coats Facula (origin unknown). The map was described in Moore et al Icarus 135 (2007) 127-145. "Large Impact Features on Europa: Results of the Galileo Nominal Mission" (Full paper freely available http://lasp.colorado.edu/icymoons/europaclass/Moore_impacts_nominal.pdf. Check out Figure 10.) The similarities between the two features are pretty compelling, if one allows for tectonic compression(s).
The authors state (regarding Callanish) "The material of the outer zone appears to pond in low areas and appears to have been emplaced in a fluidized state, perhaps as a slurry." Furthermore, "there is no evidence for a present day depresson asociated with this impact feature".
The authors also review that Callanish and other features may have been formed by non-impact processes, such as venusian coronae or terrestrial ice cauldrons. As the authors state "while Callanish and Tyre both exhibit some of the features of venusian coronae and ice cauldrons*, these nonimpact processes would not produce the fields of radially arrayed pits or dots around Callanish and Tyre interpreted by us to be secondary craters."
To really nail an impact origin, we would need to see secondary craters and see their cut-off in the debris apron. Unfortunately, given Titan's swift erosion of small craters, coupled with poor resolution due to atmospheric effects, this ain't gonna happen anytime soon.
-Mike
*ice cauldrons "on Earth form under ice sheets when localized subglacial heating forms a dome-shaped reservoir of liquid water melted at the base of the ice. Eventually, the water pressure exceeds the ice overburden pressure and the water drains from the reservoir causing the surface above it to sag, creating concentric fractures, and forming the ice cauldron."
[All quotes from Moore et al. article]
Posted by: nprev Jul 31 2007, 12:38 AM
Good grief!
Circles all I see, yo
Juramike's da G, yo
Not tectonic, definitely chronic
Starin' at the pics, feelin' moronic...
Tempo change...
Determinism [DA-dah-da, da-ta-da, DAH!]
Merely a syllogism
Reality confounds,
diversity abounds
in landforms and origins...
Titan is off da hook
Wilder than any crook
You think it's a crater?
Well, maybe later
Can't tell from this Space Invader...
WORD!
Posted by: belleraphon1 Jul 31 2007, 01:25 AM
|
|
I messed around this afternoon and was able to convert the high-res but memory intensive .ppt file into a OK-res .GIF file (Thanks to Pavel for some really helpful advice!)
Enjoy!
-Mike
Thanks Mike.....
At radar frequencies, I swear this is a "planet" designed by Dore..... more fevered than any hip-hop tune, more worthy of Poe.... or Lovecraft..... is Arthur Gorden Pym wandering these dunes? But instead of fear for the unknown..... we embrace it. All the worlds that share our Sol together would be deadly traps for an unprotected human. But that does not in any way null the beauty. And I think every person on this forum would love to have the benefit of some 23rd century tech suit and wander these worlds on foot or in glider....
to see and be a part of all this .....
How grand.....
Craig
Posted by: Juramike Jul 31 2007, 02:48 PM
There is a new image released today on the Planetary Photojournal: http://photojournal.jpl.nasa.gov/catalog/PIA08995/

|

|
It is a nice shot of Adiri and it also shows what might be a Hotei Arcus look-alike in a southern continent. Could this be another Xanadu-like cryovolcanic construct down there?
Titan is just full of Smiles!
-Mike
Posted by: Stu Jul 31 2007, 10:09 PM
Yep, saw that... here's my coloured in version, purely for that "wow!" factor again...

|
Posted by: belleraphon1 Aug 1 2007, 03:31 AM
Great image Stu....
looking at that I can almost hear the wind howl.... sure looks like a lot of aeolian erosion going on.
Mike and all .... note the clouds over that possible "Hotei 2" in this image http://photojournal.jpl.nasa.gov/jpeg/PIA08966.jpg
As for digging through layers..... bet a revolution in organic chemistry awaits....
(side note for volcanopele..... love to dig through layers on Io as well..... I am sure there are complex chemistries working magic there as well).
Craig
Posted by: Juramike Aug 2 2007, 12:24 AM
The Starfish thingy (to me this feature looks like a fossilized brittle star) in Aztlan looks similar to Tortola Facula (The Snail) in the Shangri-La basin. Like Tortola Facula, Sotra Facula may also be cryovolcano. Sotra Facula (-12.5S, 39.8W) has some interesting features just to the north and east that can be observed in the T25 RADAR swath. These features look like ghost images of older eroded versions of Sotra Facula, fading away to the north-northeast. These are indicated by blue arrows in the first diagram:

|

|

|
Sotra Facula and its ghost images in Aztlan look similar to the Hawaiian island Emporer seamount chain in the Pacific on Earth (Wikipedia on Hawaiin Emporer seamounts http://en.wikipedia.org/wiki/Hawaiian-Emperor_seamount_chain) The Hawaiian islands are thought to result from hotspot volcanism. (Wikipedia for hotspot volcanism http://en.wikipedia.org/wiki/Hotspot_%28geology%29). As the Pacific plate drifted over the plume, a series of volcanoes erupted. For the Hawaiian island chain, tracing the most recent volcano (Loki seamount) to the oldest island gives the movement history of the Pacific plate. It seems plausible that the ghost images of Sotra Facula are older cryovolcanic islands left behind as the crust of Titan moved over a hotspot. The entire complex may be a cryovolcanic island chain. (For reference, Sotra Facula is almost twice the size of the Big Island of Hawaii).
A hypothetical formation scenario for the Sotra Facula cryovolcanic island chain is shown below:

|

|

|

|
We may be able to estimate the drift due to tectonic compression on Titan. By starting from Sotra Facula and working backwards, we see a slow bend to the NNE. This matches very nicely with the squish vector measured for the Generation III features in the Fensal-Quivra-Aztlan basin.
The Sotra Facula complex was also imaged in the T28 RADAR swath. It might be interesting to see if this could be used to better estimate topography. Just how viscous were those flows?
So polarize up your surfboards, the Big Waves are pounding Sotra!
Frozen drink, anyone?
-Mike
Posted by: Juramike Aug 3 2007, 11:35 PM
There are many ways that could explain the formation of the tectonic structures across Titan that are most evident in the Equatorial Sand Seas area:
One possibility, previously mentioned here (post http://www.unmannedspaceflight.com/index.php?s=&showtopic=4177&view=findpost&p=95022 this thread), is that an extruded cryovolcanic construct oozes water (ice) onto the surface which flows into the basin. Having approximately the same density, it compresses the basin rather then merely subducting or riding over the basin crust. This is shown graphically below:

|
Another possibility is if molten ice (also known as water) rises up into domes on the surface, then cools, expanding as it freezes into an ice I (low pressure ice) crystalline form. If this occurred on either side of a Sand Sea basin, compression and tectonic ridges would result:

|
Yet another hypothesis is explained by Mitri and Showman (reference: Mitri and Showman Ice Oceans and Fire: Satellites of the Outer Soalr System (2007) Abstract 6013. "Thermal Convection in the Ice-I Shells of Titan and Enceladus. Abstract freely available http://www.lpi.usra.edu/meetings/icysat2007/pdf/6013.pdf). They postulate that Titan is big enough to have high pressure ice under the subsurface ocean. [To quote David Byrne: there is water at the bottom of the ocean]. High pressure ice phases behave like most normal materials, it contracts as it cools. (Ice I (low pressure ice) is the exception: the highly ordered crystalline matrix of ice I is of lower density this is why water ice floats). (check out lower part of Wikipedia http://en.wikipedia.org/wiki/Ice for Ice for list of different ice phases and their properties)

|
From the Mitri et al abstract:
High pressure ice polymorphs could exist on Titan between the ocean and the rocky interior. During the cooling of the planet, the radial expansion of the ice-I layer is, in general, counterbalanced by the radial contraction of the ice high pressure layer. Therefore, a global contraction of Titan could occur during its cooling. The radial contraction of Titan could build compressive surface structures.
It is possible that as the surface of Titan cooled, the outer ice I shell expanded, but as the interior cooled further, the high pressure ice then contracted resulting in an overall contraction. In this scenario, the surface may have expanded, then contracted to do a stretch and squish.
-Mike
Posted by: nprev Aug 3 2007, 11:47 PM
Mike, just wanted to thank you & again express my amazement at your work and that you still can maintain a day job...can't imagine where you find the time, but damn grateful that you do!
You're making quite a case for a currently active Titanian surface with numerous processes in the mix. I think this has been asked before in a different fashion & thread, but what would be the effect of the presence of various common metals & silicates on these theories?
Wondering here if some exotic catalytic reactions might be possible & their outcomes, 'cause you know that a significant amount of this material must ultimately reach the surface as dust--mostly iron & nickel--every E-year (provided that the impact rate on Titan of this stuff is even 0.1% of that in the inner solar system, which seems like a reasonable extrapolation).
Posted by: Jason W Barnes Aug 6 2007, 03:36 PM
|
|
|
|
It is a nice shot of Adiri and it also shows what might be a Hotei Arcus look-alike in a southern continent. Could this be another Xanadu-like cryovolcanic construct down there?
This is almost certainly a cloud -- VIMS doesn't have coverage at the same time that this long-distance shot was taken, but our views at other times don't show anything unusual there like we see at Hotei Arcus. There are clouds there in the VIMS T33 view, but the caption claims that this image was from T32. Hope this helps,
- Jason W. Barnes
Posted by: Juramike Aug 7 2007, 04:30 PM
- Jason W. Barnes
Could the cloud be due to orographic lift? That might indicate a massif in this area.
I'm (wildly) speculating that there might be an older, slightly smaller version of Xanadu in this area.
Since it's presumed older (than Xanadu), the vents of the massif would be much less active, maybe even dead. I would postulate that VIMS spectra would look more like Tseghi (thus, not unusual), not like the the freshly erupted (?) deposits near Hotei Arcus on Xanadu.
I'd also guess that it might also have larger river networks like Xanadu flowing down around the massif. Maybe with the changing seasons we might also see clouds more often in this area. Perhaps rain comes more often to the high massifs? (Many long riverbeds on Xanadu, not so many on Adiri). Interesting to check out this area by future ISS and RADAR swaths.
And while I'm wildly arm-waving, I'll also speculate that there might be a polar/temperate-style basin on the southern edge of the proposed Greenland-sized massif. So while it might be low-lying like a Sand Sea, it may have been covered in several eons worth of atmospheric products. It would then look like a buried version of Mezzoramia (RADAR brighter, VIMS less exciting) around the southern edge, perhaps with a few lakes dotting through. Sort of a Mezzoramia Marsh.
How far south does VIMS coverage go in this area?
-Mike
Posted by: volcanopele Aug 7 2007, 04:43 PM
Orogenic lift? I doubt it. That little guy is at around 40S, like nearly all the mid-latitude clouds. Probably just due to Titan's global circulation pattern uplifting there.
No evidence thus far for a Xanadu-like region or a massif in the area. Tsegihi ends a couple of thousand km to the west.
Posted by: Juramike Aug 7 2007, 08:41 PM
Oh well. I'll keep a watchful eye. It was wild speculation anyway...
If supporting evidence does eventually turn up, I'll switch to my happy dance instead of my "oh well, guessed wrong" dance. (The guessed wrong dance is similar to the happy dance, except I slap my head repeatedly).
But on second thought:
Gee, what would consider good evidence for a massif?:
Is RADAR altimetry the only way?
Would big mountains in RADAR or by ISS shadowing (ISS patterns like seen waaaay over in E Tseghi)?
Would big honking huge long rivers count as supporting evidence?
(Relative brightness of terrain probably won't work, since Titan's atmosphere is so thick that either adding or subtracting the last few km of smog would have a negligible effect)
Anything else that could provide evidence for a massif?
-Mike
Posted by: volcanopele Aug 7 2007, 08:52 PM
Areas that have a higher altitude tend to be brighter but we can't tell the difference between higher altitude areas and mountains within those areas. For example, at near-IR wavelengths, you can't distinguish between the smooth bright areas and the mountain chains in Adiri. That's part of the reason why I don't believe that VIMS saw mountains in Eastern Tsegihi (I happen to believe they are the opposite, that they are very young graben with some slightly older valleys that have been filled in with sediment next to them).
Mountains would show up in RADAR SAR. Massifs would show up. Some low ones that have been carved by methane can be seen in western Xanadu.
Posted by: Juramike Aug 7 2007, 09:40 PM
Is there a handy link or image showing the upcoming and future SAR RADAR swaths?
I swear I had one bookmarked, and that it was mentioned several times in this forum, but I just spent a few minutes poking around for a bit and can't find it! (Frustration!)
-Mike
P.S. Searching "RADAR" in this forum is not going to be helpful.
[EDIT: I think this was the link, but it is no longer active: http://cassinicam.com/titanflybys/titantracks.html]
Posted by: belleraphon1 Aug 8 2007, 01:06 AM
I swear I had one bookmarked, and that it was mentioned several times in this forum, but I just spent a few minutes poking around for a bit and can't find it! (Frustration!)
-Mike
P.S. Searching "RADAR" in this forum is not going to be helpful.
[EDIT: I think this was the link, but it is no longer active: http://cassinicam.com/titanflybys/titantracks.html]
Mike... I had the same link bookmarked and it is no longer active. Really wish we had some good detailed maps of the current radar swaths and tracks for the future ones. Rlorenz hinted there was more good stuff to come. I believe him
We must learn patience in this era of instant electronic gratification. I have waited 27 years to see this kind of detail.
Craig
Posted by: Juramike Sep 4 2007, 03:42 PM
Like Ganymede, it is possible that after the differentiation of Titan, the initially formed slushy crust expanded as it froze. This could have resulted in a grooved terrain on Titan that would be similar to the grooved terrain seen on Ganymede.
Following the initial expansion of the surface, cooling of the lower high-pressure ice phases would have resulted in a contraction. (Ice1 expands on freezing due to Ice1s highly ordered structure; however, other high pressure forms of water ice contract on cooling.)
The proposed stretch-squish of Titan is illustrated below:

|

|

|
A recent article by Bland and Showman models the formation of the grooved terrain on Ganymede. (Bland and Showman Icarus 189 (2007) 439-456. The formation of Ganymedes grooved terrain: Numerical modeling of extensional necking instabilities. (pay-for article abstract http://www.sciencedirect.com/science?_ob=ArticleURL&_udi=B6WGF-4N3WYPM-4&_user=10&_coverDate=08%2F31%2F2007&_rdoc=1&_fmt=&_orig=search&_sort=d&view=c&_acct=C000050221&_version=1&_urlVersion=0&_userid=10&md5=e414ffd8e6b051cd27476668be4e8cce) [A similar and free abstract is available: Bland and Showman LPS 37 (2006) Abstract 1417. Tectonic Resurfacing of Icy Satellites by Periodic Necking Instabilities: Application to Ganymede and Enceladus." (abstract freely available http://www.lpi.usra.edu/meetings/lpsc2006/pdf/1417.pdf)].
The authors model the complex pattern of grooves seen on Ganymede. They show that pre-existing topography could be overprinted by periodic ridges and troughs. The spacing of the ridges and troughs is complex and depends on initial conditions, transient conditions (due to changing thermal gradients due to extensional necking) and hysteresis (what pattern was there before?), but that the overall result is a regular repeating set of tectonic ridges. (One of the key initial conditions is the thermal gradient). On Ganymede there is a large wavelength pattern seen by Voyager (2-6 km wavelength, 500 m amplitude) and a smaller wavelength (1 km) discerned by Galileo. As the authors mentioned in the text: This dominant wavelength is generally three to four times the thickness of the deforming layer.
An illustration of the ridge and trough pattern is shown below as was proposed for Ganymede. (The necking causes regular tectonic faulting). Reference: Pappalardo et al Icarus 135 (1998) 276-302. Grooved Terrain on Ganymede: First Results from Galileo High-Resolution Imaging." (Full article freely available http://icuc.wheatonma.edu/~gcollins/papers/Pappalardo_etal_Icarus_1998.pdf (slow download)).

|
It seems possible that the regular tectonic ridges seen on Titan (major wavelengths measured: 80 km in T8 and T30 RADAR Swaths and 50 km in T25 and T28 RADAR swaths [link to T28 (April 27, 2007) post 100 http://www.unmannedspaceflight.com/index.php?s=&showtopic=4071&view=findpost&p=96020]) may have resulted from an initial Ganymede-style grooved terrain tectonic system that was initially set up during the crustal extension period early in Titans history. (Stretch )
It also seems possible that a later tectonic compression could have occurred along the same series of faults during a later contraction period in Titans history. ( then squish).
-Mike
Posted by: Juramike Sep 4 2007, 03:58 PM
A hypothetical sequence showing Ganymede-style grooved terrain formation and subsequent evolution on Titan starts below:

|

|

|
The first slide shows a base map of Titan. In the second slide, hypothetical tectonic ridge structures are shown that have been extrapolated, interpolated, and inferred from a base map of Titan. (Some ridges in the north polar and temperate regions that have been recently observed are not shown on this diagram. These seem to reinforce the overall pattern shown here.)

|

|
On Ganymede, downdropping and infilling by cryomagma was proposed for regions of the grooved terrain. (Precedent for Ganymede: Schenk et al Nature 410 (2001) 57-60. Flooding of Ganymedes bright terrains by low-viscosity water-ice lavas. Pay-for article, abstract http://www.ncbi.nlm.nih.gov/sites/entrez?cmd=Retrieve&db=PubMed&list_uids=11242037&dopt=Citation). This may have also happened on Titan in some regions. The diagrams show a gross oversimplification: the downdropping and cryomagma infilling may have occurred over many periods and in many regions in a complex manner, including regions not indicated in the diagram.

|

|
In the next two diagrams, regionalized upwarping raises the topography of some of the ridge structure. This could be a gentle upwarping (example: Adiri), or it could be destructive (example: Xanadu). The tectonic faults active during extension are now reactivated during compression. The compression could result from either squeezing/expansion of upwarping regions, downwarping due to neighboring upwarped regions (buoyancy like proposed for Tharsis bulge on Mars), or from an overall contraction of Titan due to cooling of lower high-pressure ice phases. It is the resulting compression during this phase that squishes many of the older Generation III and Generation II circular features (putative impact craters?) observed in the basins. This compression may still be ongoing. (Stuff to think about when buying land on Titan).

|

|

|
The next diagram shows a map of Titan overlaid by the tectonic ridge and upwarped material features. As described previously, atmospheric chemistry products washed out by seasonal rains bring materials down into the temperate and polar regions. These partially cover and obscure any downdropped temperate and polar basins and partially bury tectonic ridges. The T28 RADAR swath has an example of tectonic ridges that have been eroded and partially buried so that only the highly fractalized ridge tops peek through the organic shizzle.
This is the same resulting end state as described in a previous post in the Equatorial Sand Seas thread, post 152 (link to post http://www.unmannedspaceflight.com/index.php?s=&showtopic=4177&view=findpost&p=95024). The predicted spectral characteristics resulting from the hypothetical sequence described above should also be similar.
-Mike
Posted by: stevesliva Sep 4 2007, 04:06 PM
Regarding the elliptical cryovolcanic regions overlaid on the Titan map... they'd be more trapezoidal on the Mercator projection you use, at least at higher latitudes.
Pretty cool ideas, though! Now for me to go back to lurking in this thread.
Posted by: Juramike Sep 4 2007, 04:09 PM
The following diagrams illustrate a regional example of a hypothetical Ganymede-style grooved terrain formation sequence on Titan as seen from a side view of the Ching-Tu Equatorial Sand Sea basin.

|

|

|

|
In the first slide, the ice crust surface is cracked during the initial expansion phase. The cracks could form and propagate as cycloids formed by diurnal tidal stresses. (Like on Europa: for a diagrammed example see Dancing monkey post in the T28 (April 27, 2007) thread, post 46-47, link http://www.unmannedspaceflight.com/index.php?s=&showtopic=4071&view=findpost&p=95643). These cracks could be the initial underlying pattern as the extensional necking begins to occur during Titans crustal expansion. Downdropping and infilling of cryomagma follows in some regions. Next, upwarping gently raises the ridge pattern.

|

|
Then, a compression, caused by either squeezing/expansion of upwarping regions, downwarping due to neighboring upwarped regions, or from an overall contraction of Titan due to cooling of lower high-pressure ice phases (all three possibilities are shown in the slide) reactivates the earlier tectonic faults and causes an overall squish of the basin.

|

|
Erosion of ridges causes dark blue ice sands to be deposited in the basins. This is followed by the deposition of bright material. The bright material is then eroded/washed/modified away from areas inundated during hydrocarbon flood events. This leaves bright material only on areas not flooded by methane seas (or flash oceans).

|
Finally, dune sands blow in and obscure the basin ice sands.
The overall sequence is:
1) Cracking
2) Extensional necking Ganymede-style grooves (Stretch)
3) Downdropping, cyomagma infills
4) Regional upwarping
5) Compression (Squish)
6) Ice sands erode
7) Bright stuff deposition
8) Flood removes bright stuff from basins
9) Dune sands blow in

|
The last slide shows the end-stage of this hypothetical sequence and compares it to an ISS image of Ching-Tu and Adiri recently released (PIA08995).
-Mike
Posted by: Juramike Sep 9 2007, 10:32 PM
I played around with the W Quivra mosaic.

|

|

|
Being naturally anal, I spent some time lining up my W Quivra RADAR mosaic with the ISS Mosaic (PIA08352).
I picked a few key domes and protuberances (peninsulas) and lined things up. The key ice domes I used to make the correspondence are lit up in green, and the key bumps and protuberances along the western shore are identified by orange arrows.

|
Finally, I put in pretty purple grid lines to match up the mosaics help pick out corresponding features:

|
One thing that is curious is that some of the features do not line up the way one would expect. For example, the "bay" to the northwest of Coats Facula does not match up perfectly with the ISS light/dark boundary. (But neighboring features do, like the southernmost immediately to the west.
The key to figuring all this out is to realize that ISS and RADAR give complementary and (and it seems on Titan) independent information.

|
ISS (on Titan) seems to correlate to altitude and "stuff" deposition. At least in the Equatorial Sand Sea basins, bright is high, dark is low.
RADAR gives information on surface roughness and porosity. Bright is rough, cobbly, angular, sharp reflective or porous materials, while dark is smooth, muddy, or swampy.
Being porous, it is also possible that any cryopumice would also have a brighter RADAR signal.
-Mike
Posted by: Juramike Sep 10 2007, 03:34 AM
With the W Quivra set of RADAR-ISS correlation images, I zoomed in on a few detailed regions.

|
The first region shows typical RADAR-dark, ISS-dark streambeds in N Quivra. Dark streambeds seem ho-hum typical all over Titan. They have been seen in polar regions, in the equatorial regions (even in the basins), and on Xanadu. These features are indicated by blue arrows. [The red arrow points to a distinctive pattern I used as an additional reference in this region of Quivra].

|
A slightly atypical pattern is a RADAR dark but ISS bright region. This is indicated by the green arrow in the graphic. I would guess that this would indicate a smooth upland area, such as a highland swamp or prairie. (Like an alpine meadow, or deer pond). This feature has smooth edges and looks like a basin, but is ISS bright so it must not have been inundated during the last flood event. [Maybe this was an embayment from an earlier, higher, flood event?]. If I had to guess, I would suspect that the drainage of the whole stream system is to the North, into the bay directly to the north of the landmark red-arrowed feature.

|

|

|
The next area shown is of the bright-center dark halo object lying at the extreme NW tip of Quivra. This is the evil eye of Quivra. The central eye (yellow line) appears surrounded by a thicker semicircular wall. The central dome of this feature is RADAR-bright, and ISS bright. From the diagram in the post above, this implies that it is above the last inundation level, and that the materials are either rough, or porous.
The inner and outer edges of this wall are indicated by a red dotted line. This feature is still bright by ISS, thus above flood level. But RADAR shows that the wall is much less pronounced, possibly either eroded and smoothed, or made of less porous materials. The wall is incomplete on the W side, having been breached and possibly eroded. Changes in dune sand pattern indicate that there is something under the area that fits the oval pattern. This can be seen in a zoomed area and also seen in a negative contrast image.

|

|
There also appears to be a bright ring further out (purple), with a sharp ridge seen by RADAR.
There is a cute little multiring feature superposed on the SW part of the outer wall (red lines) of the evil eye of Quivra. This is easier to see in the RADAR image, but is correlated by similar patterns in ISS (bright areas, breach on the W side). This feature looks just like a miniature version of the evil eye but is not squished. (Thus, must be younger than the Evil Eye feature) This fits the overall hypothesis of the Evil Eye being an older impact feature, which was compressed,degraded, and breached (then hit by another impactor).
One interesting observation, the central domes of the bright-center dark halo objects appear very uniform by RADAR and ISS in the Equatorial Sand Sea basins. There doesnt appear to be much erosion. Compare this to the seemingly younger crater rims, like Guabonito (a Generation I object). Does this imply that the domes are still rising, or are they strangely resistant to erosion?
Cinder cones and other porous materials allow liquids to percolate right through. (Hmmm. Remember those dark channels around the base of Sinlap and Ksa?) Maybe the RADAR bright domes are made of porous materials?
-Mike
Posted by: Juramike Sep 10 2007, 03:46 AM
In the third region diagramed in Quivra, there is a huge difference seen between ISS and RADAR images.

|
It appears that the semicircular dark blue ice area doesnt seem to line up very well with the bright center region of Coats Facula.
[Im really starting to suspect this was a double-hit, with the first impact lying in the center of the blue ice sand bay. The second impact pretty much obliterated the bright center portion of the first initial impact. This was probably a lousy example to use for this type of feature.]
In the blue ice sand bay, subtle shelves can be seen by looking at slightly brighter lines in the RADAR image. These correlate very well to bright-dark boundaries in the ISS mosaic. Yet the northwest portion of the of the bay area has a very smooth RADAR outline of an embayment that is ISS bright indicating this was above the last inundation level. What gives?
One possibility is that this area was inundated eroded, smoothed, during an earlier ocean event. Then it was painted by bright stuff, and the next flash ocean level was lower, leaving the earlier bay high and dry. (A Hanging Bay?)
There are many bright streambeds that drop into the blue ice sand bay, unfortunately these dont show up in the ISS image.

|
Further to the E, there is a nice RADAR bright embayment that correlates with an ISS dark embayment. This is seen clearer in the zoomed region. RADAR-bright streambeds spill into the bay. In the bay, we see RADAR bright materials, but it is ISS dark, indicating that it was below the last inundation level.
These streambeds and bays are seen in the ISS image as dark, thus lacking bright deposited material. This implies that the material in the steambed and bay is what is making the RADAR signature, whether it is rough/angular, or porous. This is very similar to the pattern seen else where on Titan: where rapidly eroding material (not obvious here) --> bright streambeds --> bright embayed material in RADAR darker basins. Could this be cryopumice eroding off Quivra?
-Mike
Posted by: Juramike Sep 10 2007, 04:09 AM
Here is a JPEG of the W Quivra Mosaic only (no starfish-thingy):

|
And here is a JPEG (lower resolution) of the W Quivra RADAR mosaic with the ISS Mosaic:

|
And here is a JPEG of the W Quivra RADAR mosaic with the ISS mosaic with the pretty purple correlation lines to help reference features in both images:

|
Enjoy!
-Mike
Posted by: Juramike Sep 14 2007, 11:22 AM
N Fensal RADAR Mosaic

|
I created a mosaic of intersecting RADAR swaths in the Fensal Equatorial Sand Sea basin.
These include portions of: T28, T25, T3, and Ta (that's Si-Si the Halloween Cat in the upper left corner).
[Aligning Ta took about an hour to get right.] I also placed this over the ISS mosaic of the Fensal region.

|
I also aligned the RADAR sections with the ISS images and put in pretty purple gridlines.

|

|
Enjoy!
-Mike
Posted by: Juramike Sep 15 2007, 01:30 PM
N Fensal RADAR Mosaic with Lat/Lon lines included (yellow lines):

|
(There might be some distortion of grid up north)
Enjoy!
-Mike
Posted by: Juramike Sep 17 2007, 12:17 AM

|
Here is a section of the N Fensal RADAR mosaic showing three cryovolcanic regions: Omactl Macula, Elpis Macula, and a putative cryovolcanic pancake dome region to the W of Omactl Macula.

|
Omactl Macula (pronounced like a Valley-girl pronounces Omigod!?) shows up extra dark in ISS. (see post 75 in this thread for a discussion - link here). It looks like a black stain spray painted onto the surface. So it could be deposited on top of the bright material. Thus the ISS bright = high/ISS dark = low rule in the Equatorial Sand Sea basins wouldnt apply. This area could be reasonable elevated. By RADAR it is dark, so pretty smooth. It could be smooth materials that had been coughed out of a vent and blown downwind from Titan. (What kind of materials? Ices, or organics?). [Is that bright spot the actual vent?].

|
Further to the W are two features that are ISS bright (so higher in altitude) but are RADAR dark with a ring of bright material around it. (I propose the name Whtevr Facula named after the Slacker god of ambivalence). These two features have a a corona-like appearance. This could be a pair of Ganesa-style cryovolcanic pancake domes. The central blobby shapes are RADAR dark, but have bright material eroded around the margin: rapid eroding thing--> rapidly -->bright streambeds-->bright embayed material. Check out the mountain immediate to the NE of Whtever Facula and look at the alluvials coming off the E flanks. (To the NW appears to be a bright-center dark halo object).
The radiometry plot of T3 is shown in Figure 4 of the radiometry article by Paginelli et al. (Paginelli et al. Icarus (2007) doi: 10.1016/j.icarus.2007.04.023 Titans surface from Cassini RADAR SAR and high resolution radiometry data of the first five flybys.). In this figure, the blob corresponding to the RADAR dark portion of Whtevr Facula has a Tb of around 85 K (light brown in the figure). In the same figure, the RADAR-bright margin has a much lower Tb, closer to 73 K (light blue in the figure). For the margin material, this is about the same brightness temperature as Sinlaps apron.
It is also similar to the brightness temperature pattern seen for Ganesa Macula in Ta (figure 3 in the article). The dome portion of Ganesa Macula has a brightness temperature just under 80 K (hazel) while the cryopumice ring appears to have a lower brightness temperature around 73 (light blue) near the margin, but much lower where it has collected.
The anabranched delta near Menrva has the lowest brightness temperature about 65.
It seems the brightness temperature can be useful for spotting more recently eroded material in the Equatorial Sand Sea basins. The color coding really helps pick out patterns. Materials with a brightness temperatue <75 (light hazel to blue in the text) arefresher with the really fresh stuff being light blue to dark blue.

|
The T25 RADAR swath also passed over Elpis Macula. The ISS image barely discerns Elpis through the muck (probably a light coating of deposited materials). But the RADAR shows a dark irregular inkblot with four RADAR bright tiny features that indicate finer structure inside the bright objects (brighter ring, central dark point?). One possible speculation is that this is a cryocindercone field and the dark material is low-lying cryo-flood basalts. The bright tiny structures being the putative cryocindercones.

|
Further up N of Elpis Macula, there are some RADAR dark irregular circular features with a RADAR bright margin (shown above). Many seem associated into groups, clusters, or chains. These might be either lakes, cryovolcanic domes/calderas, or geyser pits. The one in the lower left of the image seems to have an extended outer margin or platform: it kinda resembles Sotra Facula.
-Mike
Posted by: Juramike Sep 18 2007, 12:26 PM
There is an apparent partially buried bright center dark halo object located at the intersection of the Ta and T25 RADAR swaths at [42N, 21W]. The bright center has the same characteristics (uniform tone, oval shape) of the other described bright center dark halo feature, except the dark halo is not evident.

|
Its squish vector (20 degrees) and compression factor (25%) also put it right in line with other described bright center dark halo features in the FQAAS supra-basin. This would place it in the Generation III features.
The estimated coating of organic deposition is 200 m deep. Yet we still see the bright center. That implies that its elevation above the surrounding peneplain is at least 200 m. Interestingly, the dark halo part or the putative outer rim is not discernable. These must be either eroded below 200 m, or were never above this level and is now buried in organic schizzle.
Generation III features are hypothesized to be pretty old. The fact that this object shows no sign of stream erosion across the center is spooky. It is either rising to compensate, or it is resistant to erosion either super hard, or super porous.
-Mike
Posted by: Juramike Sep 19 2007, 12:49 AM
In the T25 RADAR swath (and just missed by the T3 RADAR swath) is a funky little pattern. I call it "The Box". It seems like a little squarish internal basin bounded on four sides by lobate bulges intruding into the basin. Spaced around the feature are what appears to be pits or craters.

|
To the SW of this feature is something that might be an older larger bright center core. To N is a broad region of "rotten terrain" that might be a really, really old, eroded and corroded bright center core.
-Mike
Posted by: Juramike Sep 19 2007, 12:37 PM
At the intersection of the T3 and T28 RADAR swaths, there is another area of rotted terrain :

|
Inside the orange box right at the margin between the RADAR-brighter terrain and the dune sea there is a multi-ring feature. This is seen best in the T3 Swath, but is just visible on the edge of the T28 RADAR swath.
There is also a circular crater-looking thingy indicated by a red arrow. Directly to the SW of the little crater-looking thingy and sharing its wall there is a much less distinct multi-ring feature. This might not show up so well in the JPEG image above, check it out better in the T3 RADAR swath downloadable from the TPS (massive thanks to Emily this resource) Cassini RADAR images of Titan website: http://planetary.org/explore/topics/saturn/titan_radar.html http://planetary.org/explore/topics/saturn/titan_radar.html
Throughout the bright terrain, there are small pits and sinkholes. The margin of the bright terrain looks pretty ragged.
(Hmmm....Could it have formed from a series of interconnected sinkholes and weaknesses in the terrain?)
-Mike
Posted by: Juramike Sep 20 2007, 12:17 PM
I think the Coats Facula feature resulted from a double hit.

|

|
With red arrows, I've indicated a possible rim surrounding the RADAR-bright center of Coats Facula. This rim is not complete, possibly having been breached, eroded, and degraded in the southern section.
The dark blue ice sand mudflats do not match up very well to the ISS/RADAR bright center (indicated in yellow). Instead, they seem to match up to a second center, indicated in orange. To the northwest there seems to be a partial arc that lines up with this second center as well (indicated in dark red).I'll speculate that the center indicated in orange was the first strike in this region. It formed the orange circle "bright center" area (now eroded down to nothing more than a blue ice sand mudflat) and the outer rim. After this feature had been squished and presumably eroded the second feature (impact?) formed, raising a new rim, and a distinctive "fresher" bright center area. (In the zoomed-in RADAR image a central pit can be seen, indicated by the yellow arrow).
Superposition indicates that the yellow-centered circle bright center feature is younger than the orange-centered circle feature.

|

|
The squish vector of the yellow circle feature (2nd hit) is at 15 degrees relative to N. This is very consistent with the squish vectors measured on the basis of the Sotra Facula feature. In the RADAR/ISS mosaic of W Quivra I've indicated the Sotra Facula putative hotspot cryovolcano in shades of blue. (Discussed this thread, post 177, http://www.unmannedspaceflight.com/index.php?s=&showtopic=4177&view=findpost&p=96189).
By using the vectors and timing of the Sotra Facula cryovolcano islands, we should be able to arrive at an estimated time of the formation of the second impact. The bright center must have been subject to the same tectonic compression as Sotra Facula, we just need to work backwards until the vector sum is similar.
From this rough analysis, it seems likely that the feature formed around the same time as the first "island" (lightest blue) formed. The vector from the present Sotra Facula to the earliest ghost of Sotra Facula is about 15 degrees. Check it out with a protractor [I used my trusty Silva compass].
The earlier feature (orange circle) has a squish angle of 40 degrees. And it is not squished as much as the younger yellow circle feature. How can this be?
Most likely, the earlier feature was subjected to an eastward perpendicular compression, then the overall 15 degree compression was applied (the Sotra Facula sequence) . Squish a circle in two perpendicular directions and you get a smaller circle. Squish it in only one and you get an oval.
Et voila, the earliest feature was squished in one direction, eroded, then impacted, then subjected to a second squish mostly to the NE but then backing slowly to the NW.
Here are some zoom images (ISS only; ISS+RADAR; younger strike indicated (red arrows = rim, yellow arrows = central pit?); Sotra Facula and drift vectors indicated (yellow arrow = younger strike, orange arrow = older strike)) :

|

|

|

|
So the orange indicated feature may be one of the older bright center dark halo features discernable on Titan (Generation IV?). It has been eroded down to blue ice sands and overprinted by a [relatively] new bright center dark halo feature.
So there are two "eye" shaped features that make up Coats Facula. The one evident by ISS/RADAR and a second, older one more discernable by RADAR (and more subtly by ISS).
-Mike
Posted by: Juramike Sep 21 2007, 05:11 AM
Here are some more eyes on Titan. I strongly suspect that they are old bright center dark halo objects. The center part of the eye is the bright center core, and the thicker outer part of the eye is the squished, breached and eroded remnant of the rim. They seem to have a less modified bright center, but have varying degrees of mangle in the halo/rim area. In the halo area there are dark streambed deposits as well as brighter sand deposits. All these features are subtle, but can be picked out in most of the RADAR swaths. Here are some in T3:

|

|

|
In the pattern at 17N, 52W (left image above) the bright spot inside the eye just to the W of the bright center is itself surrounded by a small ring of dimmer gray material it will show up better in downloaded RADAR swath. In the feature t 15N, 33W (middle image) the central part itself is slightly pitted and is starting to look rotted.
At 15N, 30W, just to the W of Sinlap, is another eye in T3 (right image). This was first found by looking at figure 4 in the radiometry publication by Paginelli et al. In figure 4 a lighter blue eye can be discerned from the brownish hazel background, this was late correlated to the black and white RADAR image to find this feature. (There are other eye features can be picked out in this figure and then traced back to the black and white radar images the color contrast really helps). The entire feature appears ragged and rotted, and is part of a much larger pattern of rotted terrain. There are many pits both in the eye feature and in the surrounding terrain. [For reference, the cute little multi-ring feature of T3 and T28 is indicated by the orange box. ]
-Mike
Posted by: Juramike Sep 21 2007, 12:54 PM
At the intersection of the T3 and T25 RADAR swaths there are features that look transitional between bright center dark halo features and large roundish areas of rotted terrain. The busy graphic below shows four these features in context. (The feature with the ovals indicated in orange and red at [15N, 30W] was described in the post above.)

|

|

|
The feature at [12N, 35W] shows up as nice and bright and fairly circular by VIMS and ISS (middle image). But even in ISS, it is clear that dark (lower) channels are visible. Fortunately, the T25 RADAR swath partially passed over this feature. By RADAR, it is not a uniform bright center - there are apparent pits and mottling in the RADAR image. Could this be the first stage of internal rot of the bright center dark halo features?
Zooming out, the large feature at [15N, 33W] looks almost like a really, really eroded and rotted smaller version of Menrva (right image). Out at the blue line, one can imagine that this was the extent of the rim of the crater. The area inside the orange dashed line would correspond to the bright center inner dome region. In this region, pits and holes are evident. Towards the W, the terrain appears increasingly rotted out. It looks like a cross section of an untreated mailbox post in termite country (Im speaking from recent experience here). Darker lower areas and apparently uneroded mesas are visible. There are also fans of bright material that have been eroded out, possibly indicating erosion of softer revealed materials.
The rotted mesa terrain seems to be the end stage of a bright center dark halo object.
-Mike
Posted by: Juramike Sep 22 2007, 03:58 AM
I put together a series of selected images that shows a possible age progression of a bright center dark halo object from crisp youth to rotten old age.

|

|

|
In the first image of the sequence, we see that at the center is uneven hummocky terrain. There is some erosion here as evidenced by bright stream fans. This must be a dome area since the dark channel flows around the central part. The rim is being rapidly eroded as seen by the complex ravine pattern (in contrast to the central dome).
In the second image, we see a uniform bright center, but the outer rimwall is breached and eroded.
In the third image, the bright center shows some detail (onion-like layering?), but is overall fairly uniform. The rim is breached, eroded, and buried by dune sands.

|

|

|
In the fourth image, the central dome is still intact, but dark streams have cut across the dark blue ice sand mantle margin. The dark streams still flow around the central dome, but the the rim is breached and pretty much unrecognizable.
In the fifth image, the central dome is now starting to show some pits and seeps. The rim is breached.
In the sixth image (E Belet), the pits have grown into larger depressions. The entire bright center is now mottled and beginning to look ragged.

|

|
In the last image, the pits, and depressions have turned into seeps, which have then turned into channels (chasms?) Further erosion has carved out a series of isolated mesas in the extreme W. (A zoom of the rotted central area is shown on the right).
As the bright center dark halo features age, the outer rims seem to be eroded externally (breached, streamflow, Aeolian), but the central domes seem to be eroded internally (pits, sinkholes, seeps, then chasms).
-Mike
Posted by: Juramike Sep 24 2007, 05:05 AM
Could the Bright Center Dark Halo features be made of methane clathrate brought up from the lower crust due to impacts or other events?
Water is an amazing little molecule. It can form an extensive hydrogen bonding network that can make some very interesting chemical species. Methane clathrate is a host-guest molecular complex where a lattice network of water molecules has formed a cage around a molecule of methane.
At certain temperatures and pressures, methane clathrates are the preferred form for a mixture of methane and water (much to the consternation of natural gas rigs in the Gulf). The whole system profits by keeping the water intermolecular H-bonding network as well as including methane C-H dispersion interactions with the water cage.

|
Methane usually forms class I clathrate structures in water (above). There are several types of cage structures in the unit cell of methane clathrate. The most common cage structure is shown below. It is the 5(^12)6^(2) complex: 12 pentagons, and 2 hexagons on top and bottom (water molecules in the back are not shown in the graphic).

|
At high temperatures, clathrates break down and release methane and water from the complex.
At high pressures, above 15E3 bar, the host-guest complex breaks down and methane is released.
At low pressures, the methane clathrate breaks down as well. This point at a given temperature is referred to as the dissociation pressure. It is temperature dependant. At 100 K, the dissociation pressure of methane clathrate was found to be 2.1E-5 bar. At 82K, the dissociation pressure was measured to be 2.1E-7 bar.
On Titan's surface, the temperature is 95K and the methane pressure is 7.5E-2 bar. This is well inside the stability zone for a class I methane clathrate.
So thermodynamically, methane clathrates should be stable on Titan's surface.

|

|

|
According to a formation model for early Titan (1,2,3,4),:
(1) methane clathrate was formed in Saturn's gaseous nebula. These chunks accreted and grew into Titan.
(2) Early on, the mantle differentiated, but the core did not. So there was an outer ice (1) crust, ocean, a rock layer, then an undifferentiated core. The undifferentiated core contained rock, ice, and methane clathrate.
(3) But at the high pressures of the core (>15 kbar), the methane clathrate would break down and reform as a mixture of high pressure ice and buoyant methane (probably as a solid). [Alternatively, under high pressure the class I methane clathrate might reform into other classes of buoyant methane clathrate structures which could then rise to the lower crust. (5, 6, 7)]
(4) The resulting core overturn allows methane to penetrate the rock and percolate through the subsurface ocean (in some form: solid, supercritical fluid, gas). Once through the ocean, it will hit the bottom layer of the ice(I) crust.
(5) As methane penetrates into the lower part of the ice(I) crust it will form a layer of methane clathrate(4).
At the "tiny" level, the transformation process begins at defects in the ice crystal structure and propagates inward into the ice lattice. This forms a clathrate outer rind on the ice grains as clathrate formation migrates inward. The formation of a methane clathrate is exothermic releasing 18 kjoules/mol. (6).

|
As ice is converted to methane clathrate under certain conditions, it changes its structure (8). It turns into a sponge-like meso- and macro-porous clathrate structure. The pore sizes measured by Kuhs et al were about 100-400 nm. This material is overall less dense than ice, with a porosity of up to 40% and a density of 0.5 0.7 g/mL.
As the authors in the Kuhs paper state, "We have no evidence that gas hydrates alter their porous structure when stored over periods of several months at conditions of thermal stability." Rephrased: What starts porous, stays porous.
The authors also state: "From the visual inspection of our electron microscopic images of mesoporous CH4 hydrate we estimate a specific surface of 50-80 m2/g. It is very likely that this surface is covered with adsorbed gas molecules of the guest species."
Down deep in the crust there may be a layer of porous clathrate containing vesicles of methane. Could this be the source and definition of cryopumice?
In a recent study (9) methane clathrate was found to be 20 times stronger than ice(I), and this strength increases at lower temperatures. In addition, it is a better thermal insulator than ice. (Under the studied conditions the authors did not observe porous structures). The authors of this study further state that "if [a layer of clathrate exists on Titan's surface], the thermal structure of that moon would be profoundly different from those ice/rock moons that do not contain the [clathrate] layer." They also state that "the presence of a planet-wide, 100 km thick layer of very strong, thermally insulating methane hydrate must have a first-order effect on the evolution of Titan."
So it might just be the clathrate underlayer that helps makes Titan's geology unique.
If the methane clathrate underlayer is up to 40% porous, it's density would be 0.5 0.7 g/mL. That would be less dense than ice(I) layer above (0.8-0.9 g/mL). That would make the crust intrinsically unstable.
Any impact that penetrated enough of the outer ice (I) layer could allow the less dense clathrate material to bulge upward and ascend to the surface. In addition, this may allow subsurface ocean fluids to also rise, circulate, and segregate and emplace organic and other species in veins similar to quartz and ore veins in terrestrial rocks.
This would make a dome of strong (= erosion resistant?) methane clathrate. This would still have the 40% porosity of the parent material. Due to volume scattering, we would expect that these materials would have a lower brightness temperature (Tb) in radiometry compared to other terrain. [From methane clathrate's low dielectric constant of 1.8 [compared to water ammonia ice at 4.5, or water at 3.1] we would expect the brightness temperature to be pushed higher]. This could explain why many of the bright center dark halo features show up with lower brightness temperature in radiometry (10). Alternatively, perhaps when the bright clathrate domes pop through the surface, the weaker methane vesicles or defects expand and break up the dome into a series of cobbles. So instead of a Stone Mountainstyle dome, we have a giant dome-shaped pile of cobbles.
A cobble-pile would allow methane rains to percolate through the system, and creep out the base. There would be no strong runoff, thus few ravines carved into the surface of the dome.
Over time, structural weaknesses at the base of the clathrate dome would be widened either due to chemical action (dissolution of emplaced veins of organics) or by physical action of hydrocarbon material flowing through the pore/crack/weakness spaces. While water has a very low solubility in methane solvents ( 5E-13 mol/L), veins of emplaced ammonia hydrate or easily dissolved organics might be dissolved out to form the subterranean channels in the structure. For reference, the solubility of calcite (limestone) in water is 5E-4 mol/L while the estimated solubility at 95K for benzene in pure methane is roughly the same value 5E-4 mol/L (11, 12). The solubility of ammonia (NH3) was estimated to be at the same order of magnitude 5 E-4 mol/L (12)
As stated by Lorenz and Lunine "crustal material containing ammonia (ammonia dehydrate?) may well be more susceptible to chemical erosion than pure water ice".(11)
Chemical and subsurface physical erosion would cause the dome to rot from inside and create pits and sinkholes as it finally degrades. The end result being rotten terrain as exemplified in the T3-T25 intersection [15N, 33W]. This would be very similar to a certain rock strata on Earth: hard and resistant on the outside, but can be eroded (chemically, then physically) on the inside.
So while the caverns "measureless to man" (13) may start out at the nanometer scale or as emplaced veins of easier-to-erode organics, they may eventually enlarge before eventual collapse.
While the bright center dome is resistant to erosion, the outer rim is not. The rims often appear breached by fluvial erosion. In addition, streams quickly carve into the rim, as evidenced by the stream network rapidly eroding the inner rim of Menrva (while the dome is not heavily eroded). In addition, the rim displays a more prominent and broader dark blue ice sand mantle, while a mantle around the bright center is not evidenced. Shown below is a diagram showing a putative evolution sequence as well as example images plucked from the RADAR data:
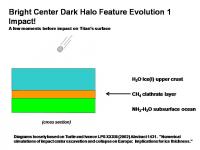
|

|

|

|

|

|

|
The radiometry data, the RADAR brightness, the erosion of bright material, and the observed stages of degradation are all consistent with Bright Center Dark Halo features being erosion-resistant domes of methane clathrate brought up from the lower crust, most likely following an impact event.
-Mike
References
(1) Lunine and Stevenson, Astrophysical Journal Suppliment Series 58 (1985) 493-531. "Thermodynamics of Clathrate Hydrate at Low and High Pressures with Application to the Outer Solar System." (Pay for article, abstract here: http://www.journals.uchicago.edu/cgi-bin/resolve?id=doi:10.1086/191050). Diagram made from melding Figure 2, Figure 8, the experimental values from Table 2, and references therein.
(2) Lunine and Stevenson, Icarus 70 (1987) 61-77. "Clathrate and Ammonia Hydrates at High Pressure: Application to the Origin of Methane on Titan." Pay-for article: abstract here : http://www.osti.gov/energycitations/product.biblio.jsp?osti_id=6238353
(3) Lorenz and Mitton "Lifting Titans Veil" Cambridge University Press, 2002. Diagrams in slides adapted from Figure 3.5 in text.
(4) Tobie et al. Nature 440 (2006) doi: 10.1038/nature04497. "Episodic outgassing as the origin of atmospheric methane on Titan." HTML available at: http://64.233.179.104/scholar?hl=en&lr=&q=cache:9Ekp-JmvtikJ:www.geo.umass.edu/courses/geo892/nature04497.pdf+Tobie+Titan
(5) Chou, PNAS 97 (2000) 13484-13487. "Transformations in methane hydrates". (Describes RAMAN spectroscopy C-H stretches diagnostic for the different methane clathrate phases). Article freely available here: http://www.pnas.org/cgi/reprint/97/25/13484
(6) Choukrun and Grasset Geophysical Research Abstracts 8 (2006), 05617. "Stability and structure of methane clathrate hydrates under pressue: implications for Titan's cryovolcanism." Abstract freely available here: http://www.cosis.net/abstracts/EGU06/05617/EGU06-J-05617-1.pdf
(7) Loveday et al. Nature 410 (2001) 661-663. "Stable methane hydrate above 2GPa and the source of Titan's atmospheric methane." Pay-for article: Abstract available here: http://www.ncbi.nlm.nih.gov/sites/entrez?cmd=Retrieve&db=PubMed&list_uids=11287946&dopt=Citation
(8) Kuhs et al. Geophysical Research Letters 27 (2000) 18, 2929-2932. "The formation of meso- and macroporous gas hydrates." (cool electron microscopy pix). Pay-for article, abstract available here: http://adsabs.harvard.edu/abs/2000GeoRL..27.2929K
(9) Durham et al Journal of Geophysical Research 108 (2003) 108, No B4, 2182. Doi:10.1029/2002JB001872,2003. "The strength and rheology of methane clathrate hydrate." Article freely available here: http://www.agu.org/pubs/sample_articles/cr/2002JB001872/2002JB001872.pdf
(10)Paganelli et al. Icarus 2007 doi: 10.1016/j.icarus.2007.04.032. "Titan's surface from Cassini RADAR SAR and high resolution radiometry data of the first five flybys."
(11) Lorenz and Lunine Icarus 122 (1996) 79-91. "Erosion on Titan: Past and Present." Article available freely at: http://www.lpl.arizona.edu/%7Erlorenz/erosion.pdf
(12) Raulin Adv. Space Res. 7 (1987) (5)71-(5)81. "Organic Chemistry in the Oceans of Titan". (Figures 2 and 3 show predicted solubilities for a variety of mole fractions of methane solvent mixtures.)
(13)Emily Lakdawalla, The Planetary Society Weblog, entry for July 26, 2006: http://www.planetary.org/blog/article/00000656/
Posted by: dvandorn Sep 24 2007, 05:33 AM
Jeez, Mike! References? I mean -- this is just an Internet forum, my friend. Really.
However, if you ever feel like you're writing to yourself alone in this thread, always know that the feeling is incorrect. I may sometimes slog through some of your posts, but I have learned a tremendous amount about organic and inorganic chemistry and the great variety of Titanian cryo-ices, and your observations and speculations on how these strange (yet familiar) landforms came to be fill my mind in my spare moments.
You really need to be putting this work up for publication in peer-reviewed journals. It's that well done.
-the other Doug
Posted by: ngunn Sep 24 2007, 10:57 AM
Great post 205 Mike! A couple of queries (not objections).
1/ Methane hydrate seems like a pretty obvious material to look for on Titan, but I note that quite a few of your chemistry-related references predate most or all of the Cassini-Huygens data. Is there any direct evidence for it yet? Would it be stable at the surface or would it de-gas leaving porous ice?
2/ You propose meteorite impact as the probable trigger for formation of these diapiric dome features. I see no reason why not, but is there a positive reason why so? Are they old enough to fit with expected cratering rates?
Posted by: Juramike Sep 25 2007, 03:15 AM
Methane clathrate should be physically and chemically stable on Titans surface.
Physically, the porous methane clathrate should be stable on the surface of Titan around the current atmospheric pressures and temperatures. Only if areas got cooked above 300K would it risk breaking down. (There was a weird effect of self-preservation noted by Kuhs, where clathrates will form an ice rind and can exist outside their stability field. This was unsystematic and was noted only for non-porous methane clathrates.)
Chemically, the methane is not bound to water, it is only weakly interacting through electronic dispersion forces. In fact, the methane in a class (I) clathrate is very chemically isolated. It will act like it is trapped in a matrix. Trapping high-energy molecules and reactive intermediates in matrices is a great way to isolate and study them, since they cant react with other molecules. Basically, the poor little methane molecule is locked away in its little room with nobody to play with. I was not able to find much literature regarding photochemistry of methane clathrate, but I would assume that the normal photochemical degradation of methaneàethane probably wont happen. The radicals formed will be longer lived due to their relative isolation, and most likely the two radicals (H* and CH3*) will either reform methane or will react with the walls of the water matrix to form methanol and hydrogen gas. (Under Titans current haze blanket, surface photochemistry is probably not going to happen anyway.)
For the most part, methane clathrate acts spectroscopicaly like methane + water.
To get direct evidence for a clathrate structure, it is necessary to get up close and personal. In situ analysis of an isolated sample by RAMAN spectroscopy, neutron diffraction, or NMR would be the best way to confirm a clathrate structure. These methods would probe the subtle differences between free range methane, and methane surrounded in its water cage.
The one possible distant detection method is determination of the dielectric constant by radiometry (which Cassini is doing). But theres a catch, the volume scattering effect due to putative pores might override the effect of the dielectric constants on RADAR emissivity. [Pure hydrocarbons dielectric constant is about 1.8, water is about 3.1, and methane clathrate is expected to be a statistical ratio between the host and the guest so it should average closer to 3 (class I clathrates have about 1 molecule CH4 to 5.75 molecules H2O] So unfortunately, radiometry won't be able to provide conclusive rock-solid (sorry!
) evidence of surface composition.If these are not due to meteorite impacts, then we need to come up with a Titan-unique weird process to move these Titan-unique weird materials up to the surface. Having these due to meteorite impacts seems to remove one level of weirdness.
The size distribution of the larger features is more than ample to fit what might be expected for the age of the solar system. And this is even before taking into account those features that might have dissappeared after being mangled and erased by tectonics, erosion, and burial by material deposition (from stuff falling out of the atmosphere in the middle and higher latitudes, from dune sands and sediments in the equatorial zones.)
The different tectonic compressions (squishes) of these features imply that these may have formed over a long period of Titans drift history. (Course, the drift history was partly implied from these features, so thats kind of a circular argument but Sotra Facula provides independent evidence for the assumed tectonic drift/compression [this thread, post 177]).
However, one argument against meteoric impact is that several of these features appear to be doubled up. Many of these features seem to have a similar same-size circular feature very close by, but they have different squish vectors and compression ratios: implying that they formed at different times. Having two features the same size in pretty much the same spot but separated by different times is very spooky and seems unlikely. (Example twins: Coats Facula (post above), the evil eye of W Quivra, the T8 E Belet feature, and Elba Facula.)
Another argument against these being impacts is the observation that several of the bright center dark halo features recently noted in the posts above are rather small (120 km or so). These are aboout the same size as normal craters like Sinlap or Ksa, and are much smaller than the previously proposed >300 km limit proposed earlier in this thread. So why do some smaller impacts make small bright circle dark halo features and some make normal central caters? Perhaps the smaller bright center dark halo features (which all seem eroded and squished) formed when the crust was thinner or perhaps there are large regional differences in crustal thickness .
Im struggling to come up with an observable that could differentiate between an internal-only process and an impact-generated process.
Any ideas?
-Mike
Posted by: dvandorn Sep 25 2007, 06:15 AM
Well -- it occurs to me that the first part of your post, Mike, bears on your final question.
If methane clathrates are common surface materials, and if they contain chemically energetic methane within a water ice matrix which is normally stable up to about 300K -- what happens when a meteor clobbers such a surface, generating temperatures far in excess of 300K?
How energetic does the liberated methane become under superheated conditions? And recall, you have a range of heating regimes as you increase distance from the impact point.
You'd get far different chemical reactions at the impact point (where kinetic and thermal reactions would dominate) than you would hundreds of meters, or tens of kilometers, away from the impact point. I can imagine a heat pulse being transmitted by Titan's think atmosphere in amazing fashions, increasing temperatures to a point where methane molecules are not vaporized into constituent gases but *are* explosively liberated from their quadrillions of icy prisons. The hydrogen and oxygen liberated by kinetic and thermal reactions at and close to the impact point would be available to react chemically with the methane, at least in some mixing zones.
Also, don't forget that the impact heating isn't the only heating you'll be dealing with when a meteor strikes. A meteor large enough to reach the surface will heat a slice of the atmosphere (I would have said "column of air" but meteors are more likely to enter obliquely than vertically), and some of that superheated air will be accelerated by the meteor and wash down onto the surface all around the impact site. It may not be a huge effect, but it could affect the impact effects with which it interacts.
I'm not saying there would be massive explosions from small impacts -- I *am* saying that we could see effects that build and shape landforms in ways we've never seen before. I'm tempted to think that the "rotten" terrain you've noticed, Mike, may be the result of these kinds of effects.
Just playing gedankenexperiment, here... but I think it's worth analyzing how a surface composed at least partially of methane clathrates would react to meteor impacts.
-the other Doug
Posted by: ngunn Sep 25 2007, 08:48 AM
Mike, thanks for those very full replies. O'Doug: very interesting observations too.
It's the 'squishing' that makes me wonder if some of these features ever were actually circular. If another Titan-only weird process is required that would not surprise me. A substantial atmosphere and the abundance of liquids at and near the surface could well have major implications for the behaviour of the solid crust. Witness the role of water in terrestrial plate tectonics.
Posted by: belleraphon1 Sep 25 2007, 11:58 AM
Mike...
WHOA!!!!! I'll need to take a vacation just to read all these posts.... incredible work, sir.
And at the risk of getting burned for making an observation BEFORE reading all the posts, (but I'll do it anyway, old age has it's benefits)...
As far as meteor impacts being the generator for diapir formation ..... remember, if there IS an ocean of water/ammonia under the crust, there is something like a 178K temperature difference between the ocean and the surface.... depending on the crustal thickness and composition, wonder if this is enough to initiate
slow overturn of the crust, and density differences that can start a blob of hotter material heading for the surface.
Craig
Posted by: ngunn Sep 25 2007, 02:40 PM
Has anyone read all the posts?
Posted by: dvandorn Sep 25 2007, 03:28 PM
Umm... yes.
-the other Doug
Posted by: brellis Sep 25 2007, 03:32 PM
-the other Doug
Do you work for the Post Office?
Posted by: dvandorn Sep 25 2007, 03:34 PM
Nope! Just a voracious reader, when it comes to topics in which I have an interest.
-the other Doug
Posted by: The Messenger Sep 25 2007, 05:26 PM
Yes...I appreciate Mike's work, reserve comment. Waiting for specular reflection information, also information upon the refractive index; possibly limb studies, anything that can add veracity to this analysis, or Sagan's 'tholinized' surface. Mike's identification of crater-like features, and the processes that destroy them is interesting. There are a lot of 'cat scratch dunes'; big dunes; so burying many craters with sand in geological timescales is an acceptable scenario, some of the small ridges could easily be all that is left from the excavation of large craters, now filled with sand.
Posted by: nprev Sep 25 2007, 07:21 PM
I too have read all of Mike's posts...not saying that I understand all he offers, but dazzled by his interest, dedication, and (let's face it) genius...proud to be a member of a forum that attracts world-class talent!
Keep on truckin' Mike!!! Seriously, though, dude, get it all together into a paper (or two, or three) & get published. You deserve the recognition, and the scientific community requires the knowledge you've eked out of this data for planning future exploration. You are doing something truly admirable, and I'm sure that I'm speaking for most if not all of us when I say that we support you, and want you to reap the benefits of your hard work. Thanks so much for so graciously sharing it with us as it unfolds!
Posted by: ngunn Sep 26 2007, 10:20 AM
OK- for the record I have enormous admiration for Mike's efforts, and I have read most of his posts, with varying amounts of attention to detail depending on the topic and how much time I can spare. For the moment, though, I am keeping an open mind about many of the features and processes, past and present, that he is seeking to explain.
Posted by: MarcF Sep 26 2007, 06:35 PM
Hi Mike,
Indeed really impressive !!
I really like your work, even if I have to confess that I have sometimes problems to follow you and that it's a lot of speculation. You should at least create your own website (in addition to posting here) where you can store and organize all your stuff in different topics (dunes, mountains, rivers, impacts, ...). And of course, why not trying to make one or several publications ?
Marc.
Posted by: rlorenz Sep 29 2007, 02:29 AM
Keep on truckin' Mike!!! Seriously, though, dude, get it all together into a paper (or two, or three) & get published. You deserve the recognition, and the scientific community requires the knowledge you've eked out of this data for planning future exploration.....
Yeah, I'd second that. I dont read through them all in detail, but don't assume, JMike, that the lack of response means no-one is reading them at all. At least some of your stuff is definitely publishable, although of course dealing with
peer review can require patience and a thick skin......you've got a lot of great figures to form the core of some
papers
Posted by: Juramike Oct 11 2007, 12:17 AM
W Belet Mosaic!
Western T8 + T21 RADAR Swath combination on top of ISS mosaic (from CICLOPS and Scalbers map)

|
Large image showing northern extent of T21 trending into "wavy crack" territory.

|
More detailed images focusing on W Belet region. Lat/lon lines in yellow.

|

|
Feature correlation lines in purple.
Enjoy!
-Mike
Posted by: Juramike Oct 13 2007, 05:22 AM
Aaru Mosaic!
T18 (smaller) + T16 RADAR swaths lined up with a few key diagnostic features. (Man, this was really hard! The key is the big ice sand basin downlatitude from the rough carved terrain. There are a few pits and features that line up the two swaths):

|
Putting T18/T16 RADAR with T19 RADAR swath + T8/T21 RADAR Swaths gives us a big overview of the Aaru/Senkyo Mosiac. Lat/lon lines are in yellow:

|
Zooming in to Aaru/W Senkyo (T18/T16 RADAR + T19 RADAR swaths). Lat /lon lines in yellow:

|
Key features used to line up T16 RADAR + T19 RADAR swaths with ISS features. Aaru/W ISS region lined up with T18/T16 RADAR + T19 RADAR swaths. First graphic shows purple correlation lines, second graphic is side-by side correlation with no correlation lines.
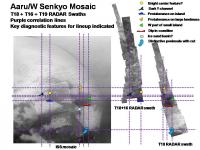
|

|

|
Enjoy!
-Mike
Posted by: Juramike Oct 14 2007, 05:08 AM
Shangri-La and NE Shangri-La Mosaic!
T16 + T19 RADAR swaths were lined up with the Grand Canyon as the diagnostic feature. This can be used a reference when stitching or surfing these two swaths:

|
The Big Shangri-La Mosaic includes T8, T13, T16/T19, and the T20 distant targeted look overlain on the ISS mosaic. Lat/lon lines are in yellow:

|
A zoom of the NE Shangri-La basin is shown below. Lat /lon lines in yellow:

|
Purple correlation lines with the T16/T19 Swath and the T20 targeted distant look. Second graphic shows no correlation lines.

|

|
[Note: the T16/T19 Swaths do not match up well with ISS features. The positions used are approximate. I guessed that the subtle circular feature seen in the ISS mosaic matches up with the single point circular feature in T16. So there is only a dodgy single point linking T16/T19 with the ISS image. Use the position of T16/T19 with respect to ISS mosaic with extreme caution ]
[The T20 distant look is nailed down with multiple features]
Enjoy!
-Mike
Posted by: Stu Oct 15 2007, 06:32 PM
Gorgeous artist's impression of Titan's dunes http://www.christianthrower.com/?page_id=8...
This guy's space art is stunning, I urge you all to go see for yourself. The pic showing the view from inside Herschel Crater on Mimas had me reaching for my swear box...
Posted by: Juramike Oct 25 2007, 03:02 PM
Images of Senkyo arriving:

|
Much of this overlaps the T8/T21 RADAR Swaths!
This is filling in the last major chunks of terra sorta incognita in the Equatorial Sand Seas.
Way cool!
-Mike
Posted by: Juramike Oct 25 2007, 03:50 PM
My Belet-Senkyo FrankenMosaic (probably way distorted)
Some really neat things in there:

|
-Mike
Posted by: ngunn Oct 25 2007, 03:54 PM
Where are you finding those 'new' images Mike? They don't seem to be on the 'latest 500 raw images' page.
Posted by: Juramike Oct 25 2007, 04:05 PM
Search "Target: Titan" and "Observation time: newest".
The detailed areas are on the second page of the latest Titan images. (These are from a distant flyby a few days ago.)
-Mike
Posted by: Juramike Oct 25 2007, 04:35 PM
Some cool features annotated:

|
- S Senkyo craterform (still looks good)
- Interesting dark lines in temperate zones (related to Dancing Monkey feature or Polar Cracks?)
- Dark spot (another Omacatl Macula?)
- E Belet craterform? Very, very low contrast smaller and degraded version of Sliced Carrot (I'd suspected this from earlier images - it's still there in the new images)
With the new images, the previously hypothesized channel (post, this thread) seems more likely. This is only one of a few connections between Belet and Senkyo, so any difference in sea level between the two oceans (when flooded) would either go around the long way, or try to cut violently through the strait.
This could be either due to tidal differences or differential inflow of the two oceans. So at least there is a viable reason for a channel to be there.
-Mike
Posted by: JRehling Oct 25 2007, 06:33 PM
Much of this overlaps the T8/T21 RADAR Swaths!
This is filling in the last major chunks of terra sorta incognita in the Equatorial Sand Seas.
Way cool!
-Mike
Yes! This is a pop-the-champagne moment in my opinion. With the exception of the un-RADARed northern locations that are still in the dark, the basic map of Titan is very close to completion with this set of imagery. One good flyby of the north in the extended mission will almost wrap things up (a few smudgy areas at midlatitudes withstanding). I can almost see that Titan globe on my desk now.
Posted by: ngunn Oct 25 2007, 07:09 PM
Well spotted Mike!
Indeed a most satisfying point in the unveiling process. I too dream of a Titan globe to roll around in my hands . . .
Posted by: Juramike Oct 25 2007, 09:24 PM
I correlated up raw image N00094375 with the T8 Radar Swath.
Here are the key features I used to make the correlation. ("The Sunfish" appears nicely distinctive and useful to line up ISS, T8, and T21):

|
Here are upper lower images of N00094375 and the T8 RADAR Swath at the same scale and all lined up and correlated (pretty purple correlation lines coordinate features):

|
Enjoy!
-Mike
Posted by: hendric Oct 26 2007, 03:57 PM
Has anyone tried blink comparing the overlapping parts of the radar swaths for any changes?
Posted by: rlorenz Oct 27 2007, 12:57 PM
Note that a change in appearance does not necessarily mean a change in the surface.
Radar is particularly sensitive to look azimuth and incidence angle, so you really can't conclude
anything without taking the geometry, number of looks, and resolution of that part of the
swath (these properties vary along the swath, but looking at the jpgs alone you wouldnt know
about them) into account. All the relevant data are recorded, pixel by pixel, in the BIDR archive
products. There are one or two possible changes we (the radar team) are investigating.
Posted by: hendric Nov 1 2007, 02:37 PM
Ralph,
I assumed everyone here knew that, and to take any changes with a giant grain of methane! But, it's good to know the Radar team has seen some changes, and are tracking them.
Posted by: Juramike Jan 24 2008, 04:56 AM
A new article in press describes the T7 and T8 RADAR swaths:
Lunine, J.I. et al. Icarus 2008 "Titan's Diverse Landscapes As Evidenced By Casssini Radar's Third and Fourth Looks at Titan."
doi: 10.1016/j.icarus.2007.12.022
Unfortunately, the abstract is not yet available on the web. However, an initial presentation of some of this material is freely available here: http://%22%20http://www.lpi.usra.edu/meetings/lpsc2006/pdf/1252.pdf%22
The article has an in-depth analysis of the features seen in the T7 and T8 Swath. It also has a very neat graphic showing the dielectric constant contour levels near the Huygens Landing Site based on the Ta and T8 polarized radiometer passes (at 100 km resolution). This is figure 4 in the text. (The graphic is in a published article so reproducing it here would be double-plus uncool.)
To help put Figure 4 in context, I created graphics showing both the corresponding ISS image and the corresponding RADAR image for the the region covered in Figure 4. Looking at the dielectric constant contour map one can say "Gee, that just great
yet ANOTHER observation that seems totally orthogonal to the other observations."
Fig 4 ISS corresponding region:

|
Fig 4 T8 RADAR corresponding region:

|
It seems that while ISS and RADAR are kinda-sorta correlated, the dielectric constant doesn't obviously match up to anything ISS or RADAR.
But I'll take a stab at it anyway: the low dielectric constant (more non-polar) zones seem to match up with both the Shangri-La sand seas to the East AND the areas of central Adiri. The higher dielectric constant zones (more polar icey) seem to correlate better to margins and areas east of isolated hills. The higher dielectic constant areas seem to correlate to areas that appear "mottled medium gray" in the RADAR. (There is a uniform medium-gray area in central Adiri that has a low dielectric constant.)
So going on a limb here, maybe the dunes are primarily organic (as figured), the bright deposition material in the highlands area are also primarily organic (or non-polar), while the eastern margins are eroded organic/ice sands mixes with a higher dielectric constant due to increased ice content. Huygens landed in an eastern margin area.
Perhaps the surface materials in the Adiri/Shangri-La interface are fairly homogeneous after all?
In the next few slides, I've extended the regional image to the W of the Huygens Landing Region to show the "shark fin" feature in central Adiri strongly correlated in both ISS and RADAR. This can be used as an anchor point for the features in Adiri.
ISS of Huygens Landing Region and Central Adiri:

|
RADAR T8 Swath image of Huygens Landing Site Region and Central Adiri:

|
-Mike
Posted by: ngunn Jan 31 2008, 04:56 PM
This is a red filter narrow angle shot from 29th Jan 08, one of the ones ugordan used (I think) for his latest exquisite colour image. I'm posting it here because I think I can just make out some of the surface albedo features, i.e. equatorial sand seas. Can anybody confirm this, and maybe identify the features?
http://saturn.jpl.nasa.gov/multimedia/images/raw/raw-images-details.cfm?feiImageID=141615
As well as being the best of the three 'visible' filters for seeing the surface of Titan red is a good choice for reducing the albedo contrast between Titan and Saturn, a problem for the colour version as Gordan mentioned. So if confirmed this would be nice - Titan sand seas and Saturnian cloudforms in the same image.
Posted by: ugordan Jan 31 2008, 05:03 PM
It's not news Titan's surface is marginally detectable through the red filter. It's best to use calibrated images for that, jpeg artifacts really kill it. Here are a couple of enhanced RGB wide-angle shots showing this:
http://farm2.static.flickr.com/1048/820441390_0aedf3e4b7_o.jpg
http://farm2.static.flickr.com/1236/819214959_80c40399c1_o.png
Posted by: rlorenz Jan 31 2008, 07:02 PM
Quite - we even made a partial map with the HST F673N filter way back in 1994
(see the Smith et al 'map of Titan' paper in Icarus, 1996
http://www.lpl.arizona.edu/~rlorenz/hstmap.pdf also shown in Lifting Titan's
Veil)
Then of course there was the Voyager orange filter surface detection by Richardson
et al. Icarus 2004
http://www.lpl.arizona.edu/~rlorenz/voyager.pdf
I guess if you want to really go back, you can see in McKay et al's 1990 Icarus
paper on radiative-convective equilibrium model that the observed albedo of Titan
in the red was slightly dependent on the surface reflectivity...
Posted by: JRehling Jan 31 2008, 08:20 PM
Looking downrange, finding the wavelengths to penetrate a cloud layer could have some interesting applications if we find any terrestrial extrasolar planets and get the signal:noise to perform broad filtered photometry. In our solar system, both (2/2) of the worlds with atmospheres denser than Earths have 100% cloud cover all the time. And Earth is covered about 50%. Terrestrial planet imaging (or lightcurves, even) isn't going to prove very impressive if we're looking at a lot of Venuses in white light.
Posted by: ngunn Jan 31 2008, 08:37 PM
Sure, I know the surface is faintly visible in red. I just wasn't sure if what I think I'm seeing in this particular raw image correlates with real features. If so it would be the first time I personally had noticed a single monochrome image showing both Titan surface features and Saturn cloud details. Not even claiming it's the first of those. Merely a little personal 'trivial pursuit' question. Can anyone help? Are those irregular shadings crossing the centre of the disc real surface features? Anybody got a simulated view to compare?
Posted by: ugordan Jan 31 2008, 08:55 PM
Be the judge yourself!
2 red frames stacked and enhanced:

|
Amazingly, the surface is even apparent through the wideband clear filter, 4 frames stacked:

|
Posted by: ngunn Jan 31 2008, 09:00 PM
Aha!! So it is really there. Thanks a lot for doing that.
Posted by: ugordan Jan 31 2008, 09:04 PM
It's my pleasure.
Here's a comparative view from VIMS, covering similar territory, but a bit more to the west than the above shots:

|
Posted by: Juramike Feb 2 2008, 12:41 AM
I made a freehand interpretation of the Figure 4 graphic in the Lunine et al text. and overlaid it on top of the ISS image. The freehand image does not show the fine details from the text but provides the rough overall message. The low dielectric constant materials (organics, dune sands) are in brown while the higher dielectric constant materials are in blue (polar ices). The border in these graphics is approximately the 1.5 dielectic constant line.

|
Here is the same freehand interpretation overlaid on the RADAR image.

|
What it implies: The part in the upper right is pure dune sand material well out in the Shangri-La dune sea. This is low dielectic constant stuff - most likely the dune sands are organic (and thus, non-polar). That's the easy part.
The bright highlands of Adiri are also on average lower dielectric constant material. This could mean lots of dune sand material is mixed in there OR it could mean that the bright material in Adiri may also be low dielectric constant.
The eastern margin of Adiri (where Huygens landed) is of higher average dielectric constant. This implies more polar ices (water ice sands). This could fits in nicely with VIMS data where dark blue ice sands are near the Eastern (downwind) margin of upland areas.
-Mike
Posted by: Juramike Feb 2 2008, 03:30 AM
The higher dielectric constant materials observed downwind to the low dielectric constant materials of Adiri are not consistent with downwind drift of the Adiri highland materials.

|
If the material was being blown downwind from Adiri, the immediate downwind drifts should have the same dielectic constant. They don't.
One possibility consistent with the observations is that highland polar crust materials have been eroded down from Adiri and deposited around the highlands. Dune sands blown in from the west would cover up the western margins, but cause a windshadow effect immediately downwind from Adiri. Even further downwind (out towards the middle of Shangri-La), the sands would form a thickening cover that would eventually obscure the eroded ice sand mantles.

|
Thus the area immediately downwind (usually E) of bright highlands may be eroded deposits left unobscured by the wind shadow effect.
Huygens landed in such an area. At the Huygens Landing site, we were seeing the eroded and reworked materials resulting from fluvial erosion of the highlands terrain.
But if it is eroded material from the bright highlands, why is the margin area ISS-dark while highlands are ISS-bright?
Some possible explanations:
1) Undermethane chemical or physical modification of the material changes the spectral properties (but not dielectric constant) from bright-->dark
2) Rain easily percolates throught the bright material, and erodes the ice crust hardpan underneath.
3) Bright material deposition happened after the bulk of erosion created the ice sand apron, but before basin level was flooded.
-Mike
[This also argues that the bright highlands are not affected by aeolian erosion, rather it is the dark material that is affected by aeolian erosion. (Which then affects the bright material by obscuring and invading features). Dune sands mobile, bright stuff stable.]
Posted by: ngunn Feb 2 2008, 07:54 PM
I think you could be onto something mentioning polar crust material in Adiri. I've been thinking that an icy 'lithosphere' decoupled from the bulk of the interior by an aqueous ocean would be relatively easily destabilised and reoriented by sustained deposition at the poles (and other processes). How much does the surface of Titan wander about with respect to the rotation axis? Maybe a lot more than happens on Earth. As well as moving unlikely material to unlikely places that could account for some of the tectonic features we are seeing, maybe including formation of the large lake basins.
Posted by: Juramike Feb 3 2008, 01:55 AM
Uh-oh. Whoops. My bad. I was using the term "polar" to refer to higher dielectric constant materials.
"Polar" in chemistry terms would refer to hydrophilic water-loving molecules with a huge dipole moments or even formal charges. Polar molecules and functionalities include: water, salts (ionic), amines (especially when protonated), carboxylic acids (especially when deprotonated), alcohols, amides, sugars, amino acids. The water ice crust would be considered polar.
"Non-polar" compounds would include hydrocarbons (methane, ethane and longer-chain saturated friends), waxes, polyaromatic hydrocarbons, alkenes, alkynes and other little greasy functionalities. The organic "shizzle" would most likely be non-polar (or at least less polar compared to water). IIRC, CO2 is fairly non-polar, although a really good solvent for most organic molecules (supercritical CO2 is used for extracting caffiene from coffee beans in order to make decaffinated coffee).
A really good list of dielectic constants measured for common materials can be found http://clippercontrols.com/info/dielectric_constants.html (WARNING: dielectic constant is sensitive to temperature. Unless otherwise noted, the measurements in the list were done at 298K, Titan's surface temperature is 95K.)
-Mike
[With regards to the actual geographical poles of Titan, I suspect that both the north and south polar regions each are composed of at least two different types of terrains. These two terrains may each have different types of crustal materials. Evidence for this is the two differing morphologies of the lakeshores observed in the polar regions - fractal-like, and caldera-like. Both polar regions have large areas where the lakeshores are caldera-like, while other areas have lakeshores that are fractal-like. More on this later....]
Posted by: nprev Feb 3 2008, 05:08 PM
Interesting observation, Mike (duh...do you ever make any other kind?) Does this perhaps indicate differential ages (dare I say epochs?) between such features? In this view, caldera-like lakes would be relatively recent, and the fractal forms represent aging calderas.
If the polar monsoonal cycle exists, it would presumably play a very significant role in this evolution.
Posted by: ngunn Feb 3 2008, 09:40 PM
Ha-ha! No problem with what you posted Mike, the misunderstanding is all mine. A good caution for anyone discussing this.
On Titan, some (geographically) polar deposits are organic, and therefore (chemically) non-polar, whereas some (geographically) equatorial deposits are icy, and therefore (chemically) polar.
All the same the point about migrating crust stands. It's a good way of producing a lot of observations that appear orthogonal to one another, and one possible way to generate a complex geological history for any given location without terrestrial-style plate tectonics.
Posted by: Juramike Feb 8 2008, 04:13 AM
) is that the Equatorial Sand Seas are relatively shallow (compared to Earth) but are not silted over.I resurrected an old post (this thread, posts http://www.unmannedspaceflight.com/index.php?s=&showtopic=4177&view=findpost&p=91107 and http://www.unmannedspaceflight.com/index.php?s=&showtopic=4177&view=findpost&p=91115): There is a recently released altimetry trace using SARtopo just north of the Huygens Landing site that is reported in Lorenz et al. LPS XXXIX (2008) Abstract 1839. "Latest Cassini RADAR Results from T41 Titan Flyby, February 2008: Huygens Landing Site and Hotei Arcus."
Abstract freely available http://www.lpi.usra.edu/meetings/lpsc2008/pdf/1839.pdf.
The altimetry trace runs WE 150 km north of the Huygens Landing Site. I've attempted to diagram the average of the trace as well as its placement in the T8 RADAR image in the graphic below:

|
Here is another graphic that shows the trace placement in T8 RADAR and in ISS. (I appreciate that the authors set the 0 m elevation line pretty close to the bright-dark boundary.)

|
According to the trace, the altitude drops 950 m over 450 km as it glides into the Shangri-La basin. That works out to an average slope of 0.1 degrees or 0.2% (pretty close to the estimate of 0.1% previously made here (this thread, post http://www.unmannedspaceflight.com/index.php?s=&showtopic=4177&view=findpost&p=91115)
). It is very interesting that dunes are observed all the way across the basin along the trace. So the basins are not silted over dark flatlands, they have a slope and depths (and dunes, also).For comparison, the overall trace on Titan (950 m over 450 km) is approximately 3x steeper and almost the same type trace as going from the Outer Banks to the Central Piedmont (Winston-Salem) of North Carolina, or for our European colleagues, about 3x steeper as the trace going from the English Channel to the Midlands of England. There are finer peaks and valleys in the trace in the abstract (but not in my graphics), these may be due to crossing dunes or from other topographical roughness.
So the Sand Seas are not mirror-smooth flat areas, they drop gently to lower regions, and the dunes follow the topography. (There must be downhill longitudinal dunes and uphill longitudinal dunes.)
Note that the point 150 km due north of the Huygens Landing site is at roughly -300 m elevation. If we assume that the Huygens probe landed at about 0 to -50 m elevation, this works out to a 0.2% slope as well.
-Mike
Posted by: ngunn Feb 8 2008, 01:51 PM
How to maintain regional slopes on a world where there is continuing erosion and deposition going on? Its a problem for the methane seas as well as for the sand seas. I come back to polar wander as a possible mechanism, recalling the case of the putative northern ocean on Mars whose shorelines are no longer level for this reason. So I wouln't rule out widespread silting on Titan - maybe Shangri La was more level at some time past. The amount and distribution of surface deposition is still very uncertain and we know next to nothing about processes at the underside of the ice shell. So there is no way yet to know how much the poles might wander. I'll bet it's a lot more than for a solid-all-through world like Mars though.
Posted by: nprev Feb 8 2008, 03:30 PM
I'm tracking with you here, Nigel. Devil's advocate question: If the crust is mobile, why don't we see extensive mountains, faults, etc? Answer would seem to be that the tensile strength of the crust isn't sufficient to sustain such features, which could provide all sorts of really cool constraints on composition, thickness, etc. if we can construct a plausible model of an active "icegunkosphere".
Posted by: ngunn Feb 8 2008, 04:37 PM
I'm not suggesting mobile as in plate tectonics, just that it might roll around relative to the rotation axis more or less all in one piece, in response to asymmetric top-loading, sub-ice processes or a combination of the two. This would produce tensional and compressive tectonic features at the surface as well as regional gradients. It would transport materials between climatic zones (think coal in Antarctica). In fact there are mountain chains in lots of places (e.g. Adiri) and straight fault-like boundaries between different terrains (Huygens view). There are plateaus that look like sedimentary deposits raised up and then dissected by liquids. There are basins that should have been filled in long ago. Something is creating all those features as fast as they're being eroded or buried. What mechanism does the Devil advocate?
Posted by: nprev Feb 9 2008, 10:31 AM
...guess I'm not as devilish as usual...need to update the calibration constants in my Evil EEPROMs (E^3PROMs?)...
I was actually thinking of tidal effects, which would presumably cause some asymmetry between the Saturn and anti-Saturn hemispheres. The apparent lack of such differences (at least large ones) supports your hypothesis, with the caveat that we're not completely sure how rapidly erosion works on Titan (or indeed what all the erosional mechanisms/modes/agents even are). Need more data, lots more.
Posted by: rlorenz Feb 9 2008, 02:59 PM
Nah, I think tides are essentially symmetric.
Congrats to Juramike on taking all of three nanoseconds to pounce on my LPSC abstract (your
red line is pretty close to the track - actually you can sometimes locate these SARtopo tracks on
the images because they are where the sub-beams are seamed together - see e.g. the right end
of your picture where the beams are slewing onto point (it is the mismatch
between the intensities in the overlap that actually provides the information to require the terrain
height to be adjusted... basically monopulse angle estimation of the features in the overlap)
Re the more general item in this thread on topography - in some sense it is the activity of the planet
that causes, rather than eliminates, mountains - even if that means erosion (as long as the erosion occurs
faster in some places than others). On the other hand, you need to move the debris somewhere -
whether that means downwind, or downhill, I couldnt say (e.g. why all the sand at low latitudes?)
I think it will be a while before we figure out the tectonics of Titan - it does look like there is some
rifting or whatever of bright blocks at a small scale, maybe on the large scale too (Fensal/Aztlan etc).
I dont see a strong case yet for any large-scale re-orientation (don't see a case against it either) -
I bet there is major climate change, but that could be driven by an episodic resupply of methane rather
than by Croll-Milankovitch type astronomical forcing.
Posted by: ngunn Feb 9 2008, 09:46 PM
I'll settle for that. Just another possibility to be borne in mind as we study this complex world.
Posted by: Juramike Feb 10 2008, 04:06 AM
The partial altimetry trace should allow a better estimate of the Shangri-La basin average depth and thus volume.
From the "shoreline" (bright/dark boundary) of Adiri the altimetry trace slopes down to -950 m then begins to climb upward again. This may be due to the offshore slope of Mindanao Facula which lies just beyond the eastern terminus of the altimetry trace.
Assuming regular slopes from the shoreline into the basin, it should be possible to identify the location of deeper basin pockets. These would be points in Shangri-La basin that would be the farthest away from major shorelines or major islands. These are indicated in the first graphic as blue dashed circles. [The blue circles only indicate the approximate location of the deep pockets, I am NOT inferring that they are impact craters]. Due to the large number of bright islands and narrower channels, the region in NE Shangri-La is assumed to be fairly shallow.

|
Interestingly several of these seem to have a fairly regular spacing and lie about 300 km away from the shorelines. Assuming an average slope of 0.2%, this would imply a pocket depth of approximately 600 m for a point lying 300 km away from shoreline in all directions. The second graphic shows estimated EW altimetry transects across a few of the deep pockets:

|
From these, I estimated the average depth of Shangri-La basin to be 300 m. (Based on the deeper pockets, the depth would be larger, I pulled it shallower due to the NE Shangri-La shallow region. The surface area of the Shangri-La basin is estimated to be 2.29E6 km2 (=2.29E12 m2) [estimated by map cutout proportional weight].
Multiplying this by the depth estimate of 300 m we get a volume estimate of 6.87E5 km3 (= 6.87E14 m3] for the Shangri-La basin.

|
[Cross-check: If Shangri-La was a perfect circle, it's radius would be 854 km. From the shoreline out to 854 km at an average slope of 0.2%, we get a maximal depth of 1708 m. For a cone the volume is (1/3)pi*r^2*h. For this cone we'd estimate (1/3)(3.141)(854km^2)(1.708) = 1.30E6 km3, which I'd call pretty close to the estimate above (remember the NE shallows!)].
It ain't perfect, but it gives us a better ballpark estimate.
-Mike
Posted by: Jason W Barnes Feb 10 2008, 10:11 AM
|
|
If the material was being blown downwind from Adiri, the immediate downwind drifts should have the same dielectic constant. They don't.
One possibility consistent with the observations is that highland polar crust materials have been eroded down from Adiri and deposited around the highlands. Dune sands blown in from the west would cover up the western margins, but cause a windshadow effect immediately downwind from Adiri. Even further downwind (out towards the middle of Shangri-La), the sands would form a thickening cover that would eventually obscure the eroded ice sand mantles.
You are right that the fuzzy, ISS-bright material east of the faculae isn't blown there by the wind. The spectrum of the units east of faculae, which VIMS calls "dark blue", all match that of the Huygens landing site, and show enhanced water ice relative to the surroundings. Ice is relatively more reflective at 0.93 microns than at the 1.6, 2, and 5 micron windows that VIMS can compare. I think that your supposition that they are eroded materials from the faculae is also correct, as mentioned http://www.barnesos.net/publications/papers/2007.11.JGRP.Barnes.Titans.mountains.and.channels.pdf.
- VIMS Jason
Posted by: ngunn Feb 10 2008, 07:51 PM
Thanks for posting that paper, JWB.
Posted by: Juramike Feb 12 2008, 03:59 AM
Thanks for the paper! I'm trying to wrap my head around the ISS-dark RADAR bright VIMS dark blue mountains in E Xanadu....
(Why aren't they covered with schizzle like the other high terrain?)
-Mike
Posted by: Juramike Feb 12 2008, 04:49 AM
I took a stab at estimating the amount of Dune Sands in the Shangri-La basin.
To make the estimate easier, I'll assume 100% of the Shangri-La surface area estimate is covered in dune fields. I will ignore the amount of surface area on the E margins that is void of dune sands. (I'll also ignore the islands and associated margins in the basin itself)
The average depth of typical dune sandfield can be estimated using the average height (ridge to trough) of a cross section of the dunes. (A freely available CHARM presentation on dunes can be found here: http://saturn.jpl.nasa.gov/multimedia/products/pdfs/20070227_CHARM_Lorenz.pdf)
Taking the max height as 150 m and noticing that the ridges and valleys would cancel out, we get an average height of 75 m:

|
Estimated volume of Shangri-La Dune sands = Surface area of Shangri-La (2.29E12) x average depth of dune sands (75 m) = 1.7E14 m3.
This is probably a lower bound, since there may be additional dune sands material below the level of the lowest trough. (These are not necessarily mobile, however.)
This means that the estimate of the Shangri-La basin itself (no dune sands) is actually deeper, since it has been already infilled by a significant (>20%) volume of dune sands. The estimate of the "original" empty Shangri-La basin is thus at least 8.6E14 m3.
-Mike
Posted by: ngunn Feb 12 2008, 11:07 AM
(Why aren't they covered with schizzle like the other high terrain?)
-Mike
This reminds me of a suggestion I posted ages ago. The time elapsed since the last catastrophic rains (or outwash floods) at a given location may be a significant parameter affecting surface properties.
Posted by: Juramike Feb 12 2008, 01:09 PM
That's what I'm wondering too....which would lead to the conclusion that the isolated VIMS dark blue mountains (like Mabon Macula) are younger than the surrounding terrain. (They don't have the equatorial bright material "paint").
But there are RADAR-bright (rapid erosion) streams that appear to be emanating from this feature or that come very close (maybe even traverse it).
So it is either a source of the streams, or it sits in a local depression and the streams are flowing around (or through it).
(Dark channels flowing around central RADAR bright domes have been previoulsy seen on Titan, so this isn't too wierd.)
Could it be a cryovolcanic plug dome? Could the hydrocarbon liquids be coming from local upwelling of the methanofer at this point?
Or did the streams preexist and the plug dome came up and got eroded down as fast as it formed.
Here is a graphic of the RADAR area around Mabon Macula. (The images in the Barnes et al. article are much better, but I've highlighted an additional RADAR bright VIMS dark blue stream going to the E, and a putative RADAR-dark VIMS-not obvious channel radiating to the NW.)

|
[Looking at the channel branching, I'd suggest that the streams are flowing overall from N to S. The S channel emanating from the the feature may be constricted by two VIMS bright highlands just to the S of Mabon Macula. This tentatively supports the "preexisting stream" hypothesis].
Wierd.
-Mike
(Another predicted feature to search for would be a Fresh RADAR-bright ISS-dark crater somewhere in the Equatorial Sand Seas. This would be a crater that hit AFTER the most recent flood stage and so would be relatively underoded without the bright equatorial zone "paint". Any alluvial structures on the crater rims would help date the arrival of the crater and thus a minumum estimate for how long ago since the last episodic flood.)
Posted by: ngunn Feb 12 2008, 01:34 PM
Possible, but not quite what I meant. I was assuming all the mountains were much more ancient than the weather processes, but where a catastrophic flood hits a lot of the organic 'paint' gets washed off, temporarily exposing the dirty ice or clathrate bedrock (some of which is also scoured away forming pebbles in the outwash).
Posted by: ngunn Feb 12 2008, 02:51 PM
More speculations on the fate of organic 'smust' deposited on the surface in Titan's lower latitudes.
1/ Gradual deposition of light coloured organic materials, possibly coming down with the morning drizzle, mantles dry highlands on a timescale of centuries.
2/ Catastrophic rains (perhaps once per millennium at any given location) wash the deposit off, temporarily exposing icy bedrock over a limited area.
3/ Once on the plains the material darkens and coagulates into larger grains, possibly in part via beta-irradiation from radiocarbon, suggesting a timescale of 5 to 50 thousand years for this process.
4/ The dark grains break free from the surface of the plains and drift to form dunes. Although this represents a fairly long timescale for dune material formation, the dunes must be mobile on much shorter timescales to avoid mantling by process 1 and to erase signs of erosion by process 2.
Posted by: Juramike Feb 12 2008, 04:17 PM
OK.
Maybe Mabon Macula is made of material that is more friable than other typical mountains. So any coating that was deposited on the mountain would be rapidly physically eroded off. (like spray painting exfoliating granite).
Both dirty ice and clathrate would look the same to VIMS.
The tough thing to explain is how the mountain and stream bottoms have the same composition, yet the surrounding plains have the typical "equatorial organic paint". I would have thought that if big enough flood came to cover the mountian, you would also get removal of the paint from the surrouding plains as well. Unless there was some type of property of the mountain stuff that made the organic paint more easily removed (crumbly, not as good a binder, etc.)
I guess the two possibilites are that it is either a younger mountain, or that it is composed of materials with properties that help the "paint" wash off when the rains come. In the Barnes et al. article the authors state:
"We therefore favor the interpretation that the spectral distinctiveness of mountains, as observed in the area east of Xanadu, results from variability in surface properties....Mountains and radar-rough areas might be expected to experience more intense erosion than radar-smooth areas by virtue of their greater exposed surface area. These areas might then either have a thinner or less complete covering of any haze-derived nitriles and hydrocarbons, leading to their spectral distinctiveness."
Following this logic, one could speculate that radar-smooth areas of the same material then might not erode as quickly, and thus still keep an "equatorial bright paint".
-Mike
Posted by: ngunn Feb 12 2008, 04:58 PM
I wasn't suggesting a flood deep enough to cover the mountain, more a precipitation episode where a metre or more of rain falls on a localised patch of mountain terrain within a few hours or days. The streambeds would be left full of cobbles and pebbles of bedrock while the finer organic residues would be washed further out onto the plains along with some (smaller, lower density?) pebbles. The flood would not scour the plains down to bedrock as it did the mountains for two reasons. Firstly there is a thick layer of sediments already on the plains, not just a thin veneer of un-darkened organic stuff as on the mountains. Secondly, with lower gradients and more space to spread once the outwash is out on the plain, flow velocities would decrease rapidly, leading to more deposition than scouring there (taking the episode as a whole).
This is all just one simplistic line of thinking, of course. There are likely genuine differences in bedrock composition and age also involved. I'm only saying that an area which just happens to have won the rollover jackpot of monsoon rain may, for some years or decades, look as if it has distinctive geology even if it hasn't.
Posted by: JRehling Feb 12 2008, 07:51 PM
The parameters I keep trying to twiddle about are density/gravity Water-ice rocks are, relative to liquid methane, very much lighter than silicate rocks are on Earth compared to water runoff. Of course, liquid running down a slope on Titan should only pick up a sixth of the kinetic energy due to descent. But going the other way, liquid methane has much less surface tension than water.
I guess, just trying to model all of this in my brain using naive physics, that you'd get small streams/rivulets where liquid methane moves a lot faster than it would relative to Earth, but large streams where it moves a lot slower. It seems like the differential points towards more pebbles and silt getting carried downsteam but less large-scale erosion and mass movement. There's no doubt that Titan shows more impact cratering than Earth. So, talking out of my hat here, it seems like new surface on Titan should be worked into locally smooth surfaces very quickly, but large features should endure longer than they do on Earth (or even in deserts on Earth). Sort of like a hillside on Earth covered with a few inches of snow. The large-scale ruggedness of the terrain is not significantly altered by the snow. But the surface of a fresh snowfall is quite smooth, with no bumps past the millimeter scale. I wonder if that's what most of the highlands are like on Titan (but with erosion, rather than deposition of precipitate, causing the smoothness).
Posted by: Juramike Feb 13 2008, 05:23 AM
I took a stab at estimating organic material deposition and ice sand deposition from fluvial erosion in Shangri-La basin over a 2 Gyr time period.
I'll assume that the "solventshed" (drainage basin) is about 3x the size of the Shangri-La Sand Sea Basin. This makes the Greater Shangri-La catch basin approximately 10% of Titan's total surface.
For the ice sand deposition from fluvial erosion, I used the estimated time-averaged erosion rate for the last 2.8 Gyr of 0.3 m3 per m2 per Myr. (Derived from the Erosion on Titan thread, post http://www.unmannedspaceflight.com/index.php?s=&showtopic=4724&view=findpost&p=102944). This rate is applied to the surface area exterior to the Shangri-La Sand Sea basin itself. (I'm only interested in the amount of material washed into the basin, not moved inside the basin itself).

|
Over 2 Gyr, the upper bound to the amount of ice sands brought into the Shangri-La basin is 4.8E15 m3. (Note that this is more volume than the present basin).
***
For organics deposition of solid haze materials (not ethane), I used the upper value of 9.5E3 g Myr-1. This is a global average deposition rate. Due to a decreased amount of rainfall assumed for the Equatorial region, I would place this as an upper bound. Assuming the density of polyacetylene, this rate corresponds to 0.015 m Myr-1.
The time-averaged equatorial zone erosion rate is thus at least 20 times higher than the organic material deposition rate.
[Side note: I suspect the production rate is independant of atmospheric thickness for thicker atmospheres. The production altitude would shift higher for thicker atmospheres due to the trade off of enough molecules to react, and a thin enough atmosphere to allow UV to penetrate.]
This rate was applied to the entire methaneshed under the assumption that hydrocarbon solvents would wash nearly 100% of the material into the basin over 2 Gyr. (Upper bound estimate).

|
From this we get an upper bound to the organic atmospheric products brought into the basin of 2.4E14 m3 material over a 2 Gyr period. This is only 30% of the Shangri-La basin.
Here is a summary of the Shangri-La estimated volumes:
Present basin size: 6.9E14 m3
Ice sand erosion sediments over 2 Gyr: <4.8E15 m3
Organic deposition materials over 2 Gyr: <2.4E14 m3
Dune sands: >1.7E14 m3.

|
From these estimated numbers, it seem unlikely that the dune sands could be pure organic materials only from atmospheric deposition products. There's just too much dune sands required. A possible scenario is that dune sands could be constructed of small ice sand particles with an organic coating (with the more polar, less hydrocarbon-soluble types of gunk [nitriles, pyrimidines, glycine, etc.] sticking to the water ice surface.)
[If the dunes are made of methane-soluble organics, they will become a complete mess when any methane rains come]
-Mike
Posted by: rlorenz Feb 14 2008, 03:45 PM
....
The estimate of the "original" empty Shangri-La basin is thus at least 8.6E14 m3.
Fractionally more elaborate (and covering the whole sand inventory) - and peer-reviewd - is
http://www.lpl.arizona.edu/~rlorenz/organicinventory.pdf
Posted by: Juramike Feb 14 2008, 05:34 PM
http://www.lpl.arizona.edu/%7Erlorenz/organicinventory.pdf
From post above (this tread, http://www.unmannedspaceflight.com/index.php?s=&showtopic=4177&view=findpost&p=109213):
My estimate of dune sands in Shangri-La: 1.7E14 m3 dune sands = 1.7E5 km3 dune sands in Shangri-La basin.
From Lorenz et al.:
Estimated range of total dune sands in Equatorial Zone Basins = 2-8E5 km3.
Shangri-La is 22% of surface area of the Equatorial Sand Seas of Titan (excluding Mezzoramia). Assuming sand is divvied up according to area:
Upper limit is thus 8E5 km3 x 22% = 1.8E5 km3 dune sands in Shangri-La basin.
Both numbers are pretty close. (The discrepancy could come from my estimate of 75 m as average sand thickness height, while Lorenz et al. used 20 m for average height.)
[To my embarrassment, I was completely unaware of the Lorenz et al. article when I made my estimatation. "A week in the laboratory can save an hour in the library".]
-Mike
Posted by: dilo Feb 14 2008, 06:43 PM
About idrocarbons, we are lucky to have such a huge reserve so far from us, making it completely unusable... let's think to greenhouse effect arising from another thousand years of crazy use of such energy source...
Posted by: ngunn Feb 15 2008, 10:04 AM
Thanks for posting that article here - much appreciated.
Posted by: Juramike Mar 3 2008, 03:43 AM
Ugordan's image of Quivira showing the 2.7/2.78 micron ratio contrast-stretched is really intriguing (Ugordan's original post http://www.unmannedspaceflight.com/index.php?s=&showtopic=4759&view=findpost&p=103924).
I painstakingly lined it up with the T25/T28/ISS W Quivira mosaic to try to correlate features:

|
Blue lines: Sotra Facula
Yellow lines: Coats Facula
Green lines: Bohai Sinus
Red lines: "Evil eye" of W Quivira
Purple line (EW only): N bulge of Quivira
There is definitely some really funky stuff going on. For one thing, Aztlan basin (at S) appears to be a narrow dark sinous channel. Another thing is that Coats Facula and the "Evil eye" match up very closely to the RADAR appearance (they show the "rim"). Even weirder is the almost disappearance of Pacman Bay. Some basin areas without evident dunes (like due W of Quivira) are dark in this area, while basin areas with dunes (in basin NW of W Quivira) appear gray.
There is an enigmatic region midway between Sotra Facula and Coats facula (indicated by a blue arrow) that appears dark by ISS, dark (smooth) by RADAR, yet looks like a light gray oval by the 2.7/2.78 um ratio image, with an associated downwind brighter area. Closer examination of the T25 RADAR Swath shows a circular smooth (particularly dark) area with a downwind uniform RADAR dark area (smooth).
Amazingly enough, this ratio image seems to fit better with the RADAR view than with the ISS view. Compare carefully with the RADAR image of W Quivira.
What is this spectral ration image telling us?
One speculation is that there are three components in the Equatorial Sand Sea basin, the dark blue ice sands (gray at this rato), and the mobile dunes (also gray at this ratio), and a third component (we'll call it bottom yukkies) that appears dark at this ratio.
Another speculation is that the darker areas are deeper, and that we are seeing a hint of topography using this ratio. (This isn't too weird, since the methane in the atmosphere significantly scatters light, a ratio between two absorbance windows might hit two different extinction coefficients).
So that dark sinuous channel could be the deep part of Aztlan. It also means that funky oval rim indicated by the blue arrow could be a crater-like structure that has been eroded down smooth and is only evidenced by relative composition (and/or depth).
It also implies that off the southern margin of Quivira between Coats Facula and Pacman Bay has some very interesting features - it is not just a boring dark blue ice sand margin.
It would be interesting to see other regions of Titan viewed using the same 2.7/2.78 micron ratio contrast stretched.
-Mike
Posted by: Juramike Mar 3 2008, 04:36 AM
Digging in the literature, from Barnes et al. Icarus (2006) "Global-scale surface spectral variations on Titan seen from Cassini/VIMS":
"Though 2.8/2.7 um band ratios imply that there is no enhancement in water ice in the dark blue material relative to the equatorial bright unit, broad color differences between the 0.94, 1.08, and 1.3 um spectral windows relative to the 1.6, 2.0, and 5.0 um windows imply enhanced water ice in the dark blue specral unit compared to the dark brown"
So the 2.8/2.7 ratio is the great equalizer of water ice on either equatorial bright terrain or in eroded mantles - both should appear the same color. This ratio is acting as a filter for "non-ice terrain originating materials" to appear dark.
So for the 2.8/2.7 spectral ratoi images:
ice (the amount in bright equatorial terrains or eroded mantles) = brighter gray
Less ice (mobile dunes) = medium gray
Organic bottom yukkies = darkest
So the dark patch in Shiwanna virgae appears filled in by seriously pure organic bottom yukkies, not dune sands (dune sands would be grayer). And there is a darker "organic bottom yukky" sink in the ice sand mantle of S Quivira. And there is an eroded ice sand oval feature (crater?) just E of Sotra Facula with a RADAR-smooth downwind ice sand mantle
-Mike
Posted by: Juramike Mar 6 2008, 01:38 AM
Icarus article-in-press:
Barnes et al. Icarus article-in-press. "Spectroscopy, Morphometry, and Photoclinometry of Titans Dunefields from Cassini/VIMS." doi: 10.1016/j.icarus.2007.12.006
[Hint: many of the cooler authors make their papers freely available either here or on their website, and our own VIMS Jason is no exception. Click on the link below to the mountains and channels paper and play with the url.]
Wow. Lotsa really cool stuff in this article. This is kind of a companion paper to the mountains and channels paper (Link to post 259, this thread, http://www.unmannedspaceflight.com/index.php?s=&showtopic=4177&view=findpost&p=109165).
Here are some tidbits:
- A new VIMS scanning technique that can scan long noodles of terrain, useful for closer approaches.
- The VIMS instrument is able to detect individual dunes in the dune fields. (they are dark lines)
- Some (but not all) of the areas in between some of the dunes (interdune areas) are sometimes free of the dark brown dune sands and show different spectral characteristics. The interdune areas show the orginal substrate before it was covered in dunes. (e.g. dunes over bright equatorial material).
- One area in the T20 VIMS Swath (NW of Ksa and near Omacatl Macula) shows a fuzzy 5 micron bright substrate. 5 micron bright VIMS material is interesting stuff since it was only previously observed in Tui Regio and Hotei Arcus on Xanadu, putative cryovolcanic uplands. Its fuzzy appearance is due to dunefields partially obscuring this terrain. (Dunes of dark brown dune sands, interdune areas of weird 5 micron bright stuff). Even cooler, RADAR coverage of this area shows particularly bright stripes thought to be RADAR bright interdune areas. This area of 5 um bright terrain is either texturally rough at several centimeter scales (RADAR wavelength) or (that) they are highly fractured and therefore highly-volume-scattering.
- VIMS (and ISS) imaging is only able to penetrate about 10 microns (tens of wavelengths) while RADAR (and dielectric constant measurement) is able to penetrate meters into the surface. (Juramike quote: Reflection spectra is skin deep, while RADAR penetrates the soul).
- From Barnes et al. (abstract): The spectrum of the dune endmember reveals the sand to be composed of less water ice than the rest of Titan; various organics are consistent with the dunes measured reflectivity.
- From Barnes et al. (text): It is conceivable that the individual sand particles are not radially homogeneous, and that the VIMS reflectivity only represents an outer rind of organic material with a core of water-ice or other material.
- The dune areas with interdunes of different spectral units on Titan are technically dunefields and not sand seas. (sand seas would have sand in the interdune areas, dunefields have cleared interdune areas.).
- Dune widths of a little over 2 km seem about average, with an average height for dunes in NW Fensal estimated to be 30-70 m. (The dunes in Belet seem bigger).
It is conceivable that there may be sand free areas, or areas with a minimal sand cover in the depths of the Equatorial basins. (The dark blue ice sand margins on the downwind of bright islands already seems fairly dune free.) So the estimated volume of sand in the Sand Seas/Dunefields may be less than previously supposed. It's really nice to see substrate material peeking out from under the dunes.
-Mike
Posted by: ngunn Mar 6 2008, 11:16 AM
If it's out there why not just post the link?
Thanks for the tidbits though; very interesting.
Edit: http://www.barnesos.net/publications/papers/dunes.pdf
Posted by: Jason W Barnes Mar 9 2008, 04:24 AM
This paper was http://www.sciencedirect.com/science?_ob=PublicationURL&_tockey=%23TOC%236821%239999%23999999999%2399999%23FLA%23&_cdi=6821&_pubType=J&view=c&_auth=y&_acct=C000050221&_version=1&_urlVersion=0&_userid=10&md5=1a78e3e873b16315862eaa68ea20c097 just a few weeks ago; so its not even in dead-tree form yet! Based on the long queue of papers they haven't printed yet, it may be just online for awhile yet, too . . .
- VIMS Jason
Posted by: Juramike Mar 12 2008, 05:33 AM
I'm trying to wrap my head around the VIMS data and the 2.7/2.8 ration image the Ugordan provided.
I put together an quick intro to spectroscopy as applied to Titan. This was just to make sure I had a grip on the fundamentals before I tried to get cute with it.
I'm hoping one of our resident spectroscopy experts (VIMS Jason, Stefan?) can correct me right quick if I start stating anything blatantly stupid...
-Mike
Posted by: Juramike Mar 12 2008, 11:57 AM
Titan Spectra Part 1: The color of things.
Light hitting a surface is reflected specularly (like a mirror where incidence angle is important), reflected diffusely (like a matte finish), or absorbed. It is the specific combination of these factors that determine how much light, and at what wavelength, is reflected from a surface. For example, a good cosmetic mirror has a maximal specular reflection, near-zero diffusive component, and near zero absorption at visible wavelengths.

|

|
Surfaces appear colored due to the absorption of other colors in the reflected light. This is similar to the absorption of certain bands during transmission spectra. Think of it as absorption from the surface down to the reflection plane of the material, then more absorption from the reflection plane to the material surface.
[There is another effect called structural color of certains special materials. This is due to interference patterns set up on the surface rather than absorption effects. This is how some butterfly wings and bird feathers have color without pigment. It has recently been used to make cool-o fabrics without using chemical dyes. (I have a pretty tie that uses structural color.)]
Here is a good reference for color: http://en.wikipedia.org/wiki/Color

|
Physically, certain key wavelengths in light cause some type of quantum state change in the atomic/molecular structure of the material (molecular vibrational mode change, pi-electron cloud orbital state change, molecular orbital change, etc.). The energy from this wavelength is absorbed into the molecule. This removes it from the reflected light from the surface. The remaining light is what makes up the color of an object.
For a given wavelength, more absorption = less light to be reflected.
An example shown is a hypothetical organic compound with a pi-molecular orbital system that has a maximal absorption (UVmax) at 220 nm [0.22 um] way in the UV side. It would appear only faintly pale yellow in visible white light.

|
Another example is the Blue pigment Rosco R80 Primary Blue. This material absorbs light in the green-red portion of the visible spectrum. The reflected light is thus only bluish. The material is a blue dpigment. An image of a natural pigment, ultramarine, is shown.
Pigment (including example of Rosco R80 Primary Blue): http://en.wikipedia.org/wiki/Pigment

|
Another example is the complex molecule chlorophyll a. It has an extended delocalized pi-system coordinated to a metal center. It will have a very complex spectrum. It has two absorption maxima in the visible region at 465 nm and 665 nm [0.465 um and 0.665 um]. Taking white light and removing the absorbed red band (centered at 665 nm) and the blue band (centered at 465 nm) leaves (!) a nice green band that gets transmitted (when backlit as in the image) or reflected. This is why leaves are green. Chlorophyll is an exceptionally intense absorber of light. In the fall, the chlorophyll breaks down and other underlying pigments are revealed.

|
At longer wavelengths above 700 nm (0.7 um) in the near infrared, chlorophyll is highly transparent, allowing the leaf surface to reflect infrared light, this is referred to as the red edge and helps keep leaves from overheating. This is why healthy foliage is bright in IR photography. This characteristic spectral signature is visible from space.
Seager et al. Astrobiology 5 (2005) 372-390. Vegetations Red Edge: A possible spectroscopic biosignature of extraterrestrial plants. Doi: 10.1089/ast.2005.5.372 Article freely available http://arxiv.org/PS_cache/astro-ph/pdf/0503/0503302v1.pdf.
-Mike
Posted by: Juramike Mar 12 2008, 12:16 PM
Titan Spectroscopy Part 2. The Beer-Lambert Law
For a given wavelength, the Beer-Lambert Law relates the amount of light absorbed to the path length of the material and the concentration of the material:
A = e c l
Where:
A = measured adsorption of light
e = extinction coefficient, diagnostic for the material
c= concentration
l = path length.
More information on the Beer-Lambert law can be found here: http://en.wikipedia.org/wiki/Beers_law
http://en.wikipedia.org/wiki/Beers_law

|
What this boils down to (!!) is that material will absorb a characteristic amount of light at a given concentration. Change the concentration, you change the absorbance.
This is pretty intuitive, add twice as much dye to a solution, and half as much light gets through. (Add more stuff, things get darker).
So if you know the spectrum and extinction coefficient, you can look at a spectrum and figure the quantity of material present: This is the basis for most medical diagnostic tests and most chemical purity determinations.
Enter the ratio .

|
For a pure material the ratio of absorption at Wavelength A to the absorption at Wavelength B will be a constant. The ratio is equal to the ratio of extinction coefficients at the two wavelengths.
If the ratio doesnt match up, it means there is a bonus component absorbing light.
Absorbance effects are additive. This can be used to predict the spectra of mixed materials.

|
If we make a solution of chlorophyll, then add blue dye B (a dye is a soluble pigment), we get a new spectrum that is a combination of the individual spectra. Inversely, if you know how much chlorophyll is present, you can subtract out the spectrum and figure out blue dye Bs spectrum.
Reflectance spectra is similar.
At the simplest level, the reflectance spectrum of a mixture is inversely related to the absorbance spectra of the components. More absorbance of the components at a certain wavelength = less reflectance of the mixture at this wavelength.
A really great way to identify materials is to look at a broad range of reflected light (IR to UV) and to identify key bands that are diagnostic for certain materials. At the very least, it might be possible to match up the spectra between the unknown sample and a measured mixture of known materials.

|
Here is a plot of the reflectance spectrum of olivine, common terrestrial material.
There is an online simulator for the CRISM instrument on MRO at this website: http://ser.sese.asu.edu/SPECTRA/index.html
Mix and match your favorite lunar and martian materials and watch how the predicted reflectance spectrum changes.
See Emily Lakdawallas January 22, 2008 blog entry for an example of the overall surface spectrum of Mercury: http://www.planetary.org/blog/article/00001304/
[EDIT 20080320: http://www.space.com/searchforlife/080320-seti-mars-water.html is an excellent example of how to use spectral information to identify clay minerals on the martian surface. Look carefully at the subtle differences in the spectra of the different clay groupings in Figure 1A-1B in the linked article.]

|
Here is a plot of the reflectance spectrum of water ice on Enceladus in IR wavelengths. At major H2O absorbance regions, the reflectance is low. This graphic was adapted from Barnes et al. Icarus 186 (2007) 242-258 (Figure 12 in text). "Global-scale surface spectral variations on Titan seen from Cassini/VIMS. doi: 10.1016/j.icarus.2006.08.021 Article freely available http://www.barnesos.net/publications/papers/Titan.spectral.diversity.pdf.

|
Each spectral zone and mode of measurement (reflectance vs. transmittance) seems to have its own way of presenting spectra. For Titan, well use a plot of wavelength in um (very handy for the IR range) increasing to the right on the x axis, and I/F for the y axis. I is the measured reflectance intensity, and F is a function of how much light you would expect. Thus, I/F is what you get vs. what you expect.
Typical IR spectra for geological analysis are presented with wavelength in microns (um). In the image above, the visible region is indicated from 400-700 nm (0.4-0.7 um). Also indicated in the top part of the spectrum is an axis in wavenumbers (cm-1), this is a scale commonly used in organic chemistry to help identify functional groups. For example, amine N-H stretches are often observed at 3400 cm-1, while nitriles (CN) functional groups have a diagnostic peak at 2240-2215 cm-1.
-Mike
Posted by: paxdan Mar 12 2008, 05:09 PM
mmm beer.
sorry mods, couldn't resist.
Posted by: volcanopele Mar 12 2008, 07:36 PM
Reminds of that time Brad Dalton had a poster at LPSC on beer spectroscopy, with samples.
Posted by: Juramike Mar 13 2008, 12:44 PM
Titan Spectra Part 3: The Trouble with Titan.
On a normal airless surface, we could look at a huge range of wavelengths and get a very decent spectral signature of the surface. You could get all the data and try to figure out the components.
Heres an example from Emily Lakdawallas December 13th, 2006 blog entry regarding imaging of Mars using CRISM: http://www.planetary.org/blog/article/00000796/
If only it were so easy on Titan.
Unfortunately, the surface of Titan is hidden underneath its smoggy atmosphere. It is the methane that does most of the obscuring in the ranges that would be most helpful. But there are a few tight spectral windows that allow us to peek through the haze. These are zones where methane has a minimal absorbance. These are located at 0.94, 1.08, 1.28, 1.6, 2.0, 2.8, and 5 um in the infrared part of the spectrum. So any spectral information from Titan will have to come through these tight zones and well have to get clever about how we use this limited information.
See Emily Lakdawallas May 4, 2005 blog entry for an excellent discussion on Titans VIMS data:
http://www.planetary.org/news/2005/0504_Peeking_Through_the_Picket_Fence.html

|
Above is a simulated view of the surface spectrum of Enceladus (H2O) as if it was seen through the spectral windows for Titan.

|
The graphic above is a simulated graphic of what the spectral data points of the surface of Enceladus would look like seen through the methane windows and detected on the Cassini spacecraft (blue points). In green points are the simulated reflectance spectra of a leaves (chlorophyll a and the leafs IR reflective surfaces excluding water absorbances) seen through the methane windows of Titan. (If Titan were fully forested, the surface reflectance spectrum might look like this.)

|
Typically, you only get points through the window, so lines are drawn connecting the points that were observed. Naturally, this may result in a significant loss of information. There are also atmospheric correction factors due to haze backscatter and forward scatter. All these further complicate the analysis of information.

|
ISS images for Titan are normally taken at 0.938 um wavelength and these images are presented in most of the surface maps and images. Above is an ISS surface image of the Fensal-Quivira-Aztlan region at 0.938 um wavelength.
The Cassini VIMS could take a whole range of wavelengths when pointed at Titan, but only the ones through the methane windows would be of any use for surface features.
-Mike
[EDIT: Titan ISS wavelength values corrected]
Posted by: ugordan Mar 13 2008, 12:48 PM
Actually, if I recall correctly, the CB3 filter is centered around 0.94 microns, the first methane spectral window available to the ISS camera. ISS can't see further into the infrared than about 1.1 micron.
Posted by: Juramike Mar 13 2008, 12:58 PM
Titan Spectra Part 4: Ratios to the Rescue.

|
One way to get real clever about examining the surface of Titan is to use ratios of one wavelength vs. others. This allows terrain that is relatively brighter in one wavelength to stand out against the other. To make things pretty, one wavelength response will be colored green and another will be colored red and another blue. Then a multicolor image can show where one spectral response predominates. In the VIMS multicolor image of Fensal-Quivira-Aztlan above, the 1.6 um reflection is colored blue, the 2.0 reflectance is colored green, and the 5.0 um reflectance is colored red. In the image above, there is a pinkish area that corresponds to a region with a particularly strong reflectance at 5.0 um. There are also some dark areas to the east of Equatorial Bright terrain that have a particularly strong 1.6 um reflectance. These are indicated in the image below.

|

|
The spectrum of a typical Equatorial Bright unit was taken in from an area in N Tseghi. This was published in Soderblom et al., Planetary and Space Science 55 (2007) 2025-2036 as Figure 2 in the text. By measuring the detector response, we can get the ratio between the peak at 1.6 um and 2.0 um. (I used a ruler to do this from the journal article, as long as the method is consistent, this should work OK). The ratio of reflectance (I/F) 1.6/2.0 is about 1.2.

|
In the same article, a spectrum was shown of the 1.6 um region (referred to as the dark blue unit) in the region 1.0 um 2.2 um. (The region above 2.2 um was extrapolated by me.) This spectrum has been normalized and put next to the Equatorial Bright unit spectrum to show the differences in the 1.6 um and 2.0 um peaks. This is in the graphic above. Not only is there an obvious albedo difference in the ISS image, but there is a wavelength-dependant spectral difference as well. If 1.6 um bright materials (dark points) were the same as the Equatorial Bright materials, we would expect that the lines between the two points to be parallel (assuming other factors being equal). The black dashed circle in the graphic indicates where we would expect the data point to be if the lines were parallel. Since they are not parallel, it implies that the absorbance/reflectance properties of the two materials are different.

|
The graphic above shows the same spectra, but now with the H2O spectrum normalized as well (blue points and line). Note that a line through the 1.6 um and 2.0 um H2O ice data points is roughly parallel to the corresponding line through the data points for the 1.6 bright-material (dark blue unit).

|
A zoom of the 1.6 um and 2.0 um data points for each spectrum is shown above. Measuring the 1.6 um/2.0 um peak reflectance ratios shows that the 1.6-bright (dark blue unit) and the H2O ice are quantitatively similar, with a peak ratio around 2.0. They are both different from the Equatorial bright unit spectral ratio.

|
One possible explanation for the different ratios is that the absorbance of the surface materials is directly responsible for the observed ratios. For the H2O spectrum, it is possible that the absorbances of water at the two wavelength that sets ratio for the two reflectances. A safe statement is that it is possible that the absorbances of water could also be responsible for the ratio of the 1.6 um bright (dark blue unit) spectrum at these two wavelengths. To confirm the presence of H2O, it would be necessary to examine the full spectrum of the material. It is important to remember that there are always other combinations of materials that could mimic the observed spectrum;.
[My graduate advisor was famous for demanding his students to come up with at least three structures that could fit all of the acquired spectra.]
For the Equatorial Bright spectrum it is possible that there is at least one component that could absorb a larger amount of light at 1.6 um. This extra absorbance would decrease the reflectance at 1.6 um, thereby throwing the ratio between the two peaks to a lower value.

|
From detailed analysis of 1.6 um/2.0 um ratio, and ignoring other possible complicating factors, we can speculate that the dark blue unit is closer to the water ice spectrum when compared to the equatorial bright unit. We can also speculate that the Equatorial Bright material is composed of dark blue unit material combined with material that has an absorbance at 1.6 um. At the simplest level, this speculation is consistent with the observed spectra.
It is very important to realize that there may be additional components that become evident at other wavelengths in the full spectrum of both units.
From the observed albedo difference between the bright and dark units observed in the non-normalized spectra, it is clear (!!!) that the dark blue unit also contains at least one neutrally absorbing component.
-Mike
Posted by: Juramike Mar 13 2008, 02:41 PM
Thanks for the correction! The CB3 filter is centered at 0.938 microns (938 nm).
(When I Googled ISS and CB3 the top of the list was a paper with VP as the lead author : http://www.lpi.usra.edu/meetings/lpsc2007/pdf/2219.pdf)
This http://www.unmannedspaceflight.com/index.php?s=&showtopic=300&view=findpost&p=1436 also gives the filter list.
-Mike
Posted by: Juramike Mar 14 2008, 02:45 AM

|
Ugordans image above was made by taking the taking the ratio of the 2.7 um response and dividing by the 2.8 um response then stretching the contrast. In the Fensal-Quivira-Aztlan area, this image looks very different than the typical ISS (at 0.94 um) or VIMS [1.6, 2.0, 5.0 um] images of the same area.

|
We can divide this image up into spectral units based on 2.7/2.8 ratio (grayscale) and try to find the correspondence between these units and the previously defined VIMS units of Titan. In this region of Titan there were only three previously described VIMS spectral units: Equatorial Bright, dark brown dune sands, and the dark blue eroded ice sands. From comparison of Ugordans image with the VIMS [1.6, 2.0, 5.0 um] image, it appears that the dark brown equatorial dune sands unit can be split into two separate units: the original dark brown unit (dark gray in ugordans image) and a deep black unit. Example locations of each unit are labeled with brown and black dots. Similarly, the Equatorial Bright unit can also be split into two units: small regions of a brighter unit, and the original Equatorial Bright gray unit. The brighter Equatorial unit location is indicated with a green dot, the darker (normal) Equatorial bright unit is indicated by a yellow dot. In addition, the near-shore VIMS dark blue ice sand unit (indicated by a blue dot) seems to be indistinguishable to the medium gray Equatorial bright unit. Still in the VIMS dark blue ice sands unit but lying offshore in Aztlan is a significantly brighter unit (using this ratio); this is indicated by a purple dot.

|
The spectrum of a typical Equatorial Bright unit was taken in from an area in N Tseghi. This was reproduced in Soderblom et al., Planetary and Space Science 55 (2007) 2025-2036 as Figure 2 in the text. Measuring the spectra for the peaks at 2.7 um and 2.8 um gives a ratio of the reflectances of about 1.0.

|
Also in the Soderblom et al. article, a spectrum was taken of a dark area just to the W of Quivira. (This was later found to be a relatively dune-free area by RADAR). This area corresponds to the darkest of the basin units (indicated by the black dots) seen in the 2.7/2.8 ratio image. Measuring the normalized spectra for the peaks at 2.7 um and 2.8 um gives a ratio of about 0.9 for the deep black unit.

|

|
From the literature, the Equatorial Bright terrain and the dark blue ice sand margins have a roughly constant 2.7/2.78 ratio. From the discussion two posts above, there may be at least one extra component in the Equatorial Bright terrain unit that absorbs at 2.7 um. In the graphic the additional absorbance is indicated by a bright yellow box. (It is not shown in the graphic, but the pure H2O ice spectrum has a 2.7/2.8 ratio that is much greater than 1.). Assuming that there is a third non-ice component absorbing at 2.7, we can see how different amounts of this this component could explain the ratios observed in the different units.
For the normal equatorial unit (medium gray in image), this 2.7 um absorbance helps set the 2.7/2.8 ratio close to 1.0. Removal of this additional material (via dissolution?) would throw the resulting ratio higher (closer to pure H2O ice). This would account for the brighter equatorial bright unit. The brighter equatorial bright units correlate very well with some of the RADAR brighter (rougher) surfaces in Quivira.
The near-shore dark material has the same mix of components, and the same spectral ratio at these wavelengths. (A neutral absorber or specific wavelength absorbing component could account for the albedo difference in the ISS spectra at 0.94 um). This is consistent with the literature statement regarding the ratio equality of the two units. It is very hard to differentiate these two units in the 2.7/2.8 ratio image. Both the darker (original) Equatorial Bright unit and near-shore dark blue ice sands appear as medium gray.
For the right now, well ignore the off-shore Aztlan dark blue ice sand unit (brighter gray in the image, and indicated by a purple dot).
The ratio of the dark brown dune material unit is consistent with the increased presence of material with an absorbance at 2.7 um. (Picture migration of the dissolved component into the basin, and small ice grains rolling around and becoming coated in this material).
Finally, the darkest unit is consistent with the highest concentration of the 2.7 um absorbing material. The increased absorption causes a decreased reflectance at 2.7 um and makes the ratio drop to the lowest value. This is evidenced by the darkest pixels in the 2.7/2.8 image. Dissolution and eventual precipitation/deposition in the lowest portion of the basins is consistent with the spectral ratio at these wavelengths. Consistent with this scenario, the internal graben/basin in Tseghi shows the highest concentration of this material, and the darkest pixels. High concentration of 2.7 absorbing material = high absorbance at 2.7 um = lowest reflectance at 2.7 um= lowest (2.7/2.8) ratio = darkest gray.

|
A putative sequence is presented in the graphic above to explain the movement of materials:
To start, Equatorial bright material is deposited (via airfall?) in the highland above flood level regions. (Episodic floods removes/transforms these materials in the basins). Over the eons, this is washed by episodic rains. The 2.7 um component leaches away from the roughest terrain with the steepest slopes and is reworked/migrates to lower upland areas. Physical action causes these materials, including dissolved 2.7 um component material to be redeposited and eroded into the upland bajada margins, coating the basins with Equatorial Bright gravels and muds containing also the 2.7 um component. In some areas, the finer ice sand particles saltate and become coated in the 2.7 um component, becoming mobile dark brown dune sands. Finally, the 2.7 um absorbing component is redeposited in the depths of the basin trenches through fluvial action and percolation, possibly through dissolution and precipitation on concentration (drying).
In this scenario, the amount of 2.7 um material that is washed from the bright terrain eventually ends up in the depths of the basins deepest channels.
The unit found in the deep channels with the lowest 2.7/2.8 ratio will be referred to as the deep black unit.
If this scenario is correct, we could also expect the 2.7 um absorbing material to be one component found in the depths of Titans polar lakes, assuming airfall deposition is uniform.
The 2.7 absorbing component is definitely a non-ice material. The images with the 2.7/2.8 ratio thus serve as a non-ice material indicator. Darker areas have a larger concentration of this material. The 2.7/2.8 ratio could be the ChemCam imager for Titan.
Alternatively, the change in the 2.7 um absorbance could be due primarily to atmospheric absorbance at this wavelength. With larger amounts of the air column causing more absorbance. In this case, the 2.7/2.8 ratio becomes a topographic indicator, showing the highest reaches as bright, and the deeper parts of the basins as darker.
In either scenario, the 2.7/2.8 ratio becomes a very useful tool for dissecting Titan.
-Mike
Posted by: Juramike Mar 14 2008, 11:44 AM

|
Here is a cartoon that describes the 2.7 um absorbing material scenario. This is an expansion of the cartoon in Figure 8 of Barnes et al. J. Geophysical Research 112 (2007) E11006.
Atmospheric deposition, dissolution and washout by episodic rains, redeposition in the lowlands and dark blue ice sands, coating and mobilization of dunes, and eventual deposition of dissolved material in the deepest channels in the basins.
-Mike
Posted by: Juramike Mar 15 2008, 03:20 PM
Graphic showing specific localization of units (based on 2.7/2.8 ratio contrast image, the VIMS [1.6, 2.0, 5.0 um] composite, and the ISS[0.94 um] mosaic) and the 2.7/2.8 ratio contrast stretched image:

|
Same graphic vs. ISS image (adapted from PIA 08399):

|
Check out the profound differences in the right part of the two images.
[Differentiation between the two bright gray units was pretty subjective (green unit vs. purple unit), especially in the E part of Quivira]
-Mike
Posted by: Juramike Mar 16 2008, 04:57 AM
Cool!!! I just found one!!!
Dune field cut by a dark channel in the middle of Fensal in the T17 Radar Swath:

|

|
Barnes et al. also mentioned a channel detected by VIMS in the intersection of the T20 VIMs path and the T17 RADAR swath to the W of this location.
This channel shows a dark NW side, and a radar-bright SW side. (I'm assuming RADAR look direction is from the N.)
I'm not sure why the dunes appear darker on the W side of the channel compared to the E side. Further to the W the dunes go back to being "brighter".
This channel was found by following the deep black unit channel path in Fensal observed in Ugordan's 2.7/2.8 ratio image.
-Mike
Posted by: ngunn Mar 16 2008, 05:14 PM
Are you sure it's not the interdune substrate that is different there, rather than the dunes themselves?
The question of channels intersecting dunes and how exactly that works is, I feel, a crucial 'window' on the vexed question of relative timescales for Titan's active processes. Are we to picture occasional river-like floods cutting through a dunefield (perhaps by undermining the permeable dune material) or are these just examples of how a dunefield looks when superposed on a plain with pre-existing channels? We need more examples!
Posted by: Juramike Mar 18 2008, 03:45 AM
The reason I was digging around in this area was to try to figure out the nature of the "purple" unit terrain.
This particular area in N Fensal is special in that it has a nice VIMS overlap at all the wavelengths, a good ISS mosaic, and has both the T17 and T25 RADAR swaths overlapping the region. It is located at approximately [5N, 35W] in N Fensal. (This area can also be seen in the far right edge in Figure 5 of the Barnes et al text on Dune VIMS.)
This small area is also special in that most of the major units are all in this area: deep black, dark brown dune sands, equatorial bright, and the strange 2.7 um bright "purple unit".
I've correlated the ISS, Ugordan's VIMS (2.0, 2.7/2.8) composite view, and the RADAR T17/T25 swath views in this area. The red border shows the RADAR overlap trace.

|

|

|
The yellow bordered region indicates a very low lying equatorial bright unit that appears pitted. It looks like the "rotten terrain" described earlier. The orange bordered area indicates the "Purple unit terrain". I'm defining the purple unit terrain as having a very high 2.7/2.8 ratio.
Interestingly, the RADAR dark channel canyon sits right at the contact between the two units, at least to the resolution in these images. There may indeed be different substrates on either side of the canyon, as Nigel suggested.
-Mike
Posted by: Juramike Mar 18 2008, 03:46 AM
And here is an unannotated view of Ugordan's VIMS composite and the T17/T25 RADAR mosaic for comparison:

|
-Mike
Posted by: Juramike Mar 21 2008, 06:39 PM

|
The graphic above shows a rough assignment of the spectral units in the T17/T25 overlap region. There are two types of islands that both seem to be made of Equatorial Bright unit material. These two types of islands differ in their morphology. The pattern of dunes on the upwind side might be used in infer topography.

|
One type of island, seen in the SE area of the T17/T25 overlap region, appears to have a sharp western (upwind) margin, and also has dunes that diverge around the Western edge of the island. (These islands look like they were shapes put into a wind tunnel with laminar smoke added to visualize airflow.) Right at the margin, the dunes disappear. It seems likely that these islands are steep mesas that thrust up out of the basin. The observed dune pattern may be due to wind hitting the abrupt edge of the mesa, piling up and quickly flowing around the obstacle. (Just like the snow hole carved at the base of a tree in the snow after a blizzard.) The abrupt edge messes up the dune forming winds. The smooth deposition of dune sands appears smooth and thus RADAR dark. On the lee side of the mesa, the dunes recombine well downwind of the eastern margin.
The other type of island, seen in the NW area of the T17/T25 overlap region, has a pitted and embayed western (upwind) margin. The dunes on the western side are parallel right up to the edge of the island. On the eastern side (downwind) the parallel dunes seem to form immediately at the edge of the feature. It seems likely that this is a very low-lying atoll-like island. The dune forming winds go right up and over the flat low-lying island. It may be possible that there is a small amount of dune sands that are lying on top of this surface as well, or small areas of the atoll where dune sands may try to form. The radar reflectivity of the atoll-like basin islands seems slightly dimmer than the brighter mesa islands. This material is full of small pits and irregularities and looks like the "rotten terrain" previously described.
-Mike
Posted by: Juramike Mar 21 2008, 06:49 PM
Here is a zoomed image of the SE area bright equatorial islands (steep tall Mesa-like morphology) with the diverging western dunes indicated. And same image unannotated.

|

|
-Mike
Posted by: Juramike Mar 21 2008, 06:51 PM
Here is a zoomed image of the NW bright equatorial islands (low, flat topography - Atoll-like) with the parallel western dunes indicated, and the same image unannotated.

|

|
-Mike
Posted by: scalbers Mar 21 2008, 07:58 PM
Pretty remarkable evidence of a Titan subsurface liquid water & ammonia ocean is discussed here:
http://saturn.jpl.nasa.gov/news/press-release-details.cfm?newsID=826
P.S. Sorry, I discovered this topic is covered in another thread after posting - though the cat is out of the bag now
Posted by: ugordan Mar 21 2008, 08:01 PM
And http://www.unmannedspaceflight.com/index.php?showtopic=5025...
Powered by Invision Power Board (http://www.invisionboard.com)
© Invision Power Services (http://www.invisionpower.com)