Titan's Equatorial Sand Seas |

Titan's Equatorial Sand Seas |
 May 7 2007, 03:53 PM May 7 2007, 03:53 PM
Post
#1
|
|||||||
 Senior Member  Group: Moderator Posts: 2785 Joined: 10-November 06 From: Pasadena, CA Member No.: 1345 |
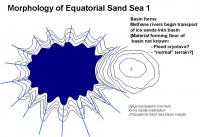
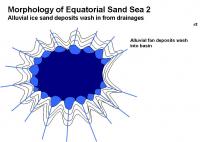
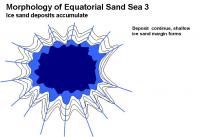
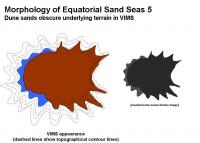
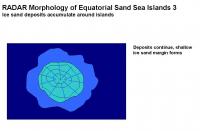
Ive put together a sequence of events that could explain the morphology of the Equatorial Sand Seas. (An example basin similar to Shangri-La is shown)
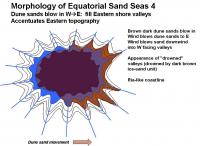
This could explain the ria-like topography [http://en.wikipedia.org/wiki/Ria] on the Eastern shore, as well as the VIMS dark blue western parts of the Sand seas, and the placement of the dark brown unit on the Eastern parts of the sand seas. 1. Basin formation. 2. Water-ice sand deposition [slowly, suddenly?] forms an ice-sand margin 3. Mobile dark brown dune sands deposit on E side, depositing inland up W facing valleys.
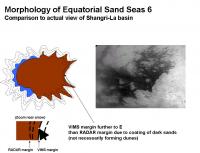
:attachment] The dark brown sands will blow in following the predominantly W winds and make a dust coating on low-lying terrains on the eastern margins. This will be visible by VIMS and ISS as the dark-bright margin, placed inland from the "real margin" and will accentuate the local topography as seen by optical instruments. This accentuation on the E margin will make the Equatorial Sand Sea visible margin look swoopy and windblown (in effect, it is) from the dark basin. Similarly, the W margin will have a dark blue zone that appears blown from the western bright areas. On the Eastern shore, the RADAR images will place the smooth-dark/mottled gray boundary far to the W of the VIMS brown dark-bright margin. (RADAR should be able to penetrate a thin coating of dark sands). The features in the limbo zone have been covered by dark sands, perhaps not enough to form dune structures, but enough to cover up the ice-sand margin, the near shore terrain, and perhaps even some of the underlying bright terrain. This makes the deposition sequence in the Equatorial Sand Seas: 1: Basin formation 2. Major water ice sand emplacement 3. Dune sands cover up low-lying downwind valleys (enough to mask visible imagery) Other Equatorial Sand Sea basins should look very similar around Titan: Shangri-La, Belet, Senkyo, Fensal and Quivra. Local winds may play a bonus role, but the overall trend of dark sand deposition up valley should be towards the E. For example: the false-color image in Figure 6 of the Soderblom paper seems to imply a predominant wind vector in Fensal and Quivra to the ESE. [Im pretty sure all this has been described in pieces before, but it gave me a really great excuse to play with PowerPoint.  ] ]-Mike
Attached thumbnail(s)
-------------------- Some higher resolution images available at my photostream: http://www.flickr.com/photos/31678681@N07/
|
||||||
 |
 
|
||||||
 |
|
May 8 2007, 11:44 PM
Post
#2
|
|||||||
|
Senior Member Group: Moderator Posts: 2785 Joined: 10-November 06 From: Pasadena, CA Member No.: 1345 |
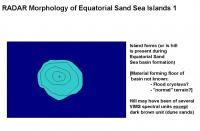
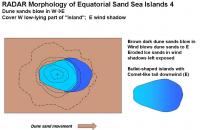
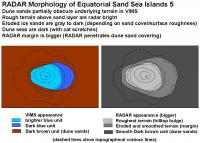
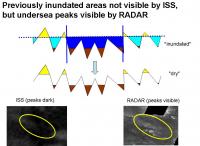
Ive put together another hypothetical series of events that could explain the RADAR appearance of many of the islands seen in the Equatorial Sand Sea.
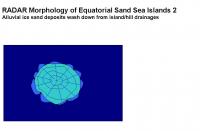
1. Hill/ridge formation, either before or after the Sand Sea basin forms or is partially filled in. 2. Water ice sand erodes off the hill, forming a debris apron or ice sand margin. 3. Mobile dark brown dune sands deposit on E side, but dont fill in downwind (E) in the wind shadow of the island.
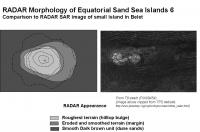
:attachment] This could explain the bullet-shaped appearance of the islands (or ridges) and the ghost-like tails that stretch downwind, usually towards the E. Other tectonic features, like grabens, would also show similar features. The relative height of the island above the equatorial dune sand level partly determines its appearance. Lower islands may not suffer erosion if they are covered by dune sands, so they may have a small or non-existant debris apron.. RADAR will penetrate the obscuring dune sands deeper, so the islands will appear bigger by RADAR than by VIMS or ISS. The eastern side of the island will have dark blue ice sands extending to the E as a tail. This may be visible in VIMS imaging until eventually obscured by a coating of dark brown unit dunes. The islands and features in all the Equatorial Sand Sea basin should look very similar. Islands and ridges in Shangri-La, Belet, Senkyo, Fensal and Quivra should all share a similar appearance. Many of the island ridges may have started out as tectonic features, like parallel ridges (as observed to the W of the Huygens landing area), or hummocks poking out of the basin. As an example, I pulled a RADAR image out of the T8 swath (PIA08454) {Actually, I used the image from TPS, for some reason it was clearer on my computer} -Mike
Attached thumbnail(s)
-------------------- Some higher resolution images available at my photostream: http://www.flickr.com/photos/31678681@N07/
|
||||||
|
|
|
||||||
|
May 9 2007, 02:39 PM
Post
#3
|
|
|
Senior Member Group: Members Posts: 3516 Joined: 4-November 05 From: North Wales Member No.: 542 |
Just in case you're wondering Mike I'm following your posts here with interest. It bothers me that if the prevailing winds are all one way there is still so much dune material out in the open that hasn't made it all the way to western side of a high obstacle by now. Either the wind reverses sometimes or the dune material is occasionally carried right over the 'continents' (without sticking) by exceptional gales. Also, what happens to a dune in a deluge? Shouldn't there be some dunes visibly damaged by flooding? Have we seen that anywhere? Does flooding somehow 'wipe the slate' from dark brown back to dark blue? Too many questions!!! I think we might answer some of them by following the Huygens flood deposits both upstream to their source and downstream to the first appearance of dune material, preferably with all of SAR, ISS and VIMS.
|
|
|
|
|
May 9 2007, 02:51 PM
Post
#4
|
|
|
Rover Driver Group: Members Posts: 1015 Joined: 4-March 04 Member No.: 47 |
I think a massive rain storm around the equator might be useful in that respect to shake things up a bit. I'm thinking equinox here
 Let's hope all is still working and funded by then (only 2.5 more years!) Let's hope all is still working and funded by then (only 2.5 more years!)
|
|
|
|
|
May 9 2007, 05:35 PM
Post
#5
|
|
|
Senior Member Group: Moderator Posts: 2785 Joined: 10-November 06 From: Pasadena, CA Member No.: 1345 |
QUOTE (ngunn @ May 9 2007, 10:39 AM)  Also, what happens to a dune in a deluge? Shouldn't there be some dunes visibly damaged by flooding? Have we seen that anywhere? Does flooding somehow 'wipe the slate' from dark brown back to dark blue? Those are excellent questions. I'm trying to find RADAR images where an obvious stream crosses over either VIMS brown dark unit material or VIMS dark blue unit material. If flooding does 'wipe the slate' from dark brown back to dark blue, I would expect to observe large dark blue margins in some areas along the Eastern shores. (as well as Northern, Southern, and Western shores - but the W ice sand margin is most susceptible to being covered up by windblown dune sands) But we don't see any large ice sand margins in the E. So the dune sand movement apparently happened AFTER the last major dark blue margin flood deposition event. -Mike -------------------- Some higher resolution images available at my photostream: http://www.flickr.com/photos/31678681@N07/
|
|
|
|
|
May 9 2007, 05:55 PM
Post
#6
|
|
|
Member Group: Members Posts: 153 Joined: 14-August 06 Member No.: 1041 |
QUOTE (ngunn @ May 9 2007, 08:39 AM) Just in case you're wondering Mike I'm following your posts here with interest. It bothers me that if the prevailing winds are all one way there is still so much dune material out in the open that hasn't made it all the way to western side of a high obstacle by now. Either the wind reverses sometimes or the dune material is occasionally carried right over the 'continents' (without sticking) by exceptional gales. Very good questions. On earth, we definitely find 'prevailing drift' patterns to the east or west of mountains - even small hills. Another factor to consider is the information released by NASA/Ciclops about the circulation of Saturn today. The atmosphere is flip-flopped from prior models - the 'dark bands' are thought to be drawn up from the deeper layers, while the 'light bands' are thought to originate in the upper atomosphere. This has application to Titan, if it is assumed the Dark bands of Saturn have the same or similar composition to the dark surface features of Titan. Is atmospheric chemistry on Titan a major or minor contributor to the color patterns we see on the surface? |
|
|
|
|
May 10 2007, 07:15 PM
Post
#7
|
|
 Senior Member Group: Moderator Posts: 3233 Joined: 11-February 04 From: Tucson, AZ Member No.: 23 |
QUOTE (Juramike @ May 8 2007, 04:44 PM) Ive put together another hypothetical series of events that could explain the RADAR appearance of many of the islands seen in the Equatorial Sand Sea. 1. Hill/ridge formation, either before or after the Sand Sea basin forms or is partially filled in. 2. Water ice sand erodes off the hill, forming a debris apron or ice sand margin. 3. Mobile dark brown dune sands deposit on E side, but dont fill in downwind (E) in the wind shadow of the island. Yep, that's just about right! -------------------- &@^^!% Jim! I'm a geologist, not a physicist!
The Gish Bar Times - A Blog all about Jupiter's Moon Io |
|
|
|
|
May 10 2007, 11:00 PM
Post
#8
|
||||||
|
Senior Member Group: Moderator Posts: 2785 Joined: 10-November 06 From: Pasadena, CA Member No.: 1345 |
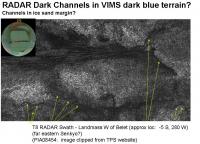
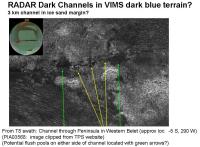
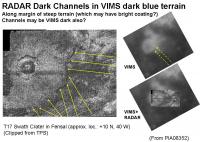
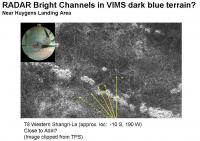
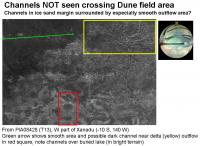
There are a few examples of both RADAR dark and RADAR bright channels lying on top of (presumably) VIMS dark blue deposits in the Equatorial Sand Seas.
These are shown here (channels indicated by yellow arrows):
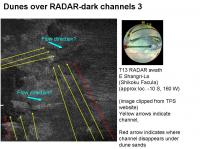
I was not able to find any examples of a dune field clearly cut through by a channel (either bright or dark). The area near western Xanadu in the T13 RADAR swath shows a large delta complex that feeds into the Shangri-La. A channel may be barely visible, but it does not cut through a dune area located to the W. The dark smooth area may be where a broad outflow fan of ice sands was deposited, then overlain by dune seas. This is shown below (delta indicated inside yellow box, potential channel/outflow fan with green arrow):
So it appears that RADAR-dark channels and RADAR-bright channels overlay dark blue ice sands, but not dark brown dune sands. So deposition sequence (first to last): 1) Dark blue ice sands 2) Channels (RADAR-bright/RADAR-dark) 3) Dark brown dune sands This also implies that the dark blue ice sands are not always infinitely permeable to liquid. They can support a stream, at least in some locations. This is very similar to wet terrestrial sand. Perhaps the dark blue ice sands are almost saturated with liquid, or perhaps they have a slight barrier to the liquid (semi-permeable crust). Perhaps in most locations, a small decent-sized flow can soak in, but a massive flood event will scour across the surface for a distance. In some areas, permeability is locally reduced, and even normal amounts of flow will course across the surface. Since a massive feeder network of channels and ponds is not observed, rain must be able to soak into the sands to some extent. (Impermeable dirt would quickly create an eroded out network.) At the Huygens landing area, there are large and small channels visible in the straights off the island. There are also streams that flow off the island into the dark area. But I could not discern a connecting channel between the channels in the straight, and the outflow of the streams coming off the island. The outflow from the island streams seems absorbed by the dark blue ice sands. Perhaps the channels were carved during major flood events, presumably from the flow coming down the straight (SW to NE) and not from the island streams. From the available data so far, RADAR-bright channels streaking across the ice-sands are not common. This implies that the equatorial sand seas are relatively flat. Irregular rough (RADAR bright) boulders cannot be supported by gradual slopes. The fact that we do observe channels does imply a slight change in elevation, so the Sand Seas are not totally flat. Further analysis should be able to determine flow direction (thus topography). -Mike -------------------- Some higher resolution images available at my photostream: http://www.flickr.com/photos/31678681@N07/
|
|||||
|
|
|
|||||
|
May 11 2007, 07:04 PM
Post
#9
|
|
|
Senior Member Group: Members Posts: 3516 Joined: 4-November 05 From: North Wales Member No.: 542 |
QUOTE (Juramike @ May 11 2007, 12:00 AM) So deposition sequence (first to last): 1) Dark blue ice sands 2) Channels (RADAR-bright/RADAR-dark) 3) Dark brown dune sands -Mike Nice work, Mike. However I would propose an alternative caption to your 1 2 3 list as follows: "Titan surface features in decreasing order of formation timescale:" My reasoning is that the active processes involved are probably all concurrent over the long term. All that's needed to produce the apparent sequence is for the massive outwash floods to be very infrequent compared with 'ordinary' channel-forming rains and dune movement. I'm not even sure about the dunes coming third. Have you found any dunes that have drifted across (and blocked) a channel? |
|
|
|
|
May 11 2007, 07:34 PM
Post
#10
|
|
|
Senior Member Group: Moderator Posts: 2785 Joined: 10-November 06 From: Pasadena, CA Member No.: 1345 |
QUOTE (ngunn @ May 11 2007, 03:04 PM) Nice work, Mike. However I would propose an alternative caption to your 1 2 3 list as follows: "Titan surface features in decreasing order of formation timescale:" Ah, perfect: that the key phrase I was trying to come up with. Thanks! All these process are occuring either simultaneously or episodicaly. From any given point, I'm asking "What is the last event that happened here to make it look this way?" For example: a particular area may have had decades of stream deposition with dunes covering them at the same time, but then a massive flood came along and erased evidence of both of these events. As for dunes covering over channels, I have not yet found any that clearly cut across a dark channel. (Anyone else seen one?) -Mike -------------------- Some higher resolution images available at my photostream: http://www.flickr.com/photos/31678681@N07/
|
|
|
|
|
May 11 2007, 09:46 PM
Post
#11
|
||||
|
Senior Member Group: Moderator Posts: 2785 Joined: 10-November 06 From: Pasadena, CA Member No.: 1345 |
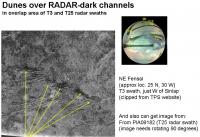
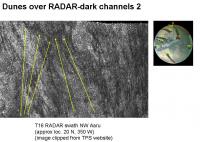
Here are some images and locations where dunes have partially buried a channel:
In the RADAR images of some of the dark channels in an earlier post (#8, above), dunes can be seen at the terminus of the channel. I was not able to find any images where a channel was blocked by dunes, and then the channel was clearly modified by the blocking dune. It appears that dune deposition is the "more-often happening event". The dunes are mobile. Or at least more mobile than the channels. -Mike -------------------- Some higher resolution images available at my photostream: http://www.flickr.com/photos/31678681@N07/
|
|||
|
|
|
|||
|
May 11 2007, 10:08 PM
Post
#12
|
||
|
Senior Member Group: Moderator Posts: 2785 Joined: 10-November 06 From: Pasadena, CA Member No.: 1345 |
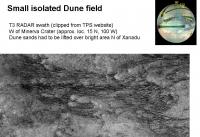
Here is an example of a smaller isolated Dune Sea. This is a smaller area to the W of Minerva Crater in an area North of Xanadu. It is bounded to the W by a bright area (continent? highland?) that presumably should block any sands from entering the basin.
Since there is a sand sea present, either: A. Sand can go over the bright areas. B. Sand can be washed in from bright areas. C. Sand occasionally comes from other directions, but the prevailing flow is generally W. (In this case the basin would be a sand trap) There are several (flat?) RADAR-darker areas in Xanadu that do not have cat-scratch dune fields. This implies that either the RADAR-bright material covers or modifies the sands, or that the sands are not able to flow over large continental masses. Gee, I wonder what is the nature of the bright material? -Mike -------------------- Some higher resolution images available at my photostream: http://www.flickr.com/photos/31678681@N07/
|
|
|
|
|
|
|
May 12 2007, 03:10 AM
Post
#13
|
|
 Senior Member Group: Members Posts: 1281 Joined: 18-December 04 From: San Diego, CA Member No.: 124 |
Thanks for all the awesomeness, Juramike
-------------------- Lyford Rome
"Zis is not nuts, zis is super-nuts!" Mathematician Richard Courant on viewing an Orion test |
|
|
|
|
May 12 2007, 03:40 PM
Post
#14
|
|
 Member Group: Members Posts: 611 Joined: 23-February 07 From: Occasionally in Columbia, MD Member No.: 1764 |
QUOTE (Juramike @ May 11 2007, 03:34 PM) As for dunes covering over channels, I have not yet found any that clearly cut across a dark channel. (Anyone else seen one?) -Mike Wish I had as much time to spend on analysing the Cassini data as you do! Between Cassini observation planning and the Titan flagship study (presentation to OPAG should go up on the OPAG website in due course), I'm barely managing to read all the posts..... I think in the bright area to the East of Menrva on T3 (with all the anabranching channels) you will see a couple of faint dark streaks on the bright oval, suggesting these are dunes that are superposed on a fluvial basin... |
|
|
|
|
May 12 2007, 07:35 PM
Post
#15
|
|
|
Senior Member Group: Members Posts: 3516 Joined: 4-November 05 From: North Wales Member No.: 542 |
Mike, in your first illustration in post 11 (for example) I'm not quite sure what sequence of events is evidenced. Where your upper yellow arrows are pointing the dune pattern, including whatever constitutes the inter-dune surface, certainly continues uninterrupted. However it's not clear that the dark channel was continuous at this point until being buried by the dunes. Where the lower arrows are pointing is very interesting though. I can persuade myself that I am seeing a very narrow channel that has been 'recut' through the ends of the dunes. It would be interesting to look for more like that. (I'm sure you will!)
|
|
|
|
|
May 12 2007, 08:01 PM
Post
#16
|
|
|
Senior Member Group: Members Posts: 3516 Joined: 4-November 05 From: North Wales Member No.: 542 |
[quote name='rlorenz' date='May 12 2007, 04:40 PM' post='90040']
Titan flagship study (presentation to OPAG should go up on the OPAG website in due course) A b&w printout thereof is already on my coffee table. It's a lot easier to read than the Europa one if, like me, one isn't well versed in the latest management and planning jargon. quote: I'm barely managing to read all the posts.....  Thanks again for contributing here. Thanks again for contributing here.
|
|
|
|
|
May 13 2007, 09:23 PM
Post
#17
|
|
|
Junior Member Group: Members Posts: 40 Joined: 11-November 05 Member No.: 550 |
I stumbled a publication (PDF) entitled: 'Comparative Sediment Transport By Flowing Liquid on Earth, Mars and Titan: Synthesis Of Theory And Observations'
It could be of some interest, although you probably already know about it. However, it's the first time I have seen it.... |
|
|
|
|
May 13 2007, 09:28 PM
Post
#18
|
|
|
Junior Member Group: Members Posts: 40 Joined: 11-November 05 Member No.: 550 |
I stumbled upon a publication, rather.
|
|
|
|
|
May 13 2007, 10:28 PM
Post
#19
|
|
 Member Group: Members Posts: 723 Joined: 13-June 04 Member No.: 82 |
^link?
Bill |
|
|
|
|
May 13 2007, 11:00 PM
Post
#20
|
|
|
Junior Member Group: Members Posts: 40 Joined: 11-November 05 Member No.: 550 |
http://www.lpi.usra.edu/meetings/lpsc2007/pdf/2222.pdf
I'm new to all this linking stuff...let's see if I got it right.... |
|
|
|
|
May 14 2007, 03:00 PM
Post
#21
|
|||||||||||
|
Senior Member Group: Moderator Posts: 2785 Joined: 10-November 06 From: Pasadena, CA Member No.: 1345 |
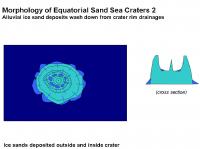
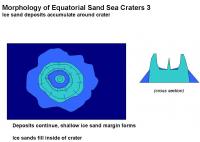
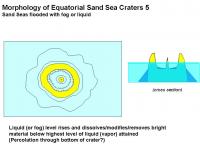
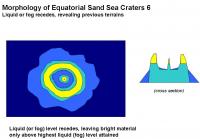
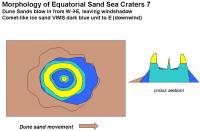
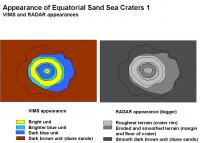
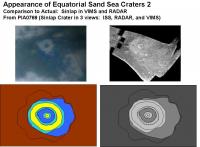
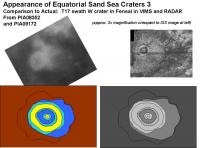
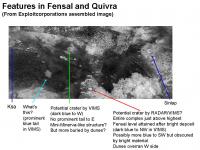
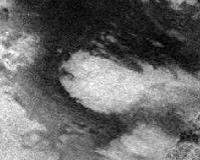
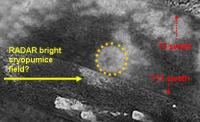
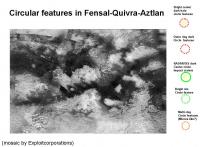
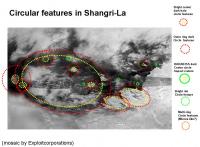
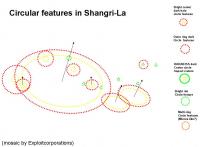
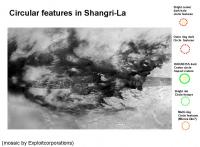
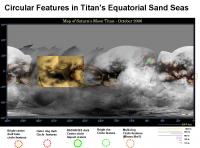
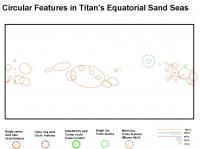
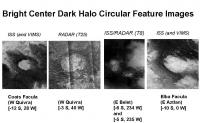
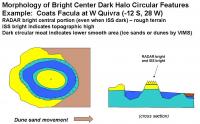
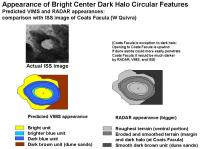
Ive put together a hypothetical sequence that could explain the RADAR and VIMS appearance of the craters observed in the Equatorial Sand Seas. (Craters such as Sinlap, the T17 swath crater in W Fensal, and Guabonito). This sequence also explains the puzzling appearance of the bright material which highlights the crater rims and central peaks.
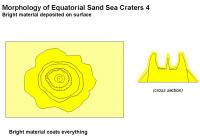
1. Crater forms, either before or after the Sand Sea basin forms or is partially filled in.. 2. Water ice sand erodes on outside of crater, forming a debris apron or ice sand margin. 3. Bright material is deposited. 4. Liquid or fog percolates up to a set topographic level at the crater. All bright material below this line (highest sea level) is dissolved/modified/washed away. 5. The liquid (fog) level retreats, leaving crater high and dry and revealing previous units. 6. Mobile dark brown dune sands deposited on W side, but dont fill in downwind (E) in the wind shadow of the crater. Here are some examples of what we would expect to observe from this scenario, compared to actual VIMS and RADAR images:
This nicely explains the bright material deposited on the rim of the crater, but not on the blue ice sand margins (in some of the craters like Sinlap). It also explains the bright deposit on the central peaks of Sinlap, as well as on the central peak of the crater-shaped feature NE of the Huygens Landing Site (seen in ISS).. The key to this sequence is that the bright material was deposited BEFORE the last major sea level rise. It is possible that each item in the sequence is periodic, rather than a one time deal. So the deposition of bright material is episodic and rare, floods are less rare, and dune sands move quite often. The bright/dark line around the Equatorial Dune Seas are fixed by the last major sea level height attained in that basin after bright material was deposited. Craters that formed environments that were eventually deeply flooded will have a significant light blue and dark blue sand ice margin that extends outside the brightest material deposit (especially to the W). They will have a bulls-eye pattern in VIMS. Those craters that formed in areas that were only slightly covered in liquid at its highest point will have a very small blue ice sand margin that extends beyond the bright material these will have a very asymmetric look in VIMS (strong trailing to the E). Some craters were never inundated and thus would only have bright material covering the entire crater complex these may not show up by VIMS, only by RADAR. Craters that formed in what was eventually a deep liquid environments include Sinlap, the Western T17 RADAR swath crater in Fensal, and Guabonito. Craters that fomed in an enviroment that was eventually shallowly covered in liquid include Minerva, and the crater(?) that is on the W tip of Quivra (seen in the T25 RADAR swath) Craters that formed in environments that were never inundated include the crater on the N end of Shikoku Faculae. (not obvious in ISS, but seen in RADAR). By this analogy, Fensal is deeper than Aztlan. And Shangri-La nearest Xanadu is deep (subduction?) and Shangri La is very shallow near its contact with Adiri. In general, areas with steep shorelines (highest level attained after the last bright stuff deposition event) will have fewer indentations and have a smoother light/dark border (i.e. Xanadu). Areas with shallow shores with relative highest topography closest to highest sea level height will have very jagged and irregular bright/dark borders (ancient bright stuff/liquid shorelines). From this we would predict that average elevation of Adiri is very close to the highest attained level. It may be an area that has been gently upwarped to a level just slightly above the highest attained sea level in Shangri-La basin after the last bright stuff deposition event. The bright island at the Huygens Landing Site sits just above the level of the highest level of liquid attained in Shangri-La after the last bright stuff deposition event. The bright/dark contact line of the highland sits at the highest level of liquid attained in the Shangri-La basin. In the channel some of the sand bars have bright material deposited on them. This should allow us to link the two units. The bright stuff on the sand bars would also be just poking above the highest level of liquid attained in the Shangri-La basin after the last bright stuff deposition event.. The analogy of the Great Basin of North America, painted white, and then flooded with a Glacial Lake Bonneville amount of turpentine and then drained seems pretty close. (Possibly very close chemically). -Mike -------------------- Some higher resolution images available at my photostream: http://www.flickr.com/photos/31678681@N07/
|
||||||||||
|
|
|
||||||||||
|
May 14 2007, 06:30 PM
Post
#22
|
||
 SewingMachine Group: Members Posts: 316 Joined: 27-September 05 From: Seattle Member No.: 510 |
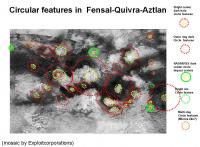
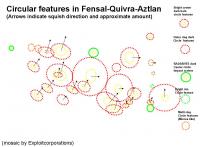
This seems like as good a place as any to deposit this experiment, rather than resurrecting the old map thread. This is a largely cosmetic retooling of the Fensal-Aztlan portion of the global map with the currently released SAR swaths overlain (T3. T13, T16, T17, T25). The resolution here is barely decent enough to make out the dunes in places, but it gives a pretty good indication of what sort of mapping products will be possible from these growing datasets.
-------------------- ...if you don't like my melody, i'll sing it in a major key, i'll sing it very happily. heavens! everybody's all aboard? let's take it back to that minor chord...
Exploitcorporations on Flickr (in progress) : https://www.flickr.com/photos/135024395@N07/ |
|
|
|
|
|
|
May 14 2007, 06:40 PM
Post
#23
|
|
|
Senior Member Group: Moderator Posts: 2785 Joined: 10-November 06 From: Pasadena, CA Member No.: 1345 |
Wow! Thank you, Exploitcorporations!
(Looks like I muffed the image of the VIMS inset of the T17 W Fensal crater. I thought it was the crater at the north nortwest end of your image (it just got missed by the T17 swath, although the southern debris apron might've gotten picked up). I should have grabbed the image of the crater much further to the W. It's interesting how those two craters look fairly similar with a slight "wing" off the NW part of the crater.) I would predict that when this "bulls-eye crater" is imaged by RADAR SAR, that it will look very similar to the T17 W Fensal crater, and to Sinlap crater (but possibly with an even bigger apron). -Mike -------------------- Some higher resolution images available at my photostream: http://www.flickr.com/photos/31678681@N07/
|
|
|
|
|
May 14 2007, 07:06 PM
Post
#24
|
|
|
Rover Driver Group: Members Posts: 1015 Joined: 4-March 04 Member No.: 47 |
simply...wow! amazing how sharp it is!
|
|
|
|
|
May 14 2007, 07:44 PM
Post
#25
|
|
|
Senior Member Group: Moderator Posts: 3233 Joined: 11-February 04 From: Tucson, AZ Member No.: 23 |
QUOTE (Juramike @ May 14 2007, 11:40 AM) I would predict that when this "bulls-eye crater" is imaged by RADAR SAR, that it will look very similar to the T17 W Fensal crater, and to Sinlap crater (but possibly with an even bigger apron). -Mike What crater? Are you talking about the feature that you thought was Ksa? -------------------- &@^^!% Jim! I'm a geologist, not a physicist!
The Gish Bar Times - A Blog all about Jupiter's Moon Io |
|
|
|
|
May 14 2007, 08:22 PM
Post
#26
|
||
|
Senior Member Group: Moderator Posts: 2785 Joined: 10-November 06 From: Pasadena, CA Member No.: 1345 |
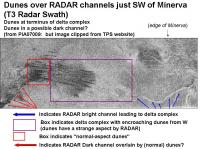
QUOTE (rlorenz @ May 12 2007, 11:40 AM) Wish I had as much time to spend on analysing the Cassini data as you do! (I think when the boss-man finds out, I'm doomed!  ) )But thank in advance for all your suggestions, input , and helpful guidance when you are able! QUOTE (ngunn @ May 12 2007, 03:35 PM) However it's not clear that the dark channel was continuous at this point until being buried by the dunes. The perfect "smoking gun" SAR RADAR image would have a N or S flowing channel which is either cut by or cuts into the E-->W flowing dune features. I haven't found this yet. [Odd, I'm kinda suspecting that most tectonic features seem to trend E-W in the equatorial zone]. Based on Dr. Lorenz's suggestion, I found an interesting are to the SW of Minerva that consists of a bright stream (pretty much originating at the outer wall of the crater) that feeds into a delta complex that is being encroached upon by dunes. (Or is the delta encroaching the dune field? based on the sharpness of the dunes lines at the E edge, I think it is the dunes encroaching upon the delta). These dunes have a funky look. Further to the SW it appears to be a channel with dunes lying across a RADAR-dark channel. Here is the annotated image:
Is the RADAR-dark channel continuous (in this location or the other locations)? I really can't say, but I would strongly speculate that the dunes are lying on top of a continuous dark channel. -Mike P.S. "Anabranch" is my new word for the day! -------------------- Some higher resolution images available at my photostream: http://www.flickr.com/photos/31678681@N07/
|
|
|
|
|
|
|
May 14 2007, 09:15 PM
Post
#27
|
||
|
Senior Member Group: Moderator Posts: 2785 Joined: 10-November 06 From: Pasadena, CA Member No.: 1345 |
QUOTE (volcanopele @ May 14 2007, 03:44 PM) What crater? Are you talking about the feature that you thought was Ksa? The RADAR image in my post is of Ksa (I got that one right). The ISS image (which I thought was Ksa, but it is not) is of the feature at center top mentioned in the second image of your previous post. I've indicated some of these features in a section clipped from the wonderful mosaic posted today (thanks, again!) by Exploitcorporations:
In Figure 6 of the Soderblom et al paper "Corellations between Cassini VIMS spectra and RADAR SAR images: Implications fo Titan's surface composition and the character of the Huygens probe landing site", this feature in the VIMS processing to make Figure 6 has a very small blue ring around it. (I'd also argue that his larger buddy to the E also looks similar). I suspect that this is a very low-lying crater (old?) that when eventually imaged by RADAR will look like a miniature version of Minerva. (Mini-Minerva?). To the SW is an interesting feature that also has a blue tail in VIMS, but seems relatively dim by ISS. Could this be another type of feature (cryovolcano?) or a very low-lying crater that did not get a large dusting of bright material or suffered only partial scrubbing? Can't wait for more RADAR! -Mike -------------------- Some higher resolution images available at my photostream: http://www.flickr.com/photos/31678681@N07/
|
|
|
|
|
|
|
May 14 2007, 09:29 PM
Post
#28
|
|
|
Senior Member Group: Moderator Posts: 3233 Joined: 11-February 04 From: Tucson, AZ Member No.: 23 |
hmm, I suspect that the feature you thought was Ksa is actually a Ganesa-type cryovolcano, with a flow to the east and north...
-------------------- &@^^!% Jim! I'm a geologist, not a physicist!
The Gish Bar Times - A Blog all about Jupiter's Moon Io |
|
|
|
|
May 14 2007, 09:40 PM
Post
#29
|
|
|
Senior Member Group: Moderator Posts: 2785 Joined: 10-November 06 From: Pasadena, CA Member No.: 1345 |
Are there easy ways to discern between a cryovolcano and an impact feature?
-Mike -------------------- Some higher resolution images available at my photostream: http://www.flickr.com/photos/31678681@N07/
|
|
|
|
|
May 14 2007, 09:56 PM
Post
#30
|
|
|
Senior Member Group: Moderator Posts: 3233 Joined: 11-February 04 From: Tucson, AZ Member No.: 23 |
Well, it would be nice if it erupted. That would make it much easier
 To be honest, it would require a good ISS/VIMS observation of Ganesa to determine what a Ganesa-type feature looks like in VIMS and ISS images. My basis for saying, at the very least, to hold off on declaring that feature a crater, is that while it is circular, there are a number of other ways to form circular features, like the Ganesa-type pancake dome. The apparent flow to the east and north and the fact that it doesn't match the appearance of other dark terrain craters (Guabonito, Sinlap, Velas, and the guy north of Adiri), with very dark interiors, intermediate albedo crater walls, and bright raised rims/ejecta blankets also suggest that we should serious consider a cryovolcanic origin for this feature. But, I'll admit the evidence is about as conclusive as Tortola Facula (the VIMS snail from Ta) being a cryovolcano. -------------------- &@^^!% Jim! I'm a geologist, not a physicist!
The Gish Bar Times - A Blog all about Jupiter's Moon Io |
|
|
|
|
May 17 2007, 06:43 PM
Post
#31
|
|
|
Senior Member Group: Moderator Posts: 2785 Joined: 10-November 06 From: Pasadena, CA Member No.: 1345 |
Hmmm. Actually, there might be a way to see a recently erupted cryovolcano, at least in the dark basins:
If the hypothetical scenario presented above (post#21) is correct, anything that recently coughed up bright material (ammonium sulfate + other salts?) AFTER the last bright-material-dissolving event should be pretty obvious by VIMS and RADAR. In that case, we would expect a ISS and VIMS stain in the dark basin that would be larger than the RADAR signature. (Older features that had their bases scrubbed should have a smaller ISS and VIMS stain compared to RADAR.) Similarly, any impacts (or bulges that did not release bright salt material) in the dark brown basins after the last bright-material-dissolving event should be dark brown. They should not have any VIMS or ISS bright material on them compared to their surrounding area. Are there any craters visible only by RADAR that appear dark brown by VIMS? -Mike -------------------- Some higher resolution images available at my photostream: http://www.flickr.com/photos/31678681@N07/
|
|
|
|
|
May 18 2007, 01:35 AM
Post
#32
|
||
|
SewingMachine Group: Members Posts: 316 Joined: 27-September 05 From: Seattle Member No.: 510 |
Here's another work in progress. This makeover of the Adiri-Shangri-La regional view is cobbled together from the ISS basemap (10/06), the obligatory SAR swaths (T8/T13), raw frames from the 13 May T30 encounter, the nifty CICLOPS "looking ahead" Celestia mosaics, and a cannibalized 1/64th of Paul McCartney's birthday present. This is presented in the standard Exploitcorporations LLMF Equal-Area Projection ™, so plan on losing your blimp anywhere west of the center of the map.
-------------------- ...if you don't like my melody, i'll sing it in a major key, i'll sing it very happily. heavens! everybody's all aboard? let's take it back to that minor chord...
Exploitcorporations on Flickr (in progress) : https://www.flickr.com/photos/135024395@N07/ |
|
|
|
|
|
|
May 18 2007, 01:48 AM
Post
#33
|
|
|
Solar System Cartographer Group: Members Posts: 10162 Joined: 5-April 05 From: Canada Member No.: 227 |
Very nice. I hope you will do more of these.
Phil -------------------- ... because the Solar System ain't gonna map itself.
Also to be found posting similar content on https://mastodon.social/@PhilStooke Maps for download (free PD: https://upload.wikimedia.org/wikipedia/comm...Cartography.pdf NOTE: everything created by me which I post on UMSF is considered to be in the public domain (NOT CC, public domain) |
|
|
|
|
May 18 2007, 02:09 AM
Post
#34
|
|
|
Member Group: Members Posts: 813 Joined: 29-December 05 From: NE Oh, USA Member No.: 627 |
Exploitcorporations
All your work is breathtaking. Agree with Phil Stooke. Please continue!!!!! Just Wonderful!!!!! Craig |
|
|
|
|
May 18 2007, 03:28 PM
Post
#35
|
|
|
Senior Member Group: Moderator Posts: 2785 Joined: 10-November 06 From: Pasadena, CA Member No.: 1345 |
Wow!! That is totally awesome!!!
I just rearranged my office posters to make room for these!! Thank you for all your efforts to make these images!! -Mike -------------------- Some higher resolution images available at my photostream: http://www.flickr.com/photos/31678681@N07/
|
|
|
|
|
May 21 2007, 08:06 PM
Post
#36
|
||||||
|
Senior Member Group: Moderator Posts: 2785 Joined: 10-November 06 From: Pasadena, CA Member No.: 1345 |
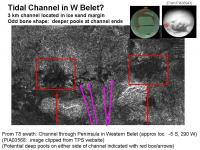
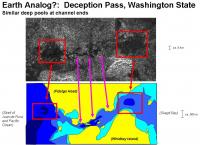
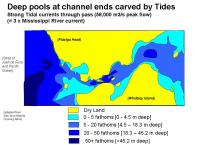
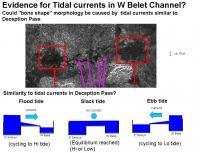
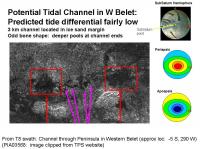
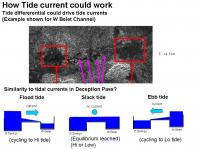
One of the dark channels from the T8 RADAR swath in western Belet (or eastern Senkyo) has a very curious appearance: at both ends of the of the 3 km channel there are RADAR dark smooth areas that is over 25 km2 in size. This symmetrical bone shaped appearance may have resulted from a tidal current flushing back and forth through the channel.
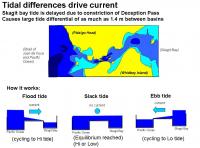
For comparision, I have compared the zoomed RADAR image of the Dark Channel in W Belet with a graphic showing marine topography of Deception Pass in Washington State (Deception Pass Coordinates: 48 degrees 24 23N; 122 degrees 5840 W). Deception Pass is located near the San Juan and Gulf Islands in Washington/British Columbia. This island group was formed through crustal extension and inundation to form an archipelago (sound familiar?). The entire the island group (especially the Gulf Islands of British Columbia) appear morphologically similar to areas on Titan. Deception Pass is notable for having an extremely strong current due to tidal effects. (A Seattle Times article on Deception Pass can be found here.) The way Deception Pass (and by analogy, the W Belet Dark Channel) develops ferocious tides is shown in the graphic below:
1. Tidal bulge reaches from the Pacific Ocean into the Strait of Juan de Fuca. 2. Sea level on the west side of the Pass rises faster than the sea level on the eastern (Skagit Bay) side of the Pass. 3. Height difference of 4.5 feet between the two sides causes eastward flow of 56,000 m3/s water through the channel (for comparison, the Mississippi River average flow is 17,600 m3/s). 4. As the sea levels on either side of the Pass eventually equilibrate, from both water flowing into Skagit Bay from through the Pass, and the longer route around Whidbey Island, the flow through the channel drops to near zero. 5. Tide bulge leaves Pacific 6. Sea level on west side of Pass drops faster than Skagit Bay can empty out. 7. New height differenential sets up, now current flows west (Skagit BayPacific) through Pass (Ebb tide cycling to Lo). 8. Skagit bay sea level drops, sea level differential drops to zero, flow through channel drops to near zero. In the Google Earth image you can actually tell which way the current is flowing when the Google Earth image was taken (Hint: Flood tide into Skagit Bay). The deeper areas at the two entrances to the Pass are swept clean from the current. (The Skagit River dumps a huge amount of sediment into the bay, if the current did not sweep the sediment out to sea, all the topography on the Skagit bay side would become a mudflat, similar to the area at the extreme NE of the Deception Pass graphic). There are other tidal channels in the San Juan Islands that display almost the same pattern of bottom topography: a narrow channel with localized depressions (deeper areas) at both tide channel exits. (Examples include: San Juan Channel; Spieden Channel; Harney Channel; Upright Channel; and Thatcher Pass.) The Dark Channel in western Belet (or eastern Senkyo) is approximately 3 km wide. This is 6x wider than Deception Pass. Using the formula [Flow (m3/sec) = 0.46 X1.61 channel width (m) ^1.22] that was used for other channels on Titan, we arrive at a predicted flow of 13,000 m3/s for the W Belet Dark Channel.. Extrapolating from Deception Pass numbers (Pass width = 500 m), we instead arrive at an extrapolated flow of 336,000 m3/s for the W Belet Dark Channel. Either way, its pretty impressive. Given the relative size of the dark areas at the ends of the channel (>25 km2!), I would be inclined to favor the larger numbers. If this is a tidal channel on Titan, it tells us several very important things. 1. There was a large sea or ocean in this area. 2. The sea or ocean lasted long enough to experience several tide cycles (with a 14 day cycle?) 3. Large flow rates were set up through the tidal channel. 4. The basin on the W is approximately at the same level as the basin on the E (at least the high methane mark) (An alternate possibility to be considered is that the channel is bi-directional and resulted from a single/multiple flood events going from E to W, then later from W to E.) If the deposition sequence put forward in post #21 is correct, we would expect that this channel should appear dark by ISS. I would expect that during the time the channel was inundated, tidal currents would have swept the Dark Channel clear of loose sediments. So this area may be relatively clear of ice sands and windblown dune sands compared to other areas in the Equatorial Dune Seas. If the channel bottom can be resolved by VIMS, the channel itself may be very interesting it may give us a glimpse into the bottom substrate that exists under the dune seas. Im hoping this area gets observed during the upcoming May 31 pass. I wonder if other tidal channels can be found by further examination of RADAR or VIMS images of Titans surface? Could we use these to infer the tidal pattern and current flows of past methane seas on Titan? (Astropaleohydrology?) -Mike -------------------- Some higher resolution images available at my photostream: http://www.flickr.com/photos/31678681@N07/
|
|||||
|
|
|
|||||
|
May 21 2007, 08:19 PM
Post
#37
|
|
 Dublin Correspondent Group: Admin Posts: 1799 Joined: 28-March 05 From: Celbridge, Ireland Member No.: 220 |
Surely Titan's Saturn synchronous orbit would inhibit tides ?
|
|
|
|
|
May 21 2007, 08:34 PM
Post
#38
|
|
|
Senior Member Group: Moderator Posts: 2785 Joined: 10-November 06 From: Pasadena, CA Member No.: 1345 |
QUOTE (helvick @ May 21 2007, 04:19 PM) Surely Titan's Saturn synchronous orbit would inhibit tides ? I woulda thought so, too. But Tokano et al. invoke Titan's orbital eccentricity around Saturn as causing tidal winds on Titan. (Tokano, T; Neubauer, F. M. Icarus, 2002, 158 499-515. "Tidal winds on Titan caused by Saturn." Abstract available here) Their paper is discussing tidal winds in the atmosphere, but their arguments (and diagrams) would also seem to extend to large bodies of fluids on Titan's surface. -Mike -------------------- Some higher resolution images available at my photostream: http://www.flickr.com/photos/31678681@N07/
|
|
|
|
|
May 22 2007, 01:04 AM
Post
#39
|
|
 Senior Member Group: Members Posts: 1887 Joined: 20-November 04 From: Iowa Member No.: 110 |
I remember reading a paper before Cassini reached Saturn that claimed Titan couldn't have oceans and continents because the tides would produce enough erosion to eventuallly wear down the continents until they were below sea level.
|
|
|
|
|
May 22 2007, 01:42 AM
Post
#40
|
|
|
Member Group: Members Posts: 723 Joined: 13-June 04 Member No.: 82 |
If Titan had global oceans on its surface, its tides would be enormous. Saturn's gravity well is far deeper than Luna's, and the eccentricity of Titan's orbit would be sufficient to induce tides measured in hundreds of metres. I worked through the calculation in an earlier post a couple of years ago, and came up with a result of about 150m.
(the tides are not caused by rotation within the tidally influencing body's gravity well, but by the local gravity differential across the diameter of Titan varying in strength due to the eccentricity of Titan's orbit) Since there is no global surface ocean on Titan, the tides would be proportionately smaller. I have to imagine that even such relatively small seas as we do see must have a tidal range of several metres, depending on the differential distance to Saturn between the closest and farthest points of the sea surface. At a first estimate, each 100km difference in distance to Saturn between the closest-to-Saturn and farthest-from-Saturn points of a single sea on Titan should produce about 3m of tidal range at those extremities. This tide would take the form of a 'slosh' with a period of roughly 15 days, with the sea levels on the sub-Saturn hemisphere reaching a maximum at the point closest to Saturn, and minimum at the point farthest from Saturn, when Titan is closest to Saturn, and the opposite pattern -- the sea levels at a minimum at the point closest to Saturn, and maximum at the point farthest from Saturn -- when Titan is farthest from Saturn. The shoreline midway between these two points should have little or no tidal range. Seas on the anti-Saturn hemisphere would have the opposite tidal pattern. Of course, local seabottom topography would have a big effect on tidal ranges too. Bill |
|
|
|
| Guest_AlexBlackwell_* |
May 22 2007, 01:44 AM
Post
#41
|
|
Guests |
QUOTE (alan @ May 21 2007, 03:04 PM) I remember reading a paper before Cassini reached Saturn that claimed Titan couldn't have oceans and continents because the tides would produce enough erosion to eventuallly wear down the continents until they were below sea level. You're probably referring to one of the two following papers: The tide in the seas of Titan Carl Sagan and Stanley F. Dermott Nature 300, 731-733 (1982). Abstract Tidal effects of disconnected hydrocarbon seas on Titan Stanley F. Dermott and Carl Sagan Nature 374, 238-240 (1995). Abstract |
|
|
|
|
May 22 2007, 09:28 AM
Post
#42
|
|
|
Senior Member Group: Members Posts: 3516 Joined: 4-November 05 From: North Wales Member No.: 542 |
We have a beautiful example of a tidal channel here in North Wales - the Menai Strait:
http://biology.bangor.ac.uk/research/wetla...es/image032.jpg Tidal range is up to 10m at one end and about half as much at the other. The phase difference is about one hour beween the two ends. Currents reach 8 knots. there are several deep spots including one near the NE end. |
|
|
|
|
May 22 2007, 12:17 PM
Post
#43
|
||
|
Senior Member Group: Members Posts: 3516 Joined: 4-November 05 From: North Wales Member No.: 542 |
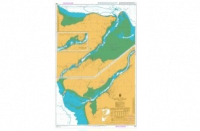
Menai Strait chart attached:
Note that this is quite a young feature - it has probably widened and deepened considerably even since Roman times. I guess the same could be true for the Titan feature, so you might only need a (relatively) brief wet episode to produce it. |
|
|
|
|
|
|
May 22 2007, 02:24 PM
Post
#44
|
|
|
Senior Member Group: Moderator Posts: 2785 Joined: 10-November 06 From: Pasadena, CA Member No.: 1345 |
(I sooooo totally could not resist this...)
Further support for the similarity between Titan's archipeligos and the San Juan Islands of the Pacific Northwest: "gunkholing!". -Mike 
-------------------- Some higher resolution images available at my photostream: http://www.flickr.com/photos/31678681@N07/
|
|
|
|
|
May 22 2007, 04:33 PM
Post
#45
|
|
|
Senior Member Group: Members Posts: 3516 Joined: 4-November 05 From: North Wales Member No.: 542 |
If we are saying that the equatorial basins once contained liquid then presumably tides could have caused much larger scale erosion features than just that small winding channel in Western Belet. In fact it could have been a major factor shaping the morphology of the basins, particularly their margins. Is this what you have in mind, Juramike? That could mean that quite a lot of the streaky features that we have been thinking about in terms of dunes and prevailing wind patterns are really tidal erosion features merely exploited and rendered more visible (like a fingerprint) by a 'dusting' of dune material. Some of the funny directions might make more sense that way. I have never been entirely happy about the wind patterns on Titan being redirected in major ways by what is really quite modest topography, but liquid would be another matter.
|
|
|
|
|
May 22 2007, 06:02 PM
Post
#46
|
|
|
Senior Member Group: Moderator Posts: 2785 Joined: 10-November 06 From: Pasadena, CA Member No.: 1345 |
QUOTE (ngunn @ May 22 2007, 12:33 PM) If we are saying that the equatorial basins once contained liquid then presumably tides could have caused much larger scale erosion features than just that small winding channel in Western Belet. Yup. That's what I'm thinking: 1. Basic morphology of the archipeligoes set up from impacts and crustal extensions (maybe even plate subductions?) 2. Grabens and basins partially filled up with eroded sands. 3. Bright stuff deposited from cryovolcanic venting. 4. Inundation with methane (removes lower parts of bright stuff, and sets up tidal channels which accentuates topography of grabens ("dancing monkey" of T28?). 5. Dune sands blowing around with the prevailing W wind. There may have been several cycles of inundation/tidal erosion and bright stuff deposition. If we see an obvious tidal channel (from RADAR) that is VIMS bright, we could argue that the particular tide channel was set in place in an earlier inundation/ocean event that occured BEFORE the last bright stuff deposition. (i.e. massive big huge inundation/tidal erosion-->bright stuff deposition-->big inundation leaves the lower bathtub ring). I have not seen any obvious signs of earlier pre-latest-bright-stuff shorelines or benches (except maybe the "Ghost Coast" area in NW Xanadu in the T13 RADAR swath). -Mike -------------------- Some higher resolution images available at my photostream: http://www.flickr.com/photos/31678681@N07/
|
|
|
|
|
May 22 2007, 07:10 PM
Post
#47
|
|
 Member Group: Members Posts: 809 Joined: 11-March 04 Member No.: 56 |
Are the sand basins really very far below the surrounding light-colored regions? If they were liquid-filled, how deep would they be?
|
|
|
|
|
May 23 2007, 02:28 PM
Post
#48
|
|
|
Senior Member Group: Moderator Posts: 2785 Joined: 10-November 06 From: Pasadena, CA Member No.: 1345 |
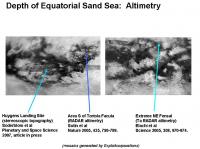
QUOTE (David @ May 22 2007, 03:10 PM) Are the sand basins really very far below the surrounding light-colored regions? If they were liquid-filled, how deep would they be? Those are really, really good questions! How deep from "highest sea level since bright stuff deposition" to lowest sediment level in the basin? (How much liquid did the basins hold at the last flood event?) And also how deep is the dune/ice sand layer to the basin substrate? (How much sediment has washed in?) The only papers I have found with altimetry data tracks over Equatorial Sand Sea basins are: Soderblom et al Planetary and Space Science, 2007, article in press. (Topography of Huygens landing site areas) Sotin et al. Nature, 2005, 435, 786-789. (Topography of line offshore S of "Snail" feature in Shangri-La) Elachi et al. Science, 2005, 308, 970-974. (Topography of line in NE Fensal? (or did it just miss the basin?)) Rodriguez et al LPS (2007) Abstract (and figure) freely available here. (I think this is the same track as in Elachi paper - NE Fensal?) Does anyone know if there have been any other altimeter or topograhic data released of an Equatorial Sand Sea basin? -Mike -------------------- Some higher resolution images available at my photostream: http://www.flickr.com/photos/31678681@N07/
|
|
|
|
|
May 23 2007, 02:53 PM
Post
#49
|
|
|
Senior Member Group: Members Posts: 3516 Joined: 4-November 05 From: North Wales Member No.: 542 |
Another question, Mike. I'm looking at the 'sliced carrot'/'Mcnaught tail' feature to the north of Adiri. To me that looks like a wide ridge (possibly a very large ancient crater rim) eroded through in several places by tidal currents. The northeastern margin of Belet shows a lot of lineation trending roughly the same way which could also have arisen from somewhat more random original topography modified by tidal action. Does that fit with your picture?
|
|
|
|
|
May 23 2007, 03:16 PM
Post
#50
|
|
|
Member Group: Members Posts: 153 Joined: 14-August 06 Member No.: 1041 |
Excellant theory, Mike. If the sand dunes are still active - not frozen, we should see patterns change; and if the dunes are moving, the channels are likely being replowed, at least seasonally, by active tides. This is the best explanation I have seen for both the oddball flow patterns suggested by the 'channel', the connected 'lakes'; and the competing dune and gorge terrain.
|
|
|
|
|
May 23 2007, 03:23 PM
Post
#51
|
|
|
Senior Member Group: Moderator Posts: 2785 Joined: 10-November 06 From: Pasadena, CA Member No.: 1345 |
Ngunn, it fits pretty close.
I suspect that there may be some type of fracture/fault? lines that trend more or less E-W in many areas of equatorial Titan (the parallel "ski tracks" in the T8 swath are really curious). This might hasten erosion along the fracture/fault? lines (erosion first by rain, wind, then eventually tidal action during inundation). So the "sliced carrot" feature N of Adiri does look like the eastern wall of a crater that got eroded to the point of breakthrough. It'd be neat to see if there are any EW trending RADAR-dark tidal channels between the remaining ramparts. Here's a pretty cool abstract regarding streamlined features on Titan: Burr et al. LPS 36 (2005) "Theoretical calculations of sediment transport on Titan, and the possible production of streamlined forms." Abstract available freely here. The kicker quote: "Additionally or alternatively, streamlining could occur in hydrocarbon oceans due to coastal currents or basin scale circulation, in a manner analogous to streamlining in marine environments on Earth." If the ramparts do show tidal channels, I wonder if the E side of any islands in the channel are now streamlined? (So instead of a comet shape pointing W, maybe in these areas the currents shaped a symmetrical streamlined island so that the E side is also bullet shaped like the W.) -Mike -------------------- Some higher resolution images available at my photostream: http://www.flickr.com/photos/31678681@N07/
|
|
|
|
|
May 23 2007, 03:50 PM
Post
#52
|
|
|
Senior Member Group: Members Posts: 3516 Joined: 4-November 05 From: North Wales Member No.: 542 |
I certainly find these ideas plausible - and now you have some specific testable predictions at a specific location. Does the sliced carrot coincide with any planned RADAR swath as far as we know?
Thanks for that link. |
|
|
|
|
May 24 2007, 01:00 AM
Post
#53
|
|
|
Senior Member Group: Members Posts: 1887 Joined: 20-November 04 From: Iowa Member No.: 110 |
Would the strength of these tides tides vary with latitude? If so I can see this as an additional reason for the lakes being concentrted at the poles. Stronger tides at low latitudes could result in liquid filled basins being enlarged by tidal motion. Eventually they could reach the point where increased evaporation or seepage caused them to dry up.
|
|
|
|
|
May 26 2007, 01:29 PM
Post
#54
|
|
|
Member Group: Members Posts: 611 Joined: 23-February 07 From: Occasionally in Columbia, MD Member No.: 1764 |
QUOTE (alan @ May 23 2007, 09:00 PM) Would the strength of these tides tides vary with latitude? If so I can see this as an additional reason for the lakes being concentrted at the poles. Stronger tides at low latitudes could result in liquid filled basins being enlarged by tidal motion. Eventually they could reach the point where increased evaporation or seepage caused them to dry up. Yes - the strength varies with latitude (and longitude) - specifically with distance from the subsaturn point. A brief intro to tides on Titan and their effect on lakes (from 1993 - it includes some predicted landforms that, er, well, havent been borne out by observations so far, let's say - but it lays out some useful fundamentals) is at http://www.lpl.arizona.edu/~rlorenz/craterlakes.pdf Tides are generally weaker at high latitudes. I dont think tides explains why we find liquids where we do (but they may be responsible for the lack of wave-type features on shorelines like sandbars - tidal displacement of the waterline is larger than typical waveheight..) |
|
|
|
|
May 29 2007, 04:33 PM
Post
#55
|
|||||||||
|
Senior Member Group: Moderator Posts: 2785 Joined: 10-November 06 From: Pasadena, CA Member No.: 1345 |
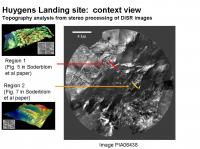
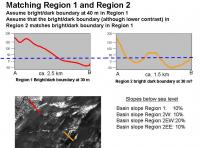
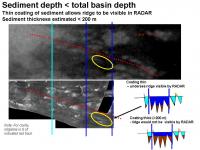
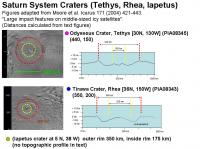
I used the published altimetry data to try and estimate the average depth of the Equatorial Sand Seas. The slides below show estimated traces adapted from released data.
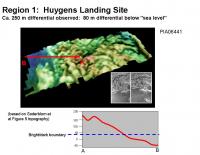
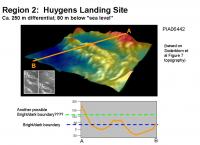
DISR image interpretation gave relative topographical maps of two regions near the Huygens Landing Site. Region 1 is the island, and Region 2 is one of the potholes of the sandbar in the offshore channel (the spooky dude formation. It is assumed that the absolute topographic elevation of the two determined regions (Region 1 and Region 2) is the same. In both regions, the bright/dark boundary was estimated to be at ca. 30 m in the referenced figures. [The highest points of the channel sandbar (region 2) are at 140 m above the bright/dark boundary. It is difficult to understand how a streambed deposit could have an elevation above the maximum sea level. (Unless maybe the sandbar was emplaced by an earlier and even higher inundation??) ]
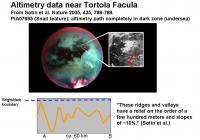
Altimetry data from the Shangri-La basin immediately S of Tortola Facula showed a series of parallel E-W ridges that varied by several hundred meters. Since these are not ISS-bright, they must lie below sea level, (below the bright/dark boundary). Thus, the elevations below sea level are estimated to be at least 0-200 m deep. [200 is minimal interpretation of several hundred meters]
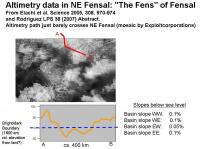
The Ta altimetry trace just crosses extreme NE Fesal. Altimetry shows a shallow dip, indicating that Fensal is very shallow in this area.
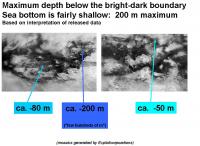
Maximum depths observed: Shangri-La basin (Huygens Landing site): at least 80 m deep Shangri-La basin (S of Tortola Facula): at least 200 m deep Extreme NE Fensal basin: 50 m deep With this limited data, it appears that the basins (or at least its edges) are fairly shallow. Thus during the last inundation, the basins would have resembled shallow seas, not deep oceans. -Mike -------------------- Some higher resolution images available at my photostream: http://www.flickr.com/photos/31678681@N07/
|
||||||||
|
|
|
||||||||
|
May 29 2007, 05:10 PM
Post
#56
|
|
 Senior Member Group: Members Posts: 2530 Joined: 20-April 05 Member No.: 321 |
QUOTE (Juramike @ May 29 2007, 09:33 AM) I used the published altimetry data to try and estimate the average depth of the Equatorial Sand Seas. The slides below show estimated traces adapted from released data. [...] With this limited data, it appears that the basins (or at least its edges) are fairly shallow. Thus during the last inundation, the basins would have resembled shallow seas, not deep oceans. -Mike Nice work. A companion analysis would be to say what kind of relief can be supported by H2O ice at these temperatures / acceleration due to gravity. Ganymede makes a very handy reference. DEMs from G1/G2 and from Voyager/G8 show delta-elevations of about 1500 m. Take that empirical result with a grain of salt or two -- the uplift could be different in the two cases, and Titan may not be in steady state. And moreover, the stereo coverage of Ganymede is extremely limited. Also, the sand seas should be able to make steep icy slopes more "buoyant" than when they are exposed to the vacuum of space. That could preserve some deeper gorges that are under "sea level". We shouldn't be surprised, though, if we find out that most of Titan's surface (including the icy surface submerged under sand seas) is within a range of 1500 meters or so of elevation. Since the sand seas occupy only a small fraction of the distribution [at the bottom, obviously], one would naively expect a depth that is a comparable fraction of the range. Eg, 1/10th of the range is about the bottom 150 meters. That happens to nail Juramike's estimates working from another direction. Given the sharp linear features around Aztlan in particular, perhaps there are some isolated "Marianas Trench" locales where the sand seas are particularly deep, but that wouldn't operate across their full breadth, for sure. |
|
|
|
|
May 29 2007, 06:18 PM
Post
#57
|
||||||||
|
Senior Member Group: Moderator Posts: 2785 Joined: 10-November 06 From: Pasadena, CA Member No.: 1345 |
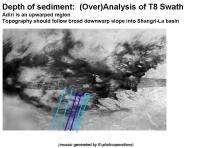
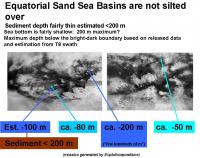
I used the "ski tracks" feature in the T8 swath to attempt to speculate on the depth of the sediments in W Shangri-La.
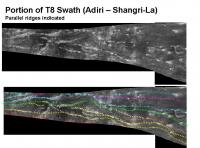
The bright terrain Adiri appears to be an upwarped terrain that was left above sea level during the last major inundation. There is an interesting series of parallel ridges in the T8 swath that run predominantly E-W along the southern margin of the Shangri-La basin and continue across Adiri. These ridges have been upwarped across Adiri (or downwarped to form the Shangri-La basin). In Adiri, the ridges are coated in bright material, but as one tracks eastward, the ridges slope gently down below sea level and the bright material is no longer present. Entering the Shangri-La basin, the ridges can not be discerned by ISS, but still remain visible in RADAR images. As the ridges begin reemerge above "sea level" further E, the ridges reappear in ISS imagery in the area to the N of Perkunas Virgae. (The ridges (and valleys) themselves are parallel to Bacab Virgae). Several of these ridges can be traced in the T8 swath. (I highlighted about 8 trending EW). Interestingly, the fault highlighted by Soderblom et al. on the island next to the Huygens Landing Site runs parallel to these ridgelines. It seems likely the island closest to the Huygens Landing Site is an exposed section of one of these ridges. Across the entire southern section of Shangri-La there are features that are oriented parallel to these ridges: these include Bacab Virgae, and the undersea parallel ridges S of Tortola Facula that were examined by altimetry.
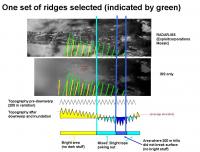
It seem reasonable to estimate that the that the ridges and valleys in the parallel system have elevation differences of 200-300 m. (Based on Huygens Island topography analysis 250 m and the similar set of EW undersea parallel ridges S of Tortola Facula that varied by several hundred meters). If we select one ridge in RADAR (green dashed line), we can follow it in ISS from the bright Adiri terrain into where it breaks up into exposed bright islands at the margin of Adiri (light blue line), until it disappears into Shangri-La (dark blue line), only to reemerge again into exposed bright islands (dark blue line). The light blue line shows where the valley was inundated (no more bright material on valley floor), and the dark blue line shows where the ridge tops were inundated (bright material removed even from ridgetops). Assuming the ridgeline to valley floor has an elevation difference of 200 m, the distance between the light blue line and the dark blue line can be used to derive the slope of the warp. This is approximately 200 m in 200 km, or 0.1%.
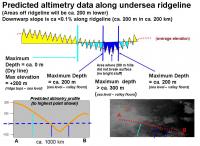
Extrapolating this slope into the "sea", we can estimate the depth of this section of Shangri-La basin. (In the slide, the red line is drawn in the valley just N and parallel to the ridgeline track in order to not obscure the ridge.) This would be estimated to be 100 m from sea level to ridgeline top. (Or 300 m from sea level to valley floor). An estimated (predicted) altimetry track is shown. [This track is close to the future T41 RADAR track]. These values are in the same ballpark as previously determined depths (above posts). The area bounded by the dark blue lines and along the ridgeline is highlighted in yellow. By ISS, no bright ridges are observed. This makes sense: from the above analysis, the ridgetops would have been inundated (by 100 m of solvent) , and no bright coating would be expected. But in this same area, ridges can be observed by RADAR. This implies that the ridge tops are RADAR-visible above the lower level of sediment or loose dune sands. Since the ridge tops are 200 m above the valley floor, that implies that the sediment layer lying on the valley floor is less than 200 m thick. (If the sediments were thicker than 200 m, the undersea ridges would not be visible by RADAR).
So the bottom line ( yup! I intened that!  ) is that the Equatorial Sand Seas are relatively shallow (compared to Earth) but are not silted over. ) is that the Equatorial Sand Seas are relatively shallow (compared to Earth) but are not silted over.-Mike -------------------- Some higher resolution images available at my photostream: http://www.flickr.com/photos/31678681@N07/
|
|||||||
|
|
|
|||||||
|
May 29 2007, 06:45 PM
Post
#58
|
||
 The Poet Dude Group: Moderator Posts: 5551 Joined: 15-March 04 From: Kendal, Cumbria, UK Member No.: 60 |
Fascinating reading as always Juramike, thanks. You put a lot of effort into those posts, and it's appreciated.
I'm interested to hear what you think this feature - I think it's been called "the Spaghetti" somewhere here - actually is?
Silted-up drainage channels? Faults? Cryo-volcano run-offs? 
-------------------- |
|
|
|
|
|
|
May 29 2007, 07:17 PM
Post
#59
|
|
|
Senior Member Group: Moderator Posts: 2785 Joined: 10-November 06 From: Pasadena, CA Member No.: 1345 |
My WAG about the "dancing monkey" or "spaghetti" feature is that faulting, erosion, inundation, and cryo-volcanism were all players.
1. Faulting makes a bunch of grabens. (generally trending EW) 2. Erosion during methane rainstorms and inundations occur. (Tidal flushing a factor interconnecting the lines?) 3. A cryovolcano somewhere (Xanadu?) coughs up bright material that gets distributed all over. Bright stuff deposited. (My wild suspicion is that Xanadu is a major cryovolcanic complex and coughs bright material that distributes mostly in the equatorial/mid latitude region. I suspect Xanadu on Titan is the equivalent of Tharsis on Mars). 4. The last major indundation occurs and strips bright stuff below "sea level". Dark blue ice sand sediments washed in to basins. (Are any blown in? VIMS could provide evidence by seeing if any of the dark brown dune sands are present in the bottom) I'm not sure what made initial graben as a series of curvy cross cut patterns in this area compared to the straight lines in other areas. Maybe a comparison can be drawn with Callisto, Ganymede, and Europa with regards to the formation of ridges and grooves seen on those icy moons? -Mike -------------------- Some higher resolution images available at my photostream: http://www.flickr.com/photos/31678681@N07/
|
|
|
|
|
Jun 4 2007, 04:31 PM
Post
#60
|
||||||||
|
Senior Member Group: Moderator Posts: 2785 Joined: 10-November 06 From: Pasadena, CA Member No.: 1345 |
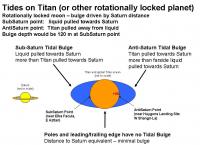
QUOTE (rlorenz @ May 26 2007, 09:29 AM) A brief intro to tides on Titan and their effect on lakes (...) is at http://www.lpl.arizona.edu/~rlorenz/craterlakes.pdf I attempted to relate the tide effects mentioned above and in other (papers you gotta pay for) to the Channel in W Belet. Here are the non-free references: Sagan and Dermott Nature 1982, 300, 731-733. "The tide in the seas of Titan". Dermott and Sagan Nature 1995, 374, 238-240. "Tidal effects of disconnected hydrocarbon seas on Titan". Tokano and Neubauer Icarus 2002, 158-499-515. "Tidal Winds on Titan Caused by Saturn." The figures attached describe the tidal effects of tidally locked planet with significant orbital eccentricity and a global ocean. (e.g. Titan, but with a global ocean):
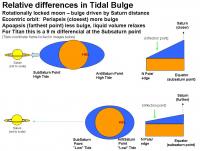
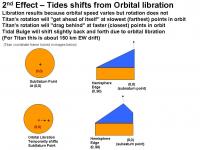
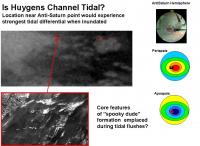
The tidal bulge is set by the gravitational attraction by the influencing body (e.g. Saturn on Titan). At the sub-Saturn point, Saturn pulls on the hydrocarbon ocean since the ocean is closer to Saturn than the core of Titan. (Think of it as Saturn trying to accelerate the ocean away from Titan). At the anti-Saturn point, Saturn pulls on the core of Titan more than the hydrocarbon carbon ocean which is further from Saturn. (Think of it as Saturn trying to accelerate Titan away from the ocean.) At the poles and hemisphere edges, the ocean is at the same relative distance from Saturn and the core of Titan, so there is no bulge at these locations. (For more info, check out: http://en.wikipedia.org/wiki/Tidal_bulge http://home.hiwaay.net/~krcool/Astro/moon/moontides/ ) Since Titan is tidally locked, and the same point (more or less) faces Saturn, the tidal bulge is pretty much frozen in place. From Sagan et al. the tidal bulge of a theoretical global hydrocarbon ocean on Titan would be 120 m higher at the sub-Saturn point and at the anti-Saturn point. The tide is set by the relative height differential of the tidal bulge. If Titans orbit were perfectly circular, there would be no difference and the sub-Saturn point tidal bulge would always be at 120 m. So no differential, thus no tide. But Titan has an eccentric orbit. (e = 0.0289). When Saturn is closer to Titan, the tidal bulges are more accentuated than when it is farther away. This is by 9% (3e = 3 x 0.0289), or 9 m higher at the sub-Saturn point. When Saturn is farther away, the bulge is lower by 9 m. But since the liquid volume is fixed, the excess mass gets distributed to the remainder of the ocean. So the ocean height at the hemisphere edge increases (slightly all that 9 m of bulge differential is distributing over a much, much larger area). This increase would be the local high tide at the periphery of the hemisphere and poles. There will also be a point of inflection that would not experience any tidal differential. In addition, there is a slight effect due to orbital libration. This causes a drift along the equator of 150 km of the tidal bulge of the sub-Saturn (and thus anti-Saturn) points. This would result from the rotation of Titan being fixed but the orbital speed is variable. At it reaches periapsis, Titan is zipping along and the rotation will be dragging behind. As it whips around the periapsis point, the rotation is still slower so the Tidal bulge will appear to move forward. The net effect will be to ratchet the Tidal Bulge forward (eastward) a small amount. There would be a similar drift westward at the far end of the orbit for the same reason, but the effect will be much smaller (since the bulge will be smaller at apoapsis). This will also smear the Tidal Bulge along the EW direction.
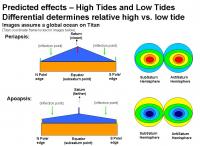
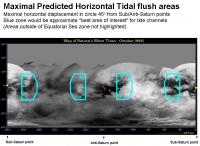
Combining these effects we get a theoretical picture of the global ocean height at periapsis (closest to Saturn) and apoapsis (farthest from Saturn). The sub-Saturn and anti-Saturn point will have the largest effect (9 m!). The poles and hemisphere edges will have a much smaller effect (<9 m) and there will be zone of inflection with no differential is shown in green. This model is assuming a global ocean. On Titan, it appears that there were multiple shallow sea basins that were flooded during the last major inundation. That means that any relaxation of tidal volume from a bulge at one end of a sea would need to be taken up at the other end of the sea. For example, the Anti-Saturn point is at the W end of Shangri-La basin; as Titans orbit swings farther from Saturn, the liquid under the tidal bulge would be somewhat redistributed to the farther parts of the Shangri-La basin (and would also try to redistribute to other connected basins, such as Ching-Tu and Belet). From the logic above, the best places to look for tidal channels would be nearest the sub-Saturn and anti-Saturn points in the narrow constrictions between basins or archipeligos.
In the Anti-Saturn hemisphere, the dark areas between Dilmun and Adiri (the channel between Shangri-La and Belet) should be a really good place to look for tidal channels (sliced carrot feature?). Another place would be the passages connecting Shangri-La and Ching Tu, as well as Ching-Tu and Belet. (Is the Huygens channel a former tidal channel? Its location fits nicely with predicted tidal differentials!) . In the Sub-Saturn hemisphere, narrow channels between Aztlan and Aaru, narrow channels between Aztlan and Fensal (extreme E Quivra) and Senkyo/Fensal and Aaru/Senkyo would be interesting to check out. The areas between Senkyo and Belet may be also of some interest. The possible Tidal channel in W Belet is located in an area that may not have the largest possible tidal differential. (But heck, the potential Earth analog, Deception Pass, gets an impressive flush from only a 1.5 m tide height differential.) The poles should have almost zero tides, especially if they are/were disconnected from any bodies of liquid involved in the SubSaturn or AntiSaturn Tidal Bulges. Other effects that may influence tidal flushes include both sea bottom topography and tidal resonances. -Mike -------------------- Some higher resolution images available at my photostream: http://www.flickr.com/photos/31678681@N07/
|
|||||||
|
|
|
|||||||
|
Jun 5 2007, 10:32 AM
Post
#61
|
|
|
Senior Member Group: Members Posts: 3516 Joined: 4-November 05 From: North Wales Member No.: 542 |
QUOTE (Juramike @ Jun 4 2007, 05:31 PM) From the logic above, the best places to look for tidal channels would be nearest the sub-Saturn and anti-Saturn points Are you sure about this? I would expect these to be points of maximal rise and fall, but minimal horizontal flow (and that due to libration only). The great circle where Saturn is on the horizon would also be a place of high rise and fall but little horizontal displacement. I would expect the zones of maximal horizontal flow to form small circles midway between in both hemispheres, say 30 - 60 degrees from the sub and anti Saturn points. |
|
|
|
|
Jun 5 2007, 11:12 AM
Post
#62
|
|
|
Senior Member Group: Members Posts: 3516 Joined: 4-November 05 From: North Wales Member No.: 542 |
QUOTE (Juramike @ Jun 4 2007, 05:31 PM) Is the Huygens channel a former tidal channel? I've given some thought to that. For the moment I accept that the local topography could have been modified by tidal action at some time(s) in the distant past. However I don't think it can be responsible for the (more recent/more frequent?) emplacement of the giant gravel banks. Those are, I think, just too big, and they look much more like the products of individual catastrophic events than the result of regular tidal washing. |
|
|
|
|
Jun 5 2007, 04:34 PM
Post
#63
|
||
|
Senior Member Group: Moderator Posts: 2785 Joined: 10-November 06 From: Pasadena, CA Member No.: 1345 |
QUOTE (ngunn @ Jun 5 2007, 06:32 AM) Are you sure about this? I would expect these to be points of maximal rise and fall, but minimal horizontal flow (and that due to libration only). The great circle where Saturn is on the horizon would also be a place of high rise and fall but little horizontal displacement. I would expect the zones of maximal horizontal flow to form small circles midway between in both hemispheres, say 30 - 60 degrees from the sub and anti Saturn points. Your are totally correct. Further digging into the articles states that maximal horizontal displacement will be in an area near 45 degrees of the SubSaturn and AntiSaturn points. (Due to libration they would have a time-averaged slight oval shape, however.) But also remember that we are looking at constricted channels. So a large vertical displacement (inside 45 degree zone) on one side of the channel will translate to a height differential across the channel if the flow is sufficiently restricted on one side. (e.g. an open bay on one side, but a narrow channel on the other). Here is a corrected map of maximal horizontal tidal flush (overlaid in the Equatorial Dune seas area)
(Happily, the W Belet Channel at 290 W is only slightly outside this zone (on the "bad" side, however)) But remember, only a differential of 1.5 M carved out Deception Pass. -Mike -------------------- Some higher resolution images available at my photostream: http://www.flickr.com/photos/31678681@N07/
|
|
|
|
|
|
|
Jun 5 2007, 05:52 PM
Post
#64
|
|
|
Senior Member Group: Moderator Posts: 2785 Joined: 10-November 06 From: Pasadena, CA Member No.: 1345 |
QUOTE (ngunn @ Jun 5 2007, 07:12 AM) I've given some thought to that. For the moment I accept that the local topography could have been modified by tidal action at some time(s) in the distant past. However I don't think it can be responsible for the (more recent/more frequent?) emplacement of the giant gravel banks. Those are, I think, just too big, and they look much more like the products of individual catastrophic events than the result of regular tidal washing. Those gravel banks are really, really big. (Almost as big as the summit of the island at the Huygens landing site.) I'm invoking their initial placement during an even earlier and even bigger inundation (at least to the 120 m level in the terrain model.) I was speculating that the gravel banks were dumped during a massively huge ancient indundation (an inundation before the last indundation, or inundation N-1). That put the material there initially, then tidal action, (again during the N-1 inundation) reworked the gravels and scoured out the potholes. I'll further speculate that the last (most recent) inundation's tidal action would not have been sufficient to gouge out the huge initial potholes, they must have been pre-existing. But it may have been enough to carve lower lying channels and fill in/carve out some of the lower parts of accessible potholes. (30 m level in the topography models = bright-dark boundary = putative max most recent inundation level ) Anything accessible to liquid during the last inundation would have been fair game for carving during a tidal flush. Anything above 30 m in the terrain model, or anything surrounded by a 30 m high wall should have been cut off and insulated from carving during the most recent big inundation. I wonder if it is possible to tell from morphology the difference between bottom features carved during a catastrophic event or from back-and-forth tidal flushes. (Tilt table with sand and a garden hose on a hot summer evening?) -Mike -------------------- Some higher resolution images available at my photostream: http://www.flickr.com/photos/31678681@N07/
|
|
|
|
|
Jun 5 2007, 06:07 PM
Post
#65
|
|
|
Senior Member Group: Members Posts: 3516 Joined: 4-November 05 From: North Wales Member No.: 542 |
Well, one striking characteristic of the 'hooded dude' gravel banks is their unidirectional appearance. Another is evidence from the Huygens surface view that the pebbles look remarkably fresh and clean, not at all as if they'd been lying about under a dirty atmosphere for geological time spans. That's why I go for a recent weather/cryovolcanic-induced deluge (which could also have erased any dunes at this location?). Of course the whole channel that this flood poured through could have been formed much earlier, possibly in part by tides.
|
|
|
|
|
Jun 5 2007, 07:46 PM
Post
#66
|
|
|
Senior Member Group: Moderator Posts: 2785 Joined: 10-November 06 From: Pasadena, CA Member No.: 1345 |
That's a really good point on the clean-looking cobbles. Maybe the last rain event cleaned them off?
(I'm not totally convinced that tholins are plooping out of the atmosphere all over the place - at least we know that the tholin deposition rate rate less than 1 mm/ h at the Huygens site) The flow in the Soderblom article has the Huygens channel major flow going from SW to NE. But the "hooded dude" formation seems tapered as if the flow was going from NE to SW. At least the pointy part is on the NE side. (Then you also have the small channels cross-cutting the bars going from W to E - that's probably from "normal" flooding rain events.) I'd love to find a marine chart with bottom features resembling the "hooded dude" formation. At least it might give us a clue which way the current could go to make analogous formations. -Mike -------------------- Some higher resolution images available at my photostream: http://www.flickr.com/photos/31678681@N07/
|
|
|
|
|
Jun 5 2007, 08:12 PM
Post
#67
|
|
|
Senior Member Group: Members Posts: 3516 Joined: 4-November 05 From: North Wales Member No.: 542 |
QUOTE (Juramike @ Jun 5 2007, 06:52 PM) bottom features carved during a catastrophic event-Mike I'm not sure they have to be 'bottom' features. The pebbles could be bouyant flotsam. In that way the terminal gravel bank at the end of a flood wash could actually be higher than the depth of liquid transporting it. Maybe images of rubbish washed inland by tsunamis would be somewhere to look for analogues. |
|
|
|
|
Jun 5 2007, 09:10 PM
Post
#68
|
|
|
Senior Member Group: Moderator Posts: 2785 Joined: 10-November 06 From: Pasadena, CA Member No.: 1345 |
QUOTE (ngunn @ Jun 5 2007, 04:12 PM) The pebbles could be bouyant flotsam. In that way the terminal gravel bank at the end of a flood wash could actually be higher than the depth of liquid transporting it. Hmm. That's interesting. I have been assuming that the pebbles were made of primarily ice. The density of methane should be around 0.6 g/mL and that of ice-sand (or pebbles) should be around 1 g/mL. BUT there is the chance that the ice cobbles are nanoporous ice (density = ?) or that maybe the cobbles were coated in low density stuff that dissolved away? But to bring the average less than the hydrocarbon liquid (d = 0.6 g/mL) it would have to be really low density stuff. In a really turbulent white-methane flow, air (nitrogen) would get incorporated in the frothy mess, that would drive the density of the liquid lower and make it even less supportive of denser materials. One possibilitie to make the gravel stuff behave like it floated would be glacial (methane/ethane glacier?) - ice rocks get transported along top of the glacial flow, then dumped moraine-like at the terminus and along the base after melting/sublimation. This would result in an unsorted deposit. (But maybe the deposits we see in the surface images have been later reworked - Huygens did not land on the very top of the big gravel bank). Another possibility would be a lahar or landslide on an air cushion, (followed by reworking at the Huygens site). But you'd need a really big mountain somewhere close. (I'm partial to the glacial idea, the m.p of methane is about 90 K at Earth pressure) -Mike -------------------- Some higher resolution images available at my photostream: http://www.flickr.com/photos/31678681@N07/
|
|
|
|
|
Jun 5 2007, 10:07 PM
Post
#69
|
|
|
Senior Member Group: Moderator Posts: 2785 Joined: 10-November 06 From: Pasadena, CA Member No.: 1345 |
Following the calculations in the Sagan, Dermott, and Lorenz papers, I repeated their calculations for the putative W Belet channel to see if tidal resonance could furnish exteme tides (like in Bay of Fundy)
From the Sagan, Dermot and Lorenz papers, the formula for a tidal resonance is: Tg = 2L/[N(gD)^0.5] where N is the mode number (well use 1), g is the surface gravity (g = 1.34 ms-2), D is the depth of the basin, and L is the length of the basin along the direction of wave propogation. Resonance arises when one of the periods of the normal modes equals the tidal period, or in the case of Titan, the orbital period of the satellite, T (T = 5.4E6 s). For the channel in W Belet/E Senkyo, the basin to the NW (from the ISS image) has a EW length of 500 km. (Happily, the E Senkyo side to the SW is about the same size.) Assuming a depth of 1-200 m from the above posts estimation we then get: (gD)^0.5 = 1.2 16.3 ms-1 [similar values as the articles above indicated] Applying this to the W Belet basin: Resonant period is 1E6 m/1.2 ms-1 = 8.3E5 s. Which is still shorter than the orbital period of 5.4E6 s. (Bummer). However, if we consider a larger basin with a large EW fetch, such as Shangri-La (2000 km EW basin size), we get a resonant period of: 4E6 m/1.2 ms-1 = 3.3E6. Which is approx half of the orbital period (so its close, but no cigar (Bummer)). For there to be tidal resonance, the seas would need to be much larger, but still shallow. However, just like on Earth, local tide effects on Titan could be strongly controlled by bottom topography, currents and complicated gyres in the sea basins. These would need to be invoked for above average tidal currents, since resonance effects do not seem a likely player. (Happily, I have absolutely no idea how to predict or calculate these). -Mike P.S. Assuming a bottom slope of 0.1% due to downwarp, the maximum tide range of a 9 m tide bulge differential would give an intertidal distance of 10 km. So really impressive beaches are possible in large tidal basins where the tidal height range is largest, near the Anti-Saturn or Sub-Saturn points (W Shangri-La basin or E Aztlan) Then E Fensal (where we have altimetry data) area should have been a large intertidal zone and will be interesting to examine by ISS and upcoming RADAR passes. (Sadly, the Fens of E Fensal are probably covered by dune sands now no more Titan oyster beds!) -------------------- Some higher resolution images available at my photostream: http://www.flickr.com/photos/31678681@N07/
|
|
|
|
|
Jun 5 2007, 10:18 PM
Post
#70
|
||
|
Senior Member Group: Moderator Posts: 2785 Joined: 10-November 06 From: Pasadena, CA Member No.: 1345 |
Does anyone have an idea what the heck these are? (clipped from ISS, RADAR and ISS/RADAR combos)
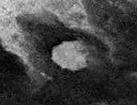 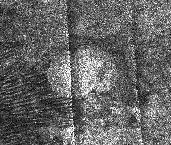 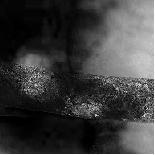
They have RADAR/ISS bright centers (rough, high domes?) with a RADAR-dark ISS dark halo (low, smooth moat?). They sometimes appear squished in the direction of putative tectonic extension. (I'm calling them "center-bright circular features"). I'm seeing them everywhere in the Equatorial Sand Sea basins... Speculation, anyone? -Mike -------------------- Some higher resolution images available at my photostream: http://www.flickr.com/photos/31678681@N07/
|
|
|
|
|
|
|
Jun 6 2007, 10:07 AM
Post
#71
|
|
|
Senior Member Group: Members Posts: 3516 Joined: 4-November 05 From: North Wales Member No.: 542 |
QUOTE (Juramike @ Jun 5 2007, 10:10 PM) Hmm. That's interesting. I have been assuming that the pebbles were made of primarily ice. The density of methane should be around 0.6 g/mL and that of ice-sand (or pebbles) should be around 1 g/mL. BUT there is the chance that the ice cobbles are nanoporous ice (density = ?) or that maybe the cobbles were coated in low density stuff that dissolved away? But to bring the average less than the hydrocarbon liquid (d = 0.6 g/mL) it would have to be really low density stuff. -Mike On possible low density pebbles: Recall that terrestrial silicate rocks are about 2.5 times denser than water, yet pumice pebbles can float right across terrestrial oceans. I'm not saying all the surface ices on Titan are similarly aerated and impermeable in this way, only that a fraction of them may be. But it is precisely that fraction that would be carried furthest in a flood and which you'd expect to find uppermost in the resulting debris pile. Gases escape more easily from liquids than from solids so it would not surprise me if the mean liquid density of even a frothy Titan outwash flood were still greater than at least some of the solid material being transported. |
|
|
|
|
Jun 6 2007, 12:02 PM
Post
#72
|
|
|
Senior Member Group: Members Posts: 3516 Joined: 4-November 05 From: North Wales Member No.: 542 |
A further thought - two plausible eruption products from Titan cryovolcanism are large volumes of condensable methane and aerated 'pyroclastic' (or should we say cryoclastic) bombs and ice-ash. Thus one could envisage such an event providing both the gravel-bank material seen by Huygens and, via a rain-bearing eruption cloud, the exceptional supply of liquid needed to transport it to Curien Station.
|
|
|
|
|
Jun 6 2007, 02:47 PM
Post
#73
|
|
|
Senior Member Group: Members Posts: 3516 Joined: 4-November 05 From: North Wales Member No.: 542 |
QUOTE (Juramike @ Jun 5 2007, 11:18 PM) Does anyone have an idea what the heck these are? (I'm calling them "center-bright circular features"). I'm seeing them everywhere in the Equatorial Sand Sea basins... Speculation, anyone? -Mike Diapirs? |
|
|
|
|
Jun 6 2007, 05:36 PM
Post
#74
|
|
|
Senior Member Group: Moderator Posts: 2785 Joined: 10-November 06 From: Pasadena, CA Member No.: 1345 |
Cryopumice is a very interesting concept. Those types of ice rocks would also be more prone to erosion and rounding. (As the walls between vesicles should break easier).
I wonder what a cryopumice field would look like by RADAR? Would the Titan equivalent of a cinder cone look like a bright zone? How high would it get thrown? What would it look like from above? Would the pumice field be a cone shaped feature pointing downwind, or would the eruption be low enough that the flat parabola trajectory would make a circle shaped feature? -Mike -------------------- Some higher resolution images available at my photostream: http://www.flickr.com/photos/31678681@N07/
|
|
|
|
|
Jun 6 2007, 06:35 PM
Post
#75
|
|
|
Senior Member Group: Moderator Posts: 3233 Joined: 11-February 04 From: Tucson, AZ Member No.: 23 |
QUOTE (Juramike @ Jun 6 2007, 10:36 AM) Would the pumice field be a cone shaped feature pointing downwind You mean, like Omacatl Macula ISS sees a parabola-shaped dark deposit. RADAR sees a small, smooth deposit centered around a 6-km wide caldera-like feature. I've always attributed the smooth deposit to indicate a low-dielectric constant material with small particle sizes compared to the wavelength of the radar. Basically an ashfall deposit with relatively few large pumice.
-------------------- &@^^!% Jim! I'm a geologist, not a physicist!
The Gish Bar Times - A Blog all about Jupiter's Moon Io |
|
|
|
|
Jun 6 2007, 09:16 PM
Post
#76
|
|
|
Senior Member Group: Moderator Posts: 2785 Joined: 10-November 06 From: Pasadena, CA Member No.: 1345 |
QUOTE (volcanopele @ Jun 6 2007, 02:35 PM) You mean, like Omacatl Macula ISS sees a parabola-shaped dark deposit. RADAR sees a small, smooth deposit centered around a 6-km wide caldera-like feature. I've always attributed the smooth deposit to indicate a low-dielectric constant material with small particle sizes compared to the wavelength of the radar. Basically an ashfall deposit with relatively few large pumice.(Image of Omacatl Macula here) I guess that would be one flavor of an ashfall eruption. I was wondering if there might be another flavor of eruption with larger chunks of pumice that wouldn't fly as far or distrubute downwind. I would think something like that might appear bright to RADAR, but may or may not appear bright to ISS/VIMS. (I'm speculating that ISS brightness is dependant on altitude above or below the last inundation high-sea mark.) -Mike -------------------- Some higher resolution images available at my photostream: http://www.flickr.com/photos/31678681@N07/
|
|
|
|
|
Jun 6 2007, 09:47 PM
Post
#77
|
|
|
Senior Member Group: Moderator Posts: 3233 Joined: 11-February 04 From: Tucson, AZ Member No.: 23 |
I think such a feature might have been seen in northern Fensal, surrounding a possible Ganesa-like pancake dome with a flow to the north.
-------------------- &@^^!% Jim! I'm a geologist, not a physicist!
The Gish Bar Times - A Blog all about Jupiter's Moon Io |
|
|
|
|
Jun 6 2007, 09:49 PM
Post
#78
|
|
|
Senior Member Group: Moderator Posts: 2785 Joined: 10-November 06 From: Pasadena, CA Member No.: 1345 |
Cool-o! Was that by RADAR or VIMS?
Got coordinates? -Mike -------------------- Some higher resolution images available at my photostream: http://www.flickr.com/photos/31678681@N07/
|
|
|
|
|
Jun 6 2007, 10:20 PM
Post
#79
|
|
|
Senior Member Group: Moderator Posts: 3233 Joined: 11-February 04 From: Tucson, AZ Member No.: 23 |
You know, ISS does take images of Titan too...
 The feature, which I really should get a name submitted for, is located at 12.3 N, 43.8 West. RADAR saw rough, IR-dark terrain just to the south of the feature on T17. -------------------- &@^^!% Jim! I'm a geologist, not a physicist!
The Gish Bar Times - A Blog all about Jupiter's Moon Io |
|
|
|
|
Jun 6 2007, 10:46 PM
Post
#80
|
|
|
Senior Member Group: Moderator Posts: 2785 Joined: 10-November 06 From: Pasadena, CA Member No.: 1345 |
QUOTE (volcanopele @ Jun 6 2007, 06:20 PM) 12.3 N, 43.8 West. Got it. Bingo! Actually, I was thinking that the parent feature (just to the N and out of view of the T17 RADAR swath) may actually be a tiny version of a multi-ring crater (mini-Minrva, rim diameter = ca 120 km). There appears to be a dark halo surrounding this feature as well (approx halo diameter 475 km x 300 km, squished in the direction 20 degrees to N). (I suspect that three [two for sure, maybe a third] of the Minrva-type multi-ring craters are wedged in the space between the T17 and T3 swath. All three were just barely missed by the two paths (Bummer!), although some of the associated bright patch for the 12.3 N, 43.8 W are visible in T17 swath. ) So maybe another possibility for the bright center dark halo circle features are cryopumice fields, along with diapirs and their kin, or anamolous dome craters like seen on Callisto. Any ideas for why there is a dark halo/depression surrounding some of these features? -Mike -------------------- Some higher resolution images available at my photostream: http://www.flickr.com/photos/31678681@N07/
|
|
|
|
|
Jun 6 2007, 10:57 PM
Post
#81
|
||
|
Senior Member Group: Moderator Posts: 2785 Joined: 10-November 06 From: Pasadena, CA Member No.: 1345 |
Here is an image of the feature (multi-ring Minrva style crater?) at 12.3 N, 43.8 W. :
Yellow arrow indicates the putative pumice field discussed in the above posts. Outline of "outer bright rim" of crater in dashed orange. (I also indicated the location of the T3 and T17 swaths in the image just to show how close they were to snagging this feature. Double-bummer!) Image modified from Exploitcorporations Fensal-Aztlan mosaic. -Mike -------------------- Some higher resolution images available at my photostream: http://www.flickr.com/photos/31678681@N07/
|
|
|
|
|
|
|
Jun 6 2007, 11:21 PM
Post
#82
|
|
|
Senior Member Group: Moderator Posts: 3233 Joined: 11-February 04 From: Tucson, AZ Member No.: 23 |
Yeah, I just don't see how that is similar to Menrva (or Sinlap, which it is close in size to). To me, it would appear that the feature outlined in the yellow ring of dots is a Ganesa-like pancake dome. It doesn't appear to be a depression, like Sinlap, given that dark material has not covered what would be the crater floor, but some intermediate albedo material has been deposited on it. That material is not nearly as dark as the material that has partially filled in Sinlap and Menrva. Several flow like features can be seen spreading out from the eastern margin, the most prominent of these makes a left turn and flows to the north of the volcanic dome.
-------------------- &@^^!% Jim! I'm a geologist, not a physicist!
The Gish Bar Times - A Blog all about Jupiter's Moon Io |
|
|
|
|
Jun 6 2007, 11:59 PM
Post
#83
|
|
|
Senior Member Group: Moderator Posts: 2785 Joined: 10-November 06 From: Pasadena, CA Member No.: 1345 |
I was taking the analogy of it looking like it had a multi-ring appearance (like Minrva). It looks kinda like a squished blurry sand dollar.
Maybe a better term would be "multi-ring circular feature". That leaves open the possibility that it is impact, cryovolcanic, or impact/cryovolcanic, (and diapir). There is another similar looking thing at 5 N, 343 W (in Aaru). Actually, I think there are a couple of these multi-ring things in the Fensal-Aaru area. I'm working on a huge post of speculative "circle features". -Mike -------------------- Some higher resolution images available at my photostream: http://www.flickr.com/photos/31678681@N07/
|
|
|
|
|
Jun 7 2007, 12:11 AM
Post
#84
|
|
|
Senior Member Group: Moderator Posts: 3233 Joined: 11-February 04 From: Tucson, AZ Member No.: 23 |
Now that feature in Aaru reminds me of Menrva, with a central bright spot, surrounded by a ring of dark material, surrounded by a ring of bright material. I just don't see a multi-ring structure at that feature at that feature northern Fensal.
-------------------- &@^^!% Jim! I'm a geologist, not a physicist!
The Gish Bar Times - A Blog all about Jupiter's Moon Io |
|
|
|
|
Jun 7 2007, 12:36 AM
Post
#85
|
|||||||||
|
Senior Member Group: Moderator Posts: 2785 Joined: 10-November 06 From: Pasadena, CA Member No.: 1345 |
I've put together a list and maps of speculative (perhaps even imaginative) "circular features" in Titan's Equatorial Dune Seas. Some of these appear to have been squished in a particular direction (indicated by the black arrow in the second slide of each set).
Here are the circular features I've imagined in Fensal-Quivra-Aztlan-Aaru region:
And here are the circular features I've imagined in Shagri-La/E Belet region:
Here is a global map of Titan with the imagined circle features in the Equatorial Dune Seas indicated:
I've put all this data in an attached EXCEL file. These show the named area, the inner diameter (for bright center features this is the diameter of the bright center, or dark centers this is the diameter of the dark center), and the outer diameter (for dark halo features this is the outer limit of the dark zone, for impact craters this is the diameter of the bright ejecta zone). Both the long axis and short axis are entered. (If the craters are not squished, they are the same). If the craters appear squished, I've noted the vector of the compression from North = 0. I've classified them into five morphology types: bright center dark halo circle features (bright center by ISS or RADAR) outer dark halo only (no bright center) multi ring circle features (maybe like Minrva, or maybe not) dark center bright rim (actually apron) impact craters bright rim craters (eroded impact craters?) I've also calculated the ratio of inner/outer rim diameters (using the longest axis), as well as the "squish factor" by dividing inner(long) diameter/inner(short) diameter as well as outer(long)/outer(short) diameters) The EXCEL file is available here:  Equatorial_Sand_Sea_Crater_Morphology_20070606.xls ( 31.5K )
Number of downloads: 320
Equatorial_Sand_Sea_Crater_Morphology_20070606.xls ( 31.5K )
Number of downloads: 320Happy sorting and data analysis! Enjoy! -Mike -------------------- Some higher resolution images available at my photostream: http://www.flickr.com/photos/31678681@N07/
|
||||||||
|
|
|
||||||||
|
Jun 7 2007, 12:56 AM
Post
#86
|
|
|
Senior Member Group: Moderator Posts: 3233 Joined: 11-February 04 From: Tucson, AZ Member No.: 23 |
The problem is that most of those are oblong features, not circular features and I think it is doubtful those are actually impact features.
-------------------- &@^^!% Jim! I'm a geologist, not a physicist!
The Gish Bar Times - A Blog all about Jupiter's Moon Io |
|
|
|
|
Jun 7 2007, 01:07 AM
Post
#87
|
|
|
Senior Member Group: Moderator Posts: 2785 Joined: 10-November 06 From: Pasadena, CA Member No.: 1345 |
Yup. I think you're right. Most the features may have an entirely different (non-impact) type of origin
I find it interesting how the apparent compression seems to be parallel for many of the "features" (similar generation?) I also find it interesting how the compression in the Shangri-La basin seems to be perpindicular to the long parallel ridges. Did a later tectonic extension squish originally circular features into oblong shapes? If it is not impact, it's probably cryovolcanic (or cooler diapir). Do you have any idea of a cryovolcanic process that could cause a depression to make the outer dark halo? (Thermal plume?) -Mike (P.S. There is one feature that I'll bet is an actual impact feature: -22 S, 340 W in W Senkyo. In my imagination it has a dark center, but a broad bright circular apron in ISS. ). -------------------- Some higher resolution images available at my photostream: http://www.flickr.com/photos/31678681@N07/
|
|
|
|
|
Jun 7 2007, 09:40 AM
Post
#88
|
|
|
Senior Member Group: Members Posts: 3516 Joined: 4-November 05 From: North Wales Member No.: 542 |
Where do you find the time, Mike???? Anyhow thanks for that spreadsheet- the one download was me.
|
|
|
|
|
Jun 7 2007, 06:50 PM
Post
#89
|
|
|
Senior Member Group: Moderator Posts: 2785 Joined: 10-November 06 From: Pasadena, CA Member No.: 1345 |
QUOTE (ngunn @ Jun 7 2007, 05:40 AM) Where do you find the time, Mike???? Science never sleeps. -Mike (Actually, at 90 F and 90% humidity, spending weekends gardening in the hot sun seems less attractive than thinking about a frozen world without ticks, mosquitoes, or browsing deer...) -------------------- Some higher resolution images available at my photostream: http://www.flickr.com/photos/31678681@N07/
|
|
|
|
|
Jun 14 2007, 02:49 PM
Post
#90
|
||||
|
Senior Member Group: Moderator Posts: 2785 Joined: 10-November 06 From: Pasadena, CA Member No.: 1345 |
Approximately 60% (30 out of 50) of the circular/oval features in the EXCEL table from post 85 (above) can be described as bright center dark halo circular features.
Here are a few examples by ISS, RADAR and RADAR/ISS imaging:
From the supposed deposition sequence and topology above, the ISS brightness is assumed to be terrain that was above the high methane mark during the last big inundation (after bright stuff was deposited). The RADAR brightness is assumed to be due to rough terrain. So: ISS bright, RADAR bright center = rough terrain left high and dry during last inundation. ISS dark, RADAR dark = smooth low lying terrain where bright stuff was dissolved/modified/washed away during the last inundation. (Either low lying dune sands (VIMS dark brown) or ice sands (VIMS dark blue)). Most likely, the bright center dark halo circular features have a rough central plateau or dome surrounded by a smooth depression. Taking Coats Facula as an example, here are images showing hypothetical makeup that could explain the observed morphology:
(Coats Faculas opening is downwind, thus dune sands were not able to penetrate into the dark halo. VIMS imaging of Coats Facula shows that the halo consists of dark blue ice sands. Other halo depressions where dune sands can easily penetrate should appear dark brown by VIMS). The proposed deposition sequence is the same as in post 21 (in this thread), except instead of the word crater substitute the awkward phrase bright center dark halo circular feature. -Mike -------------------- Some higher resolution images available at my photostream: http://www.flickr.com/photos/31678681@N07/
|
|||
|
|
|
|||
|
Jun 14 2007, 07:23 PM
Post
#91
|
|
|
Senior Member Group: Moderator Posts: 2785 Joined: 10-November 06 From: Pasadena, CA Member No.: 1345 |
Here is a short list of possible suspects for the bright center dark halo circular features:
(Listed in order of drama: high energy impact is high drama (and would be way rad to watch happen!), a slow cold diapir slowly working its way to the suface is low drama (and not real exciting to watch). External: Impact origin followed by modification (impact then maybe cryovolcanism or slow crustal rebound?): 1) Modified impact crater (up-lifted dome) 2) Modified palimpsest/type II palimpsest/penepalimpsest 3) Modified central dome crater Internal: Cryovolcanic origin 4) Collapsed pancake dome 5) Thermal plume 6) Ice pluton 7) Diapir The difficult thing to explain is the formation of a topographically depressed halo around the central dome or plateau. Any ideas? -Mike -------------------- Some higher resolution images available at my photostream: http://www.flickr.com/photos/31678681@N07/
|
|
|
|
|
Jun 15 2007, 09:28 AM
Post
#92
|
|
|
Senior Member Group: Members Posts: 3516 Joined: 4-November 05 From: North Wales Member No.: 542 |
QUOTE (Juramike @ Jun 14 2007, 08:23 PM) The difficult thing to explain is the formation of a topographically depressed halo around the central dome or plateau. I have to say that I feel uncomfortably out on a speculative limb here. In particular I think your assumption that elevation and liquid levels are the only determinants of the light/dark patterns is unsafe. However, going along with it for now I don't find it too hard to imagine the outer skin of an ice diapir being richer in volatile materials, making it more prone to deflation by outgassing and/or erosion. One could envisage a dark depression appearing first, acquiring a bright centre later as more of it emerges. |
|
|
|
|
Jun 15 2007, 06:24 PM
Post
#93
|
|
|
Senior Member Group: Moderator Posts: 2785 Joined: 10-November 06 From: Pasadena, CA Member No.: 1345 |
QUOTE (ngunn @ Jun 15 2007, 05:28 AM) I have to say that I feel uncomfortably out on a speculative limb here. In particular I think your assumption that elevation and liquid levels are the only determinants of the light/dark patterns is unsafe. I'm totally cool with your concerns. All of these speculations are built up on the original speculations of a bright/dark level being pretty much set by "the last inundation sea level". (= "house of cards"?) (There may be some effect of dark brown dune sands drifting in from the W as well). It is also built up on the speculation that most of the sand sea basins (exception: Mezzoramia) are interconnected and have a "last inundation sea level" at the same gravitational level of the geoid. (The semi-permanent tidal bulge will make a difference in absolute elevation). A key observation that supports this hypothesis is that at the Huygens site (granted, only one local observation), the bright dark boundary appeared to be very close to the "seashore" of the islands. Hopefully this hypothesis would be easily testable from an altimetry track across one or several Sand Sea Basins. If the above hypothesis is correct, we should observe the bright/dark boundary at the same (tidal bulge effects taken into account) absolute elevation across all the basins. Alternate hypotheses for setting the light/dark boundary include: * local "bright stuff" snow line: (if bright stuff is solid material) * local methane rain virga limit (assuming bright stuff has been scrubbed clean by methane percolation) * local "fog elevation" (assuming methane fog helped dissolve out bright material) (If y'all got any others?) Like any other supposition, if data comes in that torpedoes these assumptions, it'll be time to modify the hypothetical sequence. But so far, everything seems kinda consistent.... So far.... -Mike -------------------- Some higher resolution images available at my photostream: http://www.flickr.com/photos/31678681@N07/
|
|
|
|
|
Jun 15 2007, 11:18 PM
Post
#94
|
|||||||
|
Senior Member Group: Moderator Posts: 2785 Joined: 10-November 06 From: Pasadena, CA Member No.: 1345 |
From the circular features EXCEL table above, I attempted to plot the morphometry of the Titan circle features using a plot similar to that found in Jones et al. Icarus, 164 (2003) 197-212 Morphology and origin of palimpsests on Ganymede based on Galileo observations. (Pay article: Abstract here) . The data in the referenced paper can be found in Table 2 and the plot is in Figure 12 (p. 209 in the reference).
Taking the data for the circular features on Titan in the EXCEL table, I plotted the outer diameter (long axis) as the x component and the inner diameter (long axis) as the y component in a logarithmic graph. I also included (red circles) the unity line for [outer diameter (x), outer diameter (y)]. Only circle features that have two measured diameters (outer and inner) will lie off the unity line.
Yellow diamonds are bright center dark halo circle features [dark halo diameter (x), bright center (y)]. Purple dots are bright rim only circle features [bright rim diameter (x), bright rim diameter (y)). These are buried on the unity line. Green squares are dark center bright apron impact craters [pedestal deposit = apron [x], crater rim [y]] Orange squares are multi-ring impact basins [outermost rim diameter (x), innermost rim diameter (y)]. If the inner rim could not be measured, the point will be buried on the unity line as [outer (x), outer (y)]. Deep purple crosses are dark halo circle features [outermost rim diameter (x), outermost rim diameter (y)] and the points are buried on the unity line. It is interesting to note that the putative impact craters (green squares) and the bright center dark halo circle features (orange squares) all pretty much lie on the same line (at least as far as a log plot goes). This shows that the ratio of crater rim diameter/pedestal deposit diameter for putative impact craters on Titan is similar to the ratio of the bright center diameter to dark halo diameter when plotted on a log scale. Where multi-ring craters had two rings measured, these points also fit in the same log-scale relationship. The Jones et al. article defined the correspondence of morphological units between craters, palimpsests, and penepalimpsests on Ganymede and Europa. So: (palimpsests, craters) Outer deposits = continuous ejecta Concentric massif facies = pedestal deposit Unoriented massif facies = crater rim Central plains = central pit Here are pictures of a crater (Melkart), a palimpsest (Buto Facula), and a penepalimsest (dome crater) (Nieth) showing the defining units. (All are on Ganymede).
In the paper, several impact craters, ring structures and palimpsests on Europa and Ganymede were plotted in the same type of graph. (Palimpsests and ring structures used in the text: Callanish, Tyre, Buto Facula, Zakar, Memphis Facula, Epigeus; Craters: Achelous, Sebek, Isis, Melkart, Osiris, and Enkidu). Adapting the derived lines from the Jones et al paper onto the graph of circle features of Titan we get this plot: (By definition in the paper, the crater rim or unoriented massif facies is the unity line, so it should be no surprise that it lines up with the Titan circle feature unity line (red dots) as well.) It is interesting that the central plains/central pit to unoriented massif facies/crater rim points line up almost with the yellow diamond, green squares and orange squares in the Titan plot.
Adapting the derived lines from the Jones et al paper onto the graph of circle features of Titan, but this time shifting the reference diameter to concentric massif facies/pedestal deposit we get this plot. (So by the new definition, the pedestal deposit/concentric massif facies is the unity line, so it should be no surprise that it lines up with th eTitan circle feature unity line (red dots) as well.) Again, it is interesting that the central plains/central pit to unoriented massif facies/crater rim points line up almost with the yellow diamond, green squares and orange squares in the Titan plot.
Neither plot proves that the circle features of Titan have an impact origin. But they do show that the ratio of corresponding morphological facies with those of craters, palimpsests, and ring structures of the Jovian moons (well, at least Ganymede and Europa) are similar, at least at the level of a log plot. A better plot would show Saturn system inner dome craters and their relationship to Titan circle features -Mike -------------------- Some higher resolution images available at my photostream: http://www.flickr.com/photos/31678681@N07/
|
||||||
|
|
|
||||||
|
Jun 20 2007, 01:57 AM
Post
#95
|
|||||||||
|
Senior Member Group: Moderator Posts: 2785 Joined: 10-November 06 From: Pasadena, CA Member No.: 1345 |
I plotted the outer/inner diameter measurements of the selected large craters on Tethys, Rhea, and Iapetus on the same plot as the circular features of Titan. The selected craters are: Odysseus on Tethys, Tirawa on Rhea, and the crater located at 5N, 38W on Iapetus. The topoglogy of Odysseus and Tirawa was described in Moore et al. Icarus 171 (2004) 421-443. "Large impact features on middle-sized icy satellites". Below are the topological profiles of Odysseus and Tirawa and a plot of Titan circle features with selected craters from some of Saturns other moons.
Here are the measurements and plots of Titan circle features with 4 selected larger craters from Ganymede and Callisto (measured values are from the text). (Two central dome craters, an anomalous central dome crater, and Gilgamesh which may also be a central dome type crater):
According to the text in Schenk et al Ages and Interiors: The Cratering Record of the Galilean Satellites (Available in html-only http://66.102.1.104/scholar?hl=en&lr=&...s+and+Interiors ]here[/url]): These domes have rounded profiles up to 1.5 km high but at high resolution are characterized by web-like networks of narrow fractures. (They also invoke that Gilgamesh and Lofn may qualify as central dome craters). Also, Like cental pits (craters), the dome/crater size ratio increases with increasing crater diameter. In contrast, the ratio between dome and rim diameter for [anamolous dome craters] (whether observed or estimated from ejecta deposit scaling) is roughly constant at 0.4, regardless of crater size. (I hope I got the correct diameter for the rim of the 54N, 43W Crater on Callisto: I measured 90 km, but the text stated 180 km for the rim) Below are the measurements for a (putative) cryovolcano on Titan, Ganesa Macula. The ratio of outer diameter to central radar bright zone is about 0.11 for the 200 km pancake dome (n = 1, so who knows if this is typical.) In contrast, a 200 km bright center dark halo feature usually has a 60 km bright center, for outer/inner diameter of 0.3. Below are the images and plots.
Below are the measurements from topographical analysis of dome-like bulges in chaotic terrain on Europa. These bulges are thought to be diapirs. Below are the images and comparision a plot of Titan circle features.
As described in Shenk, Journal of Geophysical Research 100 (E9) (1995) 19,023-19,040. The geology of Callisto: Bright domes fill most central pits in craters larger than 60 km (in Galilean moons), and have morphologies consistent with an intrusive origin. Dome formation could have occurred after crater formation as diapiric intrusions of soft ice, or during crater formation and collapse by the uplift of deep material, as occurs in central peak craters on Earth and the Moon. Im curious to know if a web-like network of narrow fractures would create a chaotic terrain that would then appear RADAR-bright by SAR. At least for the Galilean satellites, Fracture domes on these [Galilean] domes resemble those formed in a thin chilled crust over plastic material deforming under gravity (e.g., pancake domes on Venus). This suggests that uplifted dome material deformed plastically during or after emplacement, as would be expected for warm material rapidly uplifted several kilometers and left to cool to space. Dome profiles can be used to model the rheology of the uplifted material during emplacement. From all the graphs and plots, it seems that a cryovolcanic pancake dome, like Ganesa Macula, seems to be the worst fit with the data (but remember, n = 1). The best fit seems to be for an impact origin, at least for most of the smaller craters (<900 km). As stated above, diapiric rise of material after impact might explain the observed morphology of the bright center, dark halo circle features. A pure diapiric origin may fit for some of the largest circle features (those >900 km). Unfortunately, I couldnt find any really big examples (>1000 km) of diapirs so I cant compare morphology with Titans bright center dark halo circle features. Smaller craters: impact Bigger circle features: impacts and diapiric doming Biggest circle features impacts and diapiric doming OR just plain old diapirs. -Mike -------------------- Some higher resolution images available at my photostream: http://www.flickr.com/photos/31678681@N07/
|
||||||||
|
|
|
||||||||
|
Jun 20 2007, 09:42 PM
Post
#96
|
|
|
Senior Member Group: Members Posts: 3516 Joined: 4-November 05 From: North Wales Member No.: 542 |
Juramike I salute your work, but sadly I doubt if there is an 'amateur' here now who can enter a critical discourse on your evidence and findings at the level they deserve. I excuse our resident professionals because of course they conduct most of their discourse in their own arena. I'd just like to register a few points, easily made armchair comments compared with what you are doing.
Philosopy My preference at the moment is to hedge my bets as far as global models for Titan are concerned. Many of my ideas about the place are mutually contradictory (you've probably noticed!) but I'm happy with that and prefer to keep it that way until we have done more plain and simple looking. I'm not comfortable in a 'house of cards', even one that seems to be holding up well at the moment. I'm on the lookout for surprises - the sort of thing that brings card houses down. I don't want to miss one because I've formed a view too early. next bit in following post |
|
|
|
|
Jun 20 2007, 10:02 PM
Post
#97
|
|
|
Senior Member Group: Members Posts: 3516 Joined: 4-November 05 From: North Wales Member No.: 542 |
Ganymede et.al.
Undoubtedly we can look to the Galileans and other moons of Saturn for guides to Titan's likely bulk composition. Also, large impacts might be expected to produce comparable surface features. However I think it's worth reviewing the actual and potential differences. In the first place neither the ISS albedo patterns nor the topography revealed by radar on Titan remotely resemble any other body. Secondly it is reasonable to expect that the the geology of Titan will reflect the fact that volatiles brought to the surface are not immediately vented into space. On Earth the recycling of water lubricates plate tectonics. We have no idea what analogous processes may operate on Titan. Thus we don't know even if ancient circles would remain circular - or even remain at all. More data required! Mars There are craters on Mars with narrow rims and others with wide aureoles, plus a huge variety of other circular forms. The role of volatiles seems to be important there. Have you tried out your ideas on Martian circular features? |
|
|
|
|
Jun 21 2007, 03:15 PM
Post
#98
|
|
|
Senior Member Group: Moderator Posts: 2785 Joined: 10-November 06 From: Pasadena, CA Member No.: 1345 |
QUOTE (ngunn @ Jun 20 2007, 05:42 PM) Philosopy My preference at the moment is to hedge my bets as far as global models for Titan are concerned. Many of my ideas about the place are mutually contradictory (you've probably noticed!) but I'm happy with that and prefer to keep it that way until we have done more plain and simple looking. I'm not comfortable in a 'house of cards', even one that seems to be holding up well at the moment. I'm on the lookout for surprises - the sort of thing that brings card houses down. I don't want to miss one because I've formed a view too early. I can respect your caution. My philosophy is to try to build a model that tries to fit and explain the current observations and is hopefully predictive of future observations. My personal scientific philosopy that even a bad model is better than no model. (If it's proven wrong, at least we can say "Well, it's not that!") Building a model will hopefully tell us where to look to support/disprove the model. Always bearing in mind the important rules of science: "You can never prove a theory." (You can provide evidence that supports a theory, but you can never prove it.) "Absence of evidence is not evidence of absence." "You can't zoom a zoomer." (Zoom, schwarz, profigliano, beterman rules here) I'm hoping that an initial model will also help to develop experiments in the lab as well as plan what future observations might be helpful. And scientific models are built to be modified, mangled, ripped up, parted out, and reassembled, and if need be, totally thrown out the window. [The standard scientific bet in our lab is a quarter: some days I'm lucky and the quarter is on my desk, other days when my hypotheses don't do so well, it goes to a someone with a better predictive model] And please continue to be on the lookout for suprises, those are the key observations that will help build the next (always better) model... -Mike -------------------- Some higher resolution images available at my photostream: http://www.flickr.com/photos/31678681@N07/
|
|
|
|
|
Jun 21 2007, 03:36 PM
Post
#99
|
|
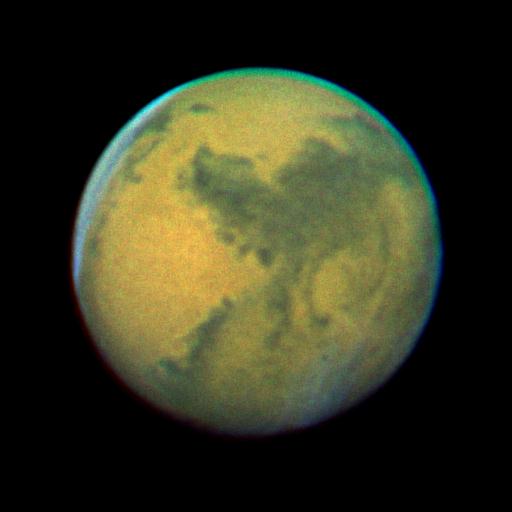 Senior Member Group: Members Posts: 3419 Joined: 9-February 04 From: Minneapolis, MN, USA Member No.: 15 |
QUOTE (Juramike @ Jun 21 2007, 10:15 AM) "You can't zoom a zoomer." (Zoom, schwarz, profigliano, beterman rules here) OMG! I haven't played that particular drinking game in 30 yers! (I believe, at the time I learned it, that 'Beterman' hadn't codified it yet -- it was simply known to me as "Zoom-Schwartz-Profigliano-Zoom.") I learned that game in my junior year of college (otherwise known as the Great Sodden Semester... )I totally agree in terms of developing models, even on insufficient data, Mike. It is often the process of building a model that shows you what's not consistent with your base assumptions, and sends you out looking for data to confirm or deny certain of those base assumptions. It is perhaps possible to learn more by simply going out and collecting every scrap of data that you possibly can, but we all know that data-collection schemes (and the sensors used to collect the data) are so specialized these days that you have to triage -- you have to decide in advance what kind of data you're going to collect in any given scheme (read: any given mission). For that task, you need a model and you need a set of base assumptions that you want to test. Without that, you can end up either getting tantalizing hints of things you just didn't have the tools to investigate or, worse, you miss something extraordinary that you could have seen if you had flown the proper types of sensors. -the other Doug -------------------- The trouble ain't that there is too many fools, but that the lightning ain't distributed right. -Mark Twain
|
|
|
|
|
Jun 21 2007, 04:04 PM
Post
#100
|
|
|
Senior Member Group: Moderator Posts: 2785 Joined: 10-November 06 From: Pasadena, CA Member No.: 1345 |
QUOTE (ngunn @ Jun 20 2007, 06:02 PM) Ganymede et.al. Undoubtedly we can look to the Galileans and other moons of Saturn for guides to Titan's likely bulk composition. Also, large impacts might be expected to produce comparable surface features. However I think it's worth reviewing the actual and potential differences. In the first place neither the ISS albedo patterns nor the topography revealed by radar on Titan remotely resemble any other body. Secondly it is reasonable to expect that the the geology of Titan will reflect the fact that volatiles brought to the surface are not immediately vented into space. The geology of most the Saturnian moons should be very, very similar. Geologically, they are all brothers and brought up in the same house (Saturn orbit). The big differences with Titan compared to the other Saturn moons are with regard to impactors are: it has weather and floods (erosion will erase many of the features) it's bigger: tectonic activity? cryovolanic activity? (might erase many of the features) it's bigger (compositional makeup, depth of lithosphere) it has an atmosphere (small impactors burn up, a big impactor should not be affected, but venting might be suppressed [very good point, ngunn]) it has organics on the surface (but this might not be enough to make a difference) it's bigger: faster impactor speed??? The first two factors could help explain why there are so few obvious impact craters (they get wiped), and may explain their different form compared to other moons. IIRC (but I can't remember the source), the impact features of Saturnian moons (other than Titan) seem to resemble the impact features of terrestrial planets more than those of Galilean satellites. The Galilean satellites seem to be sorta "oddball" (compositional differences of target material? lithosphere differences? impactor differences?). So we would predict that without erosion, Titan craters should look like other Saturn moon craters/terrestrial craters with a possible trend to Galilean craters. (The trend being due viscous relaxation of icy surfaces on larger bodies). QUOTE (ngunn @ Jun 20 2007, 06:02 PM) Ganymede et.al. On Earth the recycling of water lubricates plate tectonics. We have no idea what analogous processes may operate on Titan. Thus we don't know even if ancient circles would remain circular - or even remain at all. More data required! I don't think ancient circles remain circular at all....(I think some of this data might already exist)... -Mike -------------------- Some higher resolution images available at my photostream: http://www.flickr.com/photos/31678681@N07/
|
|
|
|
 |

|
Lo-Fi Version | Time is now: 16th May 2024 - 02:58 PM |
|
RULES AND GUIDELINES Please read the Forum Rules and Guidelines before posting. IMAGE COPYRIGHT |
OPINIONS AND MODERATION Opinions expressed on UnmannedSpaceflight.com are those of the individual posters and do not necessarily reflect the opinions of UnmannedSpaceflight.com or The Planetary Society. The all-volunteer UnmannedSpaceflight.com moderation team is wholly independent of The Planetary Society. The Planetary Society has no influence over decisions made by the UnmannedSpaceflight.com moderators. |
SUPPORT THE FORUM Unmannedspaceflight.com is funded by the Planetary Society. Please consider supporting our work and many other projects by donating to the Society or becoming a member. |
|