Experimental Rhea DEM animation, Generated from stereo images |

  |
Experimental Rhea DEM animation, Generated from stereo images |
 Jul 21 2007, 09:10 PM Jul 21 2007, 09:10 PM
Post
#1
|
||||||
 IMG to PNG GOD  Group: Moderator Posts: 2250 Joined: 19-February 04 From: Near fire and ice Member No.: 38 |
It works!! For months I've been trying to get my program for generating DEMs from stereo images to work properly. A recent 'rant' of mine can be found here.
Well, to make a long story short my software now at last works:
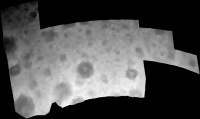
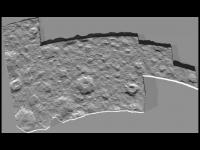
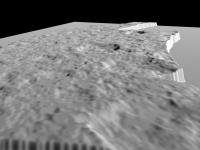
The only drawback is that the DEM has a somewhat 'contoured' appearance. This shows up in renderings of the DEM, even after I smoothed it considerably using Photoshop. Still this is much better than the infamous horizontal lines I got in my shape from shading experiments. A rendering showing the DEM:
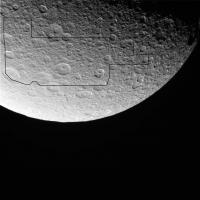
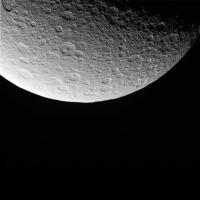
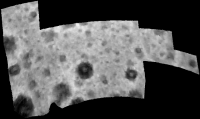
However, 2-3 meters away from the monitor this looks very nice (the thumbnail image also looks nice  ). It turns out that the software has managed to detect most of the craters except for the really small ones. If someone finds a way to process the DEM image and remove the 'contours' without excessive loss of details I'd like to know. Please note that the DEM is a 16 bits/pixel image. ). It turns out that the software has managed to detect most of the craters except for the really small ones. If someone finds a way to process the DEM image and remove the 'contours' without excessive loss of details I'd like to know. Please note that the DEM is a 16 bits/pixel image.Some additional notes on the DEM: The DEM is a section from a 4320x2160 pixel simple cylindrical map and has an altitude range of approximately 16 km. The lowest points (black) are 778.6 km from Rhea's center and the highest ones (white) are 794.5 km from Rhea's center. This is odd (Rhea's dimensions are 768x763x763 km) and is probably due to inaccuracies in the viewing geometry information that came with the PDS files I used. The overall lower elevation of the upper part of the DEM compared to the lower part is probably another manifestation of this. I used these two images obtained in January 2005:
North is to the right in the images. Looking at the images it is apparent that the DEM's heavily contoured appearance at upper left is (probably) due to the fact that there wasn't a very big difference in the viewing geometry in that area whereas in the lower part of the DEM the difference is significant. Taking a section of Steve Albers' map and draping it over the DEM produces interesting results (The crater at ~(315,260) in the DEM is at ~(3440,1160) in Steve's map). Here is a quick-and-dirty animation: Rhea experimental DEM animation (4.6 MB) In contrast, without Steve's map things get less realistic:
However, now the lightsource can be anywhere. Needless to say I'm happy. The only problem is the huge number of DEMs I want to do: All of Saturn's major satellites (everything that can be done - global if at all possible), various sites on Mars etc. This is a lot of work, the DEM of Rhea required 100+ manually measured control points and then took almost 4 hours to compute on a 3 GHz machine. Also the viewing geometry needs to be refined. |
|||||
 |
 
|
|||||
|
Jul 21 2007, 09:17 PM
Post
#2
|
|
 Senior Member Group: Members Posts: 3648 Joined: 1-October 05 From: Croatia Member No.: 523 |
It's probably saying something you already know, but the contoured appearance of the rendering looks to be directly related to the low number of discrete elevations. The DEM looks like a 16 level grayscale in other words, quantized elevations. Is this due to limitations of your software or limitations of the data?
Needless to say, this is a most impressive undertaking of yours! -------------------- |
|
|
|
|
Jul 21 2007, 10:15 PM
Post
#3
|
|
 Senior Member Group: Members Posts: 1624 Joined: 5-March 05 From: Boulder, CO Member No.: 184 |
Interesting work Bjorn. For the contouring, perhaps an algorithm could determine the direction of the gradient, then interpolate between the contour levels along that direction to smooth out the steps?
On the AVI file, is there a player other than Quicktime that can show it? Unfortunately this wasn't working on my laptop. -------------------- Steve [ my home page and planetary maps page ]
|
|
|
|
|
Jul 22 2007, 01:43 AM
Post
#4
|
|
|
IMG to PNG GOD Group: Moderator Posts: 2250 Joined: 19-February 04 From: Near fire and ice Member No.: 38 |
Regarding possible quantized elevations there are many different elevation values (definitely thousands or even tens of thousands) - the contoured appearance is not an artifact of a conversion to 16 bit unsigned integers. It may be possible to get at least marginally better results - I'm still getting a feel for how various different parameters affect the resulting DEMs. The program does not calculate anything to subpixel accuracy - instead I decided to be lazy and simply enlarge the images in Photoshop when I want subpixel accuracy (this also makes it easier to measure the control points). In this case I was using images enlarged by a factor of four. I'm going to try a factor of 8 instead and see what happens. The only problem is that using a factor of 8 the DEM takes a much longer time to calculate than when I use a factor of 4.
The AVI file is encoded using DivX. Those who cannot view the animation should take a look at http://www.divx.com/ . |
|
|
|
|
Jul 22 2007, 01:46 AM
Post
#5
|
|
 Junior Member Group: Members Posts: 76 Joined: 4-June 07 From: United Kingdom Member No.: 2288 |
Well, that's great. I've been frustrated by things like the tiny number of Mars Express DEM's.
Are you planning on releasing this software ? I know that if you can get coders interested then there are people who are very experienced with optimising software. You could use a site like sourceforge ( sf.net ) to manage a project but there are other ways as well. mouseonmars -------------------- |
|
|
|
|
Jul 22 2007, 03:23 PM
Post
#6
|
|
 Member Group: Members Posts: 159 Joined: 4-March 06 Member No.: 694 |
I downloaded the the .avi file and it runs perfectly using Winamp 5.35 . Winamp plays .avi files very well and here's the site to download it from.
http://www.winamp.com -------------------- I call heaven and earth to witness against you this day, that I have set before thee life and death, the blessing and the curse; therefore choose life, that thou mayest live, thou and thy seed.
- Opening line from episode 13 of "Cosmos" |
|
|
|
|
Jul 22 2007, 06:53 PM
Post
#7
|
|
|
Senior Member Group: Members Posts: 1624 Joined: 5-March 05 From: Boulder, CO Member No.: 184 |
Great - winamp works well for me. And that's a nice fly around Rhea Bjorn.
-------------------- Steve [ my home page and planetary maps page ]
|
|
|
|
|
Jul 23 2007, 06:49 AM
Post
#8
|
|
|
Senior Member Group: Members Posts: 1870 Joined: 20-February 05 Member No.: 174 |
"...I downloaded the the .avi file and it runs perfectly using Winamp 5.35 ...."
I had no problem playing the file with Media Player Classic with a codec megapack <open source plays damn near everything> One thing I can't play is the current version of Quicktime movies. I havent migrated off Win98se and there's no codec for them in 98se. |
|
|
|
|
Jul 24 2007, 02:42 AM
Post
#9
|
|
 Member Group: Members Posts: 656 Joined: 20-April 05 From: League City, Texas Member No.: 285 |
Bjorn, that is indeed very nifty - impressive even. I have lately been messing-about doing something similar with the MER images (integrated within my APG software). The big trick for me is automatic feature co-registration between image pairs, which I see you have sidestepped by simply doing it manually. At best I'm getting about 50% accuracy at matching up features, probably rather worse; afterward there's a lot of clean-up to do - which requires a combination of stereo viewing to clearly distinguish between good and bad vertices, along with 3D control and editing - neither of which is a feature of APG, and must be done separately. The trick I have not yet mastered (yet you have) is transferring images onto the resulting triangulated surface - though with a fine enough mesh it becomes more a matter of assigning colors than images. For me this remains an ongoing project; it is nice to see your results, and I look forward to seeing more.
I'm curious as to one aspect... are you able to pull the camera positions and orientations relative to the satellite neatly out of some database, or are you having to solve for them as part of the optimization? Bundle adjustment, perhaps? Your link to the StereoMatcher page may be helpful - at the very least there are some nice references there, though I haven't tried the software. I have a little fantasy that by the time MSL gets to Mars we dilettantes may be able to routinely generate DEM's for the MSL mission the way we do route maps for MER, and perhaps be a jump ahead of the pro's. Technically this is feasible even now, but not in a quick & automated fashion, and I have a day job
|
|
|
|
|
Jul 27 2007, 05:34 PM
Post
#10
|
|||
|
IMG to PNG GOD Group: Moderator Posts: 2250 Joined: 19-February 04 From: Near fire and ice Member No.: 38 |
Generating DEMs for MSL the way route maps are generated now would be fun but there are performance issues so I have some doubts. Manually measuring control points also takes a lot of time (I'm using 112 control points for the Rhea DEM) but I may be able to partially automate the process in the future.
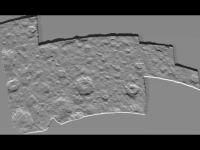
More significantly, I have now managed to make some optimizations and changes with the result that my software is at least 5 times faster than it was a week ago but I still really need more speed. As I suspected the 'contoured' appearance of the DEM was because I was computing the DEM to a subpixel accuracy of only 0.25 (4x4 points per pixel). After increasing this to 6x6 things look much better but now take about 8 hours to compute despite the aforementioned optimizations. Increasing this to 8x8 or even 10x10 would be preferable but is not feasible as the DEM would take several days to compute  . I obviously need a much faster computer. . I obviously need a much faster computer.The DEM now looks like this:
The contours are less obvious now. Also the DEM is no longer 'tilted' (the upper half of the earlier DEM was at lower altitudes than the lower half). This is because I'm using improved viewing geometry - the subspacecraft_line_sample in the PDS files was off by roughly 30 pixels. Black (0) now represents points 760 km from Rhea's center and white (65535) 768.33 km. This agrees well with Rhea's mean radius of 764.4 km. Not unexpectedly, the 'contours' are also less obvious in rendered images of the DEM:
Not perfect but much better than the earlier version. Apparently the size of central peaks somehow gets overestimated rather often but overall I'm happy. I even think this is accurate enough to estimate the depth of some of the craters. For example, the crater at (325,270) in the DEM is approximately 4.5 km deep and its central peak 2-2.5 km high. QUOTE (algorimancer @ Jul 24 2007, 02:42 AM)  I'm curious as to one aspect... are you able to pull the camera positions and orientations relative to the satellite neatly out of some database, or are you having to solve for them as part of the optimization? Bundle adjustment, perhaps? This is one of the things frustrating me - the PDS files contain information on the viewing geometry but as previously indicated, it's not accurate enough. Apparently I can assume the spacecraft position to be correct but the camera pointing needs to be updated - a 30 pixel error in the position of the subspacecraft point in the image is huge. Now the next thing to do is to generate some additional DEMs, possibly of Tethys' Ithaca Chasma and Odysseus, Enceladus hi-res, Iapetus etc. - the list is endless. Disappointingly, there do not seem to be any nice images to use for generating DEMs of Mimas' Herschel crater. However, after checking the recently released SPICE stuff for the extended mission it seems to me that great images should be possible during the 10,000 km flyby in Cassini's extended mission. |
||
|
|
|
||
|
Jul 27 2007, 09:27 PM
Post
#11
|
|
 Member Group: Members Posts: 114 Joined: 6-November 05 From: So. Maryland, USA Member No.: 544 |
Perhaps not surprisingly, I vote for the Iapetus Saturnshine images next. The relationship between the dark material and topography is crucial to understanding what's going on.
Michael |
|
|
|
|
Jul 28 2007, 01:14 PM
Post
#12
|
|
|
Member Group: Members Posts: 656 Joined: 20-April 05 From: League City, Texas Member No.: 285 |
QUOTE (Bjorn Jonsson @ Jul 27 2007, 12:34 PM) I obviously need a much faster computer. If you happen to have a multi-processor (or dual/quad-core cpu), and you're developing in C++ or Fortran, you might try using OpenMP to parallelize some of the loops. I've found it fairly easy to learn and use, and have had good results with a dual-processor system - now I'm wishing for a quad-core
|
|
|
|
|
Jul 28 2007, 02:53 PM
Post
#13
|
|
|
Member Group: Members Posts: 204 Joined: 29-June 05 Member No.: 421 |
QUOTE This is one of the things frustrating me - the PDS files contain information on the viewing geometry but as previously indicated, it's not accurate enough. Apparently I can assume the spacecraft position to be correct but the camera pointing needs to be updated - a 30 pixel error in the position of the subspacecraft point in the image is huge. Yeah, I've seen the same thing looking at Titan. Really it makes sense though. They do know the spacecraft position to an insanely high degree of accuracy. They have to do design the trajectory out for years including flybys. And since they have the accurate model of the Saturn + moons gravitational system, and the spacecraft doesn't do thrust adjustments very often, they can generate a highly refined position model using observations from throughout the mission. Contrast this to roll information. For mission objectives, they need to know pointing accurately enough to aim the antenna at earth and the cameras at the right targets. A 30 pixel error in pointing is 3% of the camera's field of view. That kind of error isn't going to make or break any observation. And in absolute terms, the narrow-angle camera has a field of view of 0.35 degrees, so the error is about 0.01 of a degree. On the other hand, Cassini controls its pointing using momentum wheels which are designed to control accuracy to about 1mrad = 0.0579 degrees. [ref] And its constantly slewing this way or that to aim at a different target or communicate with Earth, so modeling is out. That means the only way to get high accuracy information about pointing is to look at the output of the science instruments and match these with what you expected to see. This is a harder task, and highly dependent on what was being observed, so it isn't a great surprise they didn't do this for the PDS data release. |
|
|
|
|
Jul 28 2007, 06:45 PM
Post
#14
|
|
|
Junior Member Group: Members Posts: 41 Joined: 12-April 06 Member No.: 738 |
Bjorn, this is VERY interesting! Your results are truly awesome. I've been trying unsuccessfully to find any free software, which could generate DEM's from stereo photos, and I am far from having the knowledge to code anything like this.
In a semi-similar attempt I created an elevation map using maps of the Lunar Topographic Orthophotomap (LTO) Series available on the website of the Lunar and Planetary Institute. It took a tremendous effort and a lot of time to manually vectorize all elevation contour lines in order to make a greyscale elevation (bump)map. My goal is to produce a realistic 3d model auf the Taurus-Littrow Valley and the surrounding area. A recent edit of two renders can be seen here and here. Bjorn, I am watching this thread closely, can't wait to see more of this awesome piece of work. May I humbly ask if you can imagine that one day your program could be available to other users as well? Anyway, keep the updates coming.
|
|
|
|
|
Aug 4 2007, 05:08 PM
Post
#15
|
||
|
IMG to PNG GOD Group: Moderator Posts: 2250 Joined: 19-February 04 From: Near fire and ice Member No.: 38 |
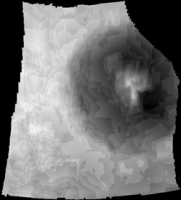
This is a preliminary DEM of Mimas' Herschel crater:
The DEM is very 'contoured' and the only real features detected are Herschel and its central peak. This is because the source images are of relatively low resolution (~1.5 km/pixel) and the subspacecraft point moved only ~7° between the two images I used. Distance from Mimas' center ranges from 182.9 to 202.0 km in the DEM, roughly consistent with Mimas' dimensions (207.4x197.2x190.7 km). This DEM implies the depth of Herschel is probably ~15 km where it is deepest and the height of the central peak about 10 km. This is probably (very?) inaccurate for the reasons mentioned above (low-res/similar subspacecraft point). Images have been obtained that will probably result in a better DEM than this one but these are recent so they haven't been released to the PDS yet. QUOTE (algorimancer @ Jul 28 2007, 01:14 PM) If you happen to have a multi-processor (or dual/quad-core cpu), and you're developing in C++ or Fortran, you might try using OpenMP to parallelize some of the loops. I've found it fairly easy to learn and use, and have had good results with a dual-processor system - now I'm wishing for a quad-core Multithreading is an excellent idea, actually my 3D renderer is already multithreaded and making my stereo software multithreaded as well is trivial. Actually the performance gain in my case is only about 20% as I have a fairly old machine with hyperthreading only but I'm hoping to get myself a quad-core system next year. QUOTE (FordPrefect @ Jul 28 2007, 06:45 PM) In a semi-similar attempt I created an elevation map using maps of the Lunar Topographic Orthophotomap (LTO) Series available on the website of the Lunar and Planetary Institute. It took a tremendous effort and a lot of time to manually vectorize all elevation contour lines in order to make a greyscale elevation (bump)map. My goal is to produce a realistic 3d model auf the Taurus-Littrow Valley and the surrounding area. A recent edit of two renders can be seen here and here. This looks great - very realistic. I may make this software available one day but doing so requires considerable work so I don't know when it might happen. Right now I'm too busy producing DEMs  . .
|
|
|
|
|
|
|

|
Lo-Fi Version | Time is now: 18th April 2024 - 03:01 AM |
|
RULES AND GUIDELINES Please read the Forum Rules and Guidelines before posting. IMAGE COPYRIGHT |
OPINIONS AND MODERATION Opinions expressed on UnmannedSpaceflight.com are those of the individual posters and do not necessarily reflect the opinions of UnmannedSpaceflight.com or The Planetary Society. The all-volunteer UnmannedSpaceflight.com moderation team is wholly independent of The Planetary Society. The Planetary Society has no influence over decisions made by the UnmannedSpaceflight.com moderators. |
SUPPORT THE FORUM Unmannedspaceflight.com is funded by the Planetary Society. Please consider supporting our work and many other projects by donating to the Society or becoming a member. |
|