First public release of Kaguya data |

  |
First public release of Kaguya data |
 Nov 18 2009, 12:41 AM Nov 18 2009, 12:41 AM
Post
#91
|
|
|
Newbie  Group: Members Posts: 2 Joined: 14-November 09 Member No.: 5043 |
I finally got my copy of ENVI running. Opening the MI data was easiest with ENVI. Thanks for the tips tho!
|
 |
 
|
|
Nov 18 2009, 08:09 PM
Post
#92
|
||
|
Junior Member Group: Members Posts: 89 Joined: 27-August 05 From: Eccentric Mars orbit Member No.: 477 |
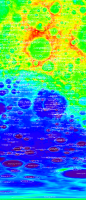
I don't know if this is well known or not, but I am a bit surprised to not see this discussed here. The highest point on the Kaguya data, and therefore their idea of "Mt Everest" is on the wall of a crater, which itself is on the wall of a 500km unnamed crater just north of crater Korolev on the far side
alt: 10715 image x,y: 342 1526 (from bottom right of image) lon,lat: 158.625W 5.375N The lowest point ("Challenger Deep") is on the floor of 140km diameter Antoniadi crater, also on the far side in the South Polar basin. alt: -9138 image x,y: 120 314 lon,lat: 172.5W 70.375S Both of these points are unique, in that there are no other points with the same elevation in the data.
This map has all the craters I could find a list for, the highest point marked in black in the red area near the top, and the lowest point is marked in red in the deep purple area near the bottom. If the crater has a name, it's not in my list and I would love to know it. Edit: Emily already mentioned this in the middle of her blog entry, so no discoveries here. I didn't find any of this until I looked up "Antoniadi" on Google. That "unnamed" crater apparently is provisionally named Dirichlet-Jackson. |
|
|
|
|
|
|
Nov 19 2009, 01:25 AM
Post
#93
|
|
 Senior Member Group: Moderator Posts: 3431 Joined: 11-August 04 From: USA Member No.: 98 |
Here's a better Moon Globe rotation movie at an oblique angle.
|
|
|
|
|
Nov 19 2009, 07:23 AM
Post
#94
|
|
|
Member Group: Members Posts: 890 Joined: 18-November 08 Member No.: 4489 |
as to the high and low points i have been finding "noise" in the 5760x2880.img
the low point looks like a single pix ( 16bit unsigned "0" in a crater that avg about 300 to 500 ) .I would need to find it again to double check . i just checked and there is noise but not these two points nip2 tells me the min is at ( 120x2565 ) max is at ( 342x1353) min [attachment=19712:Screenshot_min.png] max [attachment=19713:Screenshot_max.png] |
|
|
|
|
Nov 20 2009, 09:03 PM
Post
#95
|
|
|
Newbie Group: Members Posts: 8 Joined: 19-November 09 Member No.: 5052 |
QUOTE (kwan3217 @ Nov 18 2009, 09:09 PM)  This map has all the craters I could find a list for, the highest point marked in black in the red area near the top, and the lowest point is marked in red in the deep purple area near the bottom. If the crater has a name, it's not in my list and I would love to know it. Kwan, The definitive source of lunar names is the IAU Planetary Gazetteer, the most useful version of which, for the present purpose, is Jennifer Blue's Digital Nomenclature Atlas. The high point you located is on the rim of a 43-km diameter crater called Engel'gardt in LAC 69 -- actually on the shared rim of Engel'gardt and the larger ("136 km") Engel'gardt B. You can see a grayscale version of the Kaguya global DEM for this area, with all the current IAU names superimposed using a software called LTVT, here. The misregistration of some of the features relative to where they appear in the Kaguya data is due to inaccuracies in the IAU data, which were originally intended only to be accurate enough to unambiguously identify what feature was meant by each name. I understand the IAU coordinates and diameters may be redone next year using newer and better controlled images. -- Jim |
|
|
|
|
Nov 21 2009, 06:29 PM
Post
#96
|
|
|
Newbie Group: Members Posts: 1 Joined: 20-November 09 Member No.: 5053 |
QUOTE (Michael Zeiler @ Nov 10 2009, 01:50 AM) I downloaded the Kaguya LALT_GGT_NUM data set from JAXA and built a digital terrain model with ArcGIS software. Really nice work Michael. Could you give a short tutorial on how to import the data and convert it into a DEM? What projections are to be used? |
|
|
|
|
Nov 21 2009, 08:43 PM
Post
#97
|
|
|
Newbie Group: Members Posts: 8 Joined: 19-November 09 Member No.: 5052 |
QUOTE (S_Walker @ Nov 6 2009, 01:41 PM) I wonder when we'll see the first program that accurately renders this topographical data so we can really plan our lunar observations... Sean, You may wish to check today's LPOD. -- Jim |
|
|
|
|
Nov 22 2009, 04:43 AM
Post
#98
|
|
|
Newbie Group: Members Posts: 14 Joined: 9-November 09 Member No.: 5032 |
QUOTE (Carsten @ Nov 21 2009, 11:29 AM) Really nice work Michael. Could you give a short tutorial on how to import the data and convert it into a DEM? What projections are to be used? Carsten, I'm glad you like the maps. My method applies the following steps with ArcGIS software (www.esri.com): After downloading the large LALT_GGT_NUM dataset from the JAXA, I used an ArcGIS tool called "ASCII 3D to Feature Class". This tool is designed to import an ASCII file with x,y,z values to create a multipoint feature class, a point data structure designed to scale up to billions of elevation points, such as you encounter with lidar data. From the multipoint feature class, I created a terrain dataset. A terrain dataset is a generic GIS data structure which is essentially a multi-resolution triangulated irregular network. See http://webhelp.esri.com/arcgisdesktop/9.3/...ataset_concepts From the terrain dataset, I exported a raster dataset. From the raster dataset, I applied a geoprocessing model that applies two cartographic effects: hillshaded-relief plus hypsometric tints using a color ramp. This model is described at http://blogs.esri.com/Support/blogs/mappin...de-toolbox.aspx This technique is a modern implementation of shaded relief pioneered by the Swiss cartographer, Eduard Imhof, in his classic book, Cartographic Relief Presentation, first published in 1965. In those maps, I use two map projections, Mollweide for the full global view of the Moon, and Orthographic for the four hemispheric views. Through my work, I have access to the ArcGIS software suite. This is professional grade GIS software that most space enthusiasts could not casually purchase, so I know that my method is not easily adapted by most on this forum. But this was a quick and fun project for me because I am presently writing a textbook on geographic data modeling and this was a good application of terrain visualization methods. Also, when I examined the DEM built from the LALT_GGT_NUM dataset, I found a large fictitious lunar mountain at selenographic coordinates 16d 11m N, 87d 33m E I made a slope map from the Kaguya DEM and categorized the peaks with the greatest slopes on the Moon. Some suspicious lunar peaks are at 48 19 S, 141 22 E, 63 degree slope 16 11 N, 87 33 E, 60 degree slope 20 56 N, 60 32 E, 58 degree slope 48 11 S, 8 48 W, 56 degree slope 32 26 S, 58 57 E, 55 degree slope 22 15 N, 81 53 E, 52 degree slope 59 11 S, 46 16 E, 50 degree slope 61 38 N, 8 16 W, 47 degree slope 66 29 N, 70 10 W, 46 degree slope I don't necessarily assert each one of the peaks are false, but they are suspicious because of their high slope values. regards, Michael Zeiler ESRI |
|
|
|
|
Nov 22 2009, 01:27 PM
Post
#99
|
|
|
Solar System Cartographer Group: Members Posts: 10153 Joined: 5-April 05 From: Canada Member No.: 227 |
Your maps are very nice indeed, Michael.
Apparent peaks caused by bad pixels in the original data are found in many raw DEMs and can be edited out if necessary. A good example can be seen in Google Earth's Moon map at 10.8114 N, 54.3234 E on the southern edge of Mare Crisium - pointed out by Joel Raupe. This is in the high resolution DEM on the Apollo 15 Metric camera strip in that map. Phil -------------------- ... because the Solar System ain't gonna map itself.
Also to be found posting similar content on https://mastodon.social/@PhilStooke Maps for download (free PD: https://upload.wikimedia.org/wikipedia/comm...Cartography.pdf NOTE: everything created by me which I post on UMSF is considered to be in the public domain (NOT CC, public domain) |
|
|
|
|
Nov 23 2009, 04:28 AM
Post
#100
|
|||
|
Newbie Group: Members Posts: 8 Joined: 19-November 09 Member No.: 5052 |
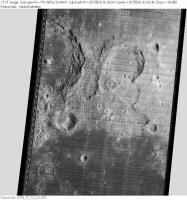
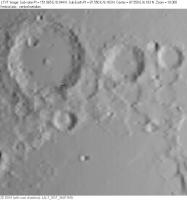
QUOTE (Michael Zeiler @ Nov 22 2009, 05:43 AM) Carsten, Also, when I examined the DEM built from the LALT_GGT_NUM dataset, I found a large fictitious lunar mountain at selenographic coordinates 16d 11m N, 87d 33m E ... Michael, Your 3D renderings (as featured on today's LPOD) are indeed very lovely, but are you sure your coordinate readouts are correct? The Kaguya DEM definitely has some small-scale glitches -- including bad cells, completely missing some craters of ~10 km diameter and representing others as hills -- but I can find nothing particularly strange at the locations you mention. For example, if I am not mistaken, 16d 11m N, 87d 33m E should be sample 1401 in line 1342 of the global DEM. The elevation listed there (at least in the machine-readable, floating point LALT_GGT_MAP.IMG) is -1.490 km (relative to the 1737.4 km reference). None of the 8 nearest neighbor cells differ by more than 100 m (most by much less), which over 1/16th degree (~1.9 km) gives slopes of 3 deg or less. The "large fictitious lunar mountain" you report should be at the exact center of the two attachments (produced with LTVT), which compare the area (with Neper in the upper left) as viewed by Lunar Orbiter IV (1967 May 11 17:30:07 UT) and as predicted for the same circumstances using the Kaguya DEM. I am unable to see anything particularly anomalous at that the center of these images. -- Jim
Attached thumbnail(s)
|
||
|
|
|
||
|
Nov 23 2009, 07:20 AM
Post
#101
|
||
|
Newbie Group: Members Posts: 14 Joined: 9-November 09 Member No.: 5032 |
Thanks Jim, I was pleased to see the map on LPOD. That's a fascinating story about the new possible basin.
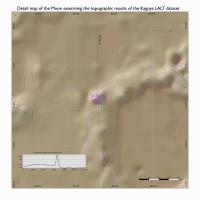
This detail map from the Kaguya DEM shows the peak in question. Is it plausible to have a lunar peak with a slope of about 60 degrees? This peak was the subject of discussion on the Solar Eclipse Mailing List (SEML). We are applying the Kaguya DEM to improve solar eclipse predictions. I had email with Dave Herald who pointed out that the LALT_GGT_NUM DEM data is derived from Kaguya timing data (LALT_LGT_TS) and that the timing data is superior for elevation modeling. (The timing data consists of irregularly spaced points, in contrast to the gridded interpolated points of the LALT_GGT_NUM data) I'm attaching this detail map showing the peak from the DEM data. Dave sent me some timing data points that show that this peak does not exist in the LALT_LGT_TS data and seems to be an error of interpolation. I don't have time tonight to make a map to demonstrate this, but I'll make a map tomorrow. regards, Michael
Attached thumbnail(s)
|
|
|
|
|
|
|
Nov 23 2009, 03:00 PM
Post
#102
|
|
|
Solar System Cartographer Group: Members Posts: 10153 Joined: 5-April 05 From: Canada Member No.: 227 |
Jim and Michael - you're talking about two different places! Michael's crater is a wee bit north of Jim's image, on Goddard crater. (16 N, not 6 N)
Phil -------------------- ... because the Solar System ain't gonna map itself.
Also to be found posting similar content on https://mastodon.social/@PhilStooke Maps for download (free PD: https://upload.wikimedia.org/wikipedia/comm...Cartography.pdf NOTE: everything created by me which I post on UMSF is considered to be in the public domain (NOT CC, public domain) |
|
|
|
|
Nov 23 2009, 08:52 PM
Post
#103
|
|
|
Newbie Group: Members Posts: 8 Joined: 19-November 09 Member No.: 5052 |
My apologies, Michael...
I have always been clumsy converting degrees-minutes-seconds to decimal degrees, and in this case I inadvertently dropped the leading "1" of your degrees number, changing "16N" to "6N". Sorry! You are, of course, completely correct about the location of this set of four bad pixels at 16d 11m N, 87d 33m E (in lines 1181 and 1182 at samples 1401 and 1402 in the global DEM). As Phil points out, they are not at all in the area I was looking at, but rather slightly outside the rim of Goddard, and just east of 12 km Goddard B (represented by the little downward wiggle in the -2000 m contour on your plot). For what little it may be worth, according to the shadows in Lunar Orbiter IV-018H, Goddard B must be 2.4 km deep -- very slightly deeper than Goddard A (which was captured much more clearly in the global DEM, near the upper right margin in your plot) -- and Lunar Orbiter IV did not see any evidence of a sharp shadow-casting peak at 16d 11m N, 87d 33m E, so this feature in the Kaguya global DEM is definitely fictitious. And yes, 60° sounds like quite a steep slope for the Moon, especially if sustained over the ~2 km spacing between adjoining grid points near the equator. -- Jim |
|
|
|
|
Nov 23 2009, 09:10 PM
Post
#104
|
|
|
Solar System Cartographer Group: Members Posts: 10153 Joined: 5-April 05 From: Canada Member No.: 227 |
It's interesting to speculate as to how a mistake like this gets into a raster DEM created from point data - the actual timing measurements along ground tracks. A bad data point in the raw data should be broadened or smoothed in the 'gridded' version, if it's not filtered out beforehand. But I'm not sure how good data lead to a bad spot in a raster DEM.
Phil -------------------- ... because the Solar System ain't gonna map itself.
Also to be found posting similar content on https://mastodon.social/@PhilStooke Maps for download (free PD: https://upload.wikimedia.org/wikipedia/comm...Cartography.pdf NOTE: everything created by me which I post on UMSF is considered to be in the public domain (NOT CC, public domain) |
|
|
|
|
Nov 23 2009, 11:23 PM
Post
#105
|
|
|
Newbie Group: Members Posts: 14 Joined: 9-November 09 Member No.: 5032 |
QUOTE (Phil Stooke @ Nov 23 2009, 02:10 PM) It's interesting to speculate as to how a mistake like this gets into a raster DEM created from point data - the actual timing measurements along ground tracks. A bad data point in the raw data should be broadened or smoothed in the 'gridded' version, if it's not filtered out beforehand. But I'm not sure how good data lead to a bad spot in a raster DEM. Phil Yes Phil, I was wondering how that happened as well. You would expect that a grid interpolation from irregularly spaced points in a triangulation would lead to a general smoothing of the surface model, not the creation of spikes. Various types of interpolation could have been employed, but you would not expect to generate such extreme peaks spanning several grid points. When you compare the timing data points to the DEM points, there is no surface trend visible that could yield that peak. When I triangulated the timing data points, I recall seeing local slope values of about 20 degrees, but nothing resembling the peak in the DEM. (I'll make a map when I get home tonight) From the Kaguya DEM, I created a slope map which I consider to be a good filter for detecting spurious peaks or pits. In a previous post, I gave a listing of places with large slope values. When I have time later this week (with a belly full of turkey) I will re-examine these points to see whether they appear to be data artifacts or extreme but valid lunar topography. I'm certainly no lunar expert, but I would expect that steep slopes on the Moon to be rare because of the 4 billion year rain of impacts and lack of plate tectonics. As a boy, I remember how smooth the mountains visited by the Apollo astronauts appeared to be. I wonder what is the plausible maximum slope (over a sizable distance) to be expected on the Moon. What would also be helpful would be to know the mean error in elevation measurements for Kaguya timing data. I don't doubt that measured range distances from the Kaguya laser altimeter are very accurate, but reducing that measurement to an elevation value requires an accurate satellite position in orbit and the Moon's gravitational field is lumpy. I'm more familiar with lidar technology for terrestrial applications, but lidar has the advantage of reducing points with an accurate flight path determination from onboard GPS receivers. Unless I'm mistaken, the Moon has nothing like the GPS constellation and no geodetic control, save the retro-reflectors left by the Apollo missions. - Michael |
|
|
|
|

|
Lo-Fi Version | Time is now: 27th April 2024 - 11:02 AM |
|
RULES AND GUIDELINES Please read the Forum Rules and Guidelines before posting. IMAGE COPYRIGHT |
OPINIONS AND MODERATION Opinions expressed on UnmannedSpaceflight.com are those of the individual posters and do not necessarily reflect the opinions of UnmannedSpaceflight.com or The Planetary Society. The all-volunteer UnmannedSpaceflight.com moderation team is wholly independent of The Planetary Society. The Planetary Society has no influence over decisions made by the UnmannedSpaceflight.com moderators. |
SUPPORT THE FORUM Unmannedspaceflight.com is funded by the Planetary Society. Please consider supporting our work and many other projects by donating to the Society or becoming a member. |
|