Dawn approaches Ceres, From opnav images to first orbit |

  |
Dawn approaches Ceres, From opnav images to first orbit |
 Mar 5 2015, 08:53 PM Mar 5 2015, 08:53 PM
Post
#661
|
|
 Member  Group: Members Posts: 714 Joined: 3-January 08 Member No.: 3995 |
QUOTE (elakdawalla @ Mar 5 2015, 10:23 AM)  This assumes that Ceres started out a sphere with the same spin rate it has now, or that it spun up for some reason. But there's no reason to assume either of those things. I was going with the assumption that the oblateness was due to the differentiation of water within Ceres. Otherwise, the hypothesis of a subsurface ocean or icy mantle would seem unwarranted. The other evidence of water ice -- low density and mineralogy possibly related to water -- could be explained by an undifferentiated rock/ice mixture. I thought the relatively high rotation rate of Ceres would have caused the less viscous envelope to flex out more and more as it grew in mass. I figured the rotation rate could have varied due to this (perhaps even slowed a bit), but wasn't a primary driver of any form change. Again, I'm sure I'm missing a detail or ten here, but then that's related to why Dawn was sent to Ceres in the first place.  (Edit: rock/ice mixture, not water/ice mixture) |
 |
 
|
|
Mar 5 2015, 10:58 PM
Post
#662
|
|
|
Member Group: Members Posts: 153 Joined: 20-December 14 From: Eastbourne, UK Member No.: 7372 |
There may not be major planetary tidal forces at play here, but small tidal effects from the Sun and possibly from Jupiter are surely present. If, as suspected, a global ocean of many kilometres depth was present, the different results of tidal forces acting on rock, liquid and icy mantle and the resulting friction has one would think affected spin rates in the past. The progressive freezing of the ocean from the poles down and the resulting changes in mass distribution, could have shifted the axis of rotation. Large resurfacing events would have changed the phase of considerable volumes of material also creating an unbalancing effect. It may be the stretching/contraction events happened only during a certain period of Ceres's evolution, most probably when the icy mantle was a lot thinner, and much of the evidence is hidden by later geology and the cumulative effects of the slow sublimation of volatiles from the surface layers. Another possibility is gas evolved from the contracting rocky core and ocean are trapped beneath the ice creating pressure that deforms the surface and maybe eventually cracks the ice layer.
Lots of guesses and assumptions, but 4.5 Billion years is an awful long time for a body with Ceres's apparently multiphase composition to go through a variety of physical and geological changes as the ratios of the phases slowly change. Just a few ideas to cogitate upon while we wait for more pictures. |
|
|
|
|
Mar 6 2015, 12:54 AM
Post
#663
|
|
|
Junior Member Group: Members Posts: 78 Joined: 16-October 12 From: Pennsylvania Member No.: 6711 |
I'm sure that one of the key questions for Dawn is does Ceres have an ocean or did it have one in the past? If either is true, it would generate a lot of interest.
QUOTE (Habukaz @ Mar 5 2015, 09:53 AM) The currently available key dates (more or less) from now until December this year: 6 March: Dawn's orbital capture by Ceres (61,000 km) 10 April: OpNav 6 (21,000 km, 306 pixels) 14 April: OpNav 7 (14,000 km, 453 pixels) 23 April: Dawn reaches RC3 orbit (13,500 km) May: Dawn reaches survey orbit (4,400 km) July: Dawn reaches high-altitude mapping orbit, HAMO (1,470 km) December: Dawn reaches low-altitude mapping orbit, LAMO (375 km) (from here and the usual table) So Dawn's mapping orbit starts the same month that New Horizon's Pluto flyby occurs. What a coincidence! |
|
|
|
|
Mar 6 2015, 01:33 AM
Post
#664
|
|
|
Senior Member Group: Members Posts: 2346 Joined: 7-December 12 Member No.: 6780 |
QUOTE (Phil Stooke @ Mar 4 2015, 02:00 AM) Nice demonstration of the fact that my explanation can't be correct! Phil Adjusted light curve maps to DLR map of RC2, of this MPS article, still based on the 27 frames of pia18920.gif:  I've assumed a sphere projected to a circle with Assumed rotation 9.85 degrees per pia18920.gif frame. Hence, Phil, your first explanation looks rather correct. Sorry for needing that long to clarify this. This doesn't necessarily mean, that the assumptions are the best possible; it's just the inferred assumptions underlying pia18920.gif, and the map by RC2 on the MPS site. You'll note the pretty good match of the animated light curve maps with the MPS RC2 map. |
|
|
|
|
Mar 6 2015, 03:22 PM
Post
#665
|
|
 Member Group: Members Posts: 423 Joined: 13-November 14 From: Norway Member No.: 7310 |
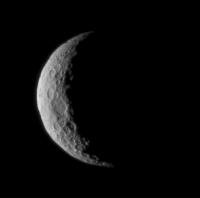
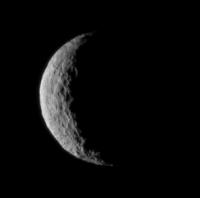
With the confirmation of Dawn's capture into orbit around Ceres, a couple of OpNav 5 frames were released: http://photojournal.jpl.nasa.gov/keywords/dp
They are somewhat fuzzy around the sunlit edge, I guess that is an artefact...? -------------------- |
|
|
|
|
Mar 6 2015, 04:31 PM
Post
#666
|
|
 Administrator Group: Admin Posts: 5172 Joined: 4-August 05 From: Pasadena, CA, USA, Earth Member No.: 454 |
Since Dawn's now in orbit, I made a new thread. Keep discussion of images taken through the Op Nav 5 crescents in here; move on to the next thread for the first orbit and RC3.
-------------------- My website - My Patreon - @elakdawalla on Twitter - Please support unmannedspaceflight.com by donating here.
|
|
|
|
|
Mar 6 2015, 05:17 PM
Post
#667
|
||
|
Member Group: Members Posts: 112 Joined: 31-January 15 From: Houston, TX USA Member No.: 7390 |
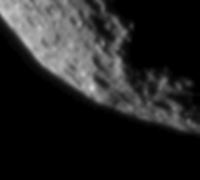
This is a non-enhanced zoom (800%) of the bright spot near the terminator in the second newly released image (PIA19312). Sure seems like this is at the top of local elevation to me. Very bright compared to the surroundings. I wonder if this bright spot is also saturating the detector?
Andy |
|
|
|
|
|
|
Mar 6 2015, 07:16 PM
Post
#668
|
||
|
Senior Member Group: Members Posts: 2346 Joined: 7-December 12 Member No.: 6780 |
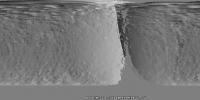
A first attempt to retrieve slope data in longitude direction from pia18920.gif (using light curve maps posted above), certainly crowded with processing artifacts, mainly due to inaccurate registering:
Since the maximum brightness is mostly in the first two usable light curve frames, I've used the deltas to infere the phase shift, interpreted as raw slope information. |
|
|
|
|
|
|
Mar 6 2015, 08:36 PM
Post
#669
|
||
 Member Group: Members Posts: 656 Joined: 20-April 05 From: League City, Texas Member No.: 285 |
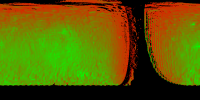
QUOTE (Gerald @ Mar 6 2015, 01:16 PM) A first attempt to retrieve slope data in longitude direction .... My initial take on the light curves was that they provided an indication of surface roughness, which is what I aimed to extract by looking at the slopes of the light curves. After further thought, if the peak of the curve differs from the midpoint, I can see whereas this would provide an indication of E-W slope. Is E-W slope what you mean by slope in the longitude direction? The only way I can envisage to get a sense of slope in the N-S direction is to assume common global albedo, and infer slope from the maximum intensity of each pixel (effectively, shape from shading). EDIT: I've taken a closer look at the light curves. I had presumed that they would be roughly bell-shaped, peaking at the center. I see that they are actually linear, generally declining from a peak with increasing frame number (some wrap around back through early frames). From this, I gather that they are absolute values centered on the peak. Not what I'd expected, but I can kind of see where they came from. Anyway, based upon my revised perspective, I have revised/expanded my plot of light curve slopes to take fuller advantage of the data. As I interpret this, greener is smoother, redder is rougher.
|
|
|
|
|
|
|
Mar 6 2015, 08:49 PM
Post
#670
|
|
|
Member Group: Members Posts: 423 Joined: 13-November 14 From: Norway Member No.: 7310 |
QUOTE (algorimancer @ Mar 5 2015, 07:26 PM) I'm assuming this refers to the two prominent depressions visible south and east of the bright spot, as in the lower portion of this image: It seems like this region was omitted from both the most recent image/movie releases. Would any of Dawn the team members care to comment on whether this was intentional? Perhaps something they'd like to interpret and publish/publicize prior to a more general release? That's not an unreasonable prerogative, I'd just like to clarify where we stand. Those are the ones, yes. I doubt that the RC2 images not included reveal terribly much about the one to the east; they've published some of the best views of the one to the west, and it's still a mystery. I'd guess it's fairly random that some of the images have not been published yet. Looking more closely at the feature to the west, I noticed more details that others might have noticed too (probably don't show on monitors with poor contrast):    yet more linear/curved features. They look like lower terrain (like e.g. valleys): you can see how they fill up with shadows as the sun sets, and their shapes are almost completely unchanged from one frame to the next (!), supporting the idea that they are real topographic features. They appear to go almost all the way in to the brighter centre (central peak?) of the feature. -------------------- |
|
|
|
|
Mar 6 2015, 10:21 PM
Post
#671
|
|
|
Member Group: Members Posts: 656 Joined: 20-April 05 From: League City, Texas Member No.: 285 |
QUOTE (Habukaz @ Mar 6 2015, 02:49 PM) ...yet more linear/curved features... The term "scalloping" comes to mind. Perhaps a product of differential sublimation associated with topographically controlled illumination? Seems like we've seen something similar at one or more Saturnian satellites. |
|
|
|
|
Mar 6 2015, 11:15 PM
Post
#672
|
|
|
Member Group: Members Posts: 423 Joined: 13-November 14 From: Norway Member No.: 7310 |
Not sure which Saturnian moons and which features are being referred to.
While looking some more at those cropped images, I noticed what looks like a shadow east of the central area of the 'crater': a small area that is darker grey in the first frame and considerably darker in the second. In the third, it appears to have grown in size. It is very small, but given how it seems to change in a similar way as one would expect a shadow to change as night nears, it's tempting to guess that it actually is a shadow and is caused by some sort of central peak.  As the 'crater' enters the nightside (picture above), it does indeed also look like the central portion remains lit for a longer period of time than the rest of the interior. -------------------- |
|
|
|
|
Mar 6 2015, 11:16 PM
Post
#673
|
|
|
Senior Member Group: Members Posts: 2346 Joined: 7-December 12 Member No.: 6780 |
QUOTE (algorimancer @ Mar 6 2015, 09:36 PM) Is E-W slope what you mean by slope in the longitude direction? Yes. QUOTE (algorimancer @ Mar 6 2015, 09:36 PM) The only way I can envisage to get a sense of slope in the N-S direction is to assume common global albedo, and infer slope from the maximum intensity of each pixel (effectively, shape from shading). I like those challenges, which look insoluble at first glance. |
|
|
|
|
Mar 6 2015, 11:39 PM
Post
#674
|
|||
|
Member Group: Members Posts: 714 Joined: 3-January 08 Member No.: 3995 |
Recent images at 200%:
PIA19311:
PIA19312:
To prevent altering the pixels during the size increase, I magnified each TIF image in an image editor (instead of increasing the image size), did a screen capture, and then saved it as a separate JPG file at maximum quality. |
||
|
|
|
||
|
Mar 8 2015, 01:04 AM
Post
#675
|
|
|
Member Group: Members Posts: 153 Joined: 20-December 14 From: Eastbourne, UK Member No.: 7372 |
One thing these crescent views show is how flat bottomed the craters are outside the polar regions, as well as how smooth some areas are in the equatorial region. The steeper elevation changes towards the South Pole seem to "sparkle". Certain phase angles seem to pick out a more reflective component in the surface composition. Is this due to the grain size of the regolith, its chemical composition, or even water ice just below the surface? The reflectance spectra will hopefully give us the answer.
|
|
|
|
|

|
Lo-Fi Version | Time is now: 19th April 2024 - 05:48 PM |
|
RULES AND GUIDELINES Please read the Forum Rules and Guidelines before posting. IMAGE COPYRIGHT |
OPINIONS AND MODERATION Opinions expressed on UnmannedSpaceflight.com are those of the individual posters and do not necessarily reflect the opinions of UnmannedSpaceflight.com or The Planetary Society. The all-volunteer UnmannedSpaceflight.com moderation team is wholly independent of The Planetary Society. The Planetary Society has no influence over decisions made by the UnmannedSpaceflight.com moderators. |
SUPPORT THE FORUM Unmannedspaceflight.com is funded by the Planetary Society. Please consider supporting our work and many other projects by donating to the Society or becoming a member. |
|