Okay, It's June 15. Where's the updated LOLA data? I keep finding the stuff from March in all the usual places. Okay, I'm sure it may take a few days, but does anyone have a clue if the LDEMs are going to get cleaner and crisper this time around?
I've already seen a resin casting of a moon globe made from the LDEM_64 data, but I wanted to wait a bit until more blanks were filled in.
Rick
Full Version: It's June - Better LOLA?
I will wait until the last data point is incorporated, what a great map that shall be!
hay the gdr link finally works and is not gray.
ftp://pds-geosciences.wustl.edu/lro/lro-l.../data/lola_gdr/
but still the old data 3-15-2010
now the rdr is updated 6-1-2010
ftp://pds-geosciences.wustl.edu/lro/lro-l..._rdr/lro_no_01/
ftp://pds-geosciences.wustl.edu/lro/lro-l.../data/lola_gdr/
but still the old data 3-15-2010
now the rdr is updated 6-1-2010
ftp://pds-geosciences.wustl.edu/lro/lro-l..._rdr/lro_no_01/
QUOTE (Phil Stooke @ Jun 15 2010, 06:48 PM) 
Well, if it doesn't have .img or .jp2 stuck to it, I can't use it.
 It would be lovely to have, oh, a file with a name like LDEM_128.img . I am in no way smart enough to use anything else that I have been seeing with a June date on it. Yeah, I've checked with the PDS and Imbrium pages, and I'll wait until the image files "get good." Been spoiled by MOLA.
Rick
QUOTE
Been spoiled by MOLA
well this is still a very,very early release
mola took a bit of time
Just to save everybody a little time: the LDEM_64.IMG on that page is byte-for-byte identical to the one released in March, despite the new file modified time.
I see only the March release
here
ftp://pds-geosciences.wustl.edu/lro/lro-l.../data/lola_gdr/
and here
http://imbrium.mit.edu/DATA/LOLA_GDR/
Where you found the update?
Ciao
VB
here
ftp://pds-geosciences.wustl.edu/lro/lro-l.../data/lola_gdr/
and here
http://imbrium.mit.edu/DATA/LOLA_GDR/
Where you found the update?
Ciao
VB
Right... some of the data releases are delayed a bit, and maybe place-holder files are online while preparations continue. These are very large and complex datasets, and PDS documentation is time-consuming.
On another note - LRO has been in orbit for a year. In a few months the orbit is due to be raised as LRO enters its extended mission phase under the Science Mission Directorate.
Phil
On another note - LRO has been in orbit for a year. In a few months the orbit is due to be raised as LRO enters its extended mission phase under the Science Mission Directorate.
Phil
I'm having a go at gridding the LOLA RDR data myself. It's going to take me several days to download all the data, though.
QUOTE (mhoward @ Jun 23 2010, 03:37 PM)
I'm having a go at gridding the LOLA RDR data myself. It's going to take me several days to download all the data, though.
I have been using the RDR data (not the DEMs) for lunar illumination work. You have to be careful to use the right filters.
In RDRSIS.pdf it shows the shot flags for each shot.
http://imbrium.mit.edu/DOCUMENT/RDRSIS.pdf
http://imbrium.mit.edu/LABEL/LOLARDR.FMT
Use the ones with 0 as the least significant bit. It is interesting to understand the criteria for eliminating points. There are so many shots, that it is impossible to manually filter them all. The main automated filter they include is to compare the 5 shots against each other (not against other nearby shot sets). I think the slope limit is 37 deg between shots. This does a good job on most shots.
I have looked around both poles and found some that were erroenous comared against existing LOLA data from other passes (no shots have yet been manually editted/flagged in the RDR datasets so far). If you are interested in them, I can give you a list. It isn't that big and would likely not show up if you are using a tool like GMT to process the points into a DEM (unless you are shooting for high resolution) due to the averaging and surface fitting that tool uses.
An announcement from the PDS -- I don't know if this affects any of the work that you all are doing --
QUOTE
[NASA PDS] LRO LOLA INTERIM RELEASE ANNOUNCEMENT
To users of Lunar Orbiter Laser Altimeter (LOLA) data from the Lunar
Reconnaissance Orbiter (LRO) Mission:
The LOLA Team discovered and corrected a processing error that affected
time tags in RDR data products from day 2010-02-15 onwards. The Team
also corrected minor errors in EDR and RDR data product labels. This
interim release consists of revised versions of all previously released
RDR products and their PDS labels, and revised EDR labels only
(not data files).
The revised data are available from the LOLA Data Node via the Lunar
Orbital Data Explorer:
http://ode.rsl.wustl.edu/moon/
and from the PDS Geosciences Node:
http://pds-geosciences.wustl.edu
A revised product can be identified by the keyword
PRODUCT_VERSION_ID = "V1.03" in its label.
QUOTE (elakdawalla @ Aug 2 2010, 05:13 PM)
An announcement from the PDS -- I don't know if this affects any of the work that you all are doing --
Yes, this will affect my work. Thanks.
I am baffled also by the lack of data density. I am waiting for LROC stereo imagery inferred heights correlated with the LOLA data. The problem is that LOLA, even at the poles, has <.3% of the surface area "painted" by LOLA light. Interpolations of height seem somewhat unreliable based on that. Normally, one could generate nice looking 3D models without worrying about this, but doing illumination analysis and being impacted by unknown nearby terrain or planning mobility paths can't be done with LOLA alone.
QUOTE
I am baffled also by the lack of data density.
it is still early
the mars mola took a bit of time
the LOLA will also
QUOTE
An announcement from the PDS -- I don't know if this affects any of the work that you all are doing --
don't know yet
the last update was to fix the errors in the .lbl files we have been finding
" corrected minor errors in EDR and RDR data product labels "
those errors
the "time tags" ??? don't know but the derived image dost match up with Kaguya
will have to look
but people might want to read the errata.txt
http://pds-geosciences.wustl.edu/lro/lro-l...1xxx/errata.txt
the relevant part
CODE
RELEASE NUMBER: n/a
RELEASE DATE: 2010-07-20
DATA COVERAGE: 2009-06-18 to 2010-03-22 (entire mission through 2010-03-22)
PRODUCT TYPES RELEASED FOR THIS ARCHIVE: No new products
PRODUCT TYPES UPDATED FOR THIS ARCHIVE: EDR, RDR
REASON FOR UPDATES: Data processing correction
The LOLA Team discovered and corrected a processing error that affected time
tags in RDR data products from day 2010-02-15 onwards. The Team also
corrected minor errors in EDR and RDR data product labels. This intermediate
release consists of revised versions of all previously released RDR products
and their PDS labels, and revised EDR labels only (not data files). A revised
product can be identified by the keyword PRODUCT_VERSION_ID = "V1.03" in its
label.
The following data files and corresponding labels, which were previously
included, have been excluded for this and future releases due to poor data
quality.
DATA/LOLA_EDR/LRO_CO/LOLAEDR091931559.DAT
DATA/LOLA_EDR/LRO_CO/LOLAEDR091931559.LBL
DATA/LOLA_EDR/LRO_CO/LOLAEDR091931759.DAT
DATA/LOLA_EDR/LRO_CO/LOLAEDR091931759.LBL
DATA/LOLA_RDR/LRO_CO/LOLARDR091931559.DAT
DATA/LOLA_RDR/LRO_CO/LOLARDR091931559.LBL
DATA/LOLA_RDR/LRO_CO/LOLARDR091931759.DAT
DATA/LOLA_RDR/LRO_CO/LOLARDR091931759.LBL
Gridded Data Record (GDR) and Spherical Harmonics Analysis Data Record
(SHADR) products have not been revised since Release 2.
Humph. Still some major problems with this imho - the ends still don't match when you wrap it around or cut'n'paste in photoshop to drop the meridian in the middle.
djellison seeing that is also true for most of the maps on pds and from nasa , that is nothing new
and are you referring to the gdr from march
http://pds-geosciences.wustl.edu/lro/lro-l.../data/lola_gdr/
and are you referring to the gdr from march
http://pds-geosciences.wustl.edu/lro/lro-l.../data/lola_gdr/
QUOTE (elakdawalla @ Aug 2 2010, 09:13 AM)
An announcement from the PDS -- I don't know if this affects any of the work that you all are doing --
Thanks for the heads up. I'd identified long ranges of the data that clearly did not match their neighboring areas; it will be interesting to see if they are corrected now. (Of course, it sounds like that will require re-downloading all the RDR data again, which will probably take me over a week. Also I'm running low on hard drive space
 )
)
QUOTE (JohnVV @ Aug 2 2010, 06:23 PM)
djellison seeing that is also true for most of the maps on pds and from nasa
The recent swath of Cassini maps doesn't have this problem, nor the MOLA GDR's in my experience.
But yes - I'm talking about the LOLA GDR's
Interesting - unless I'm doing something wrong, it looks like the RDR data has been extensively corrected. This is good! I should have a better estimation of the improvement in a few days.
It takes time to get it all fixed up... but people, if you want to see how unbelievable LOLA is going to be when it's all done, check out this amazing presentation from the NASA Lunar Science Forum, held at NASA Ames last month. This is by Maria Zuber, and - alas - it didn't survive the PDF-making process properly. I have asked if it can be fixed. But even so, it looks good. Check out the LOLA map of the floor of Shackleton on page 15. As I say I've asked for it to be fixed, so we'll see.
http://lunarscience2010.arc.nasa.gov/sites...files/Zuber.pdf
Other pressies here:
http://lunarscience2010.arc.nasa.gov/agenda
Lots of goodies.
Phil
http://lunarscience2010.arc.nasa.gov/sites...files/Zuber.pdf
Other pressies here:
http://lunarscience2010.arc.nasa.gov/agenda
Lots of goodies.
Phil
QUOTE
Hmmm, impressive! Lots of interesting looking mounds on the crater floor. More of that fluffy volatile rich material that LCROSS dived into?
Some of the other papers are very interesting too. Recommended!
P
"It takes time to get it all fixed up... but people, if you want to see how unbelievable LOLA is going to be when it's all done, check out this amazing presentation from the NASA Lunar Science Forum, held at NASA Ames last month. This is by Maria Zuber, and - alas - it didn't survive the PDF-making process properly. I have asked if it can be fixed. But even so, it looks good. Check out the LOLA map of the floor of Shackleton on page 15. "
Yes, it looks good, and is much better than what we have had and they are doing great work.
But there are some points that should be emphasized (and I do not think they are sufficiently)........
For a 25 m/pixel grid for within 25 km of the South Pole,
(1) Only 72% of the grid elements have at least one laser data point. This means 28% are empty, but the DEMs show them filled (interpolated). This is a concern to me because although it creates a nice continuous image/DEM, it needs an accompanying error map to help a user to understand the missing data, interpolation error, etc.
(2) The average number of laser data points in this grid is 1.5 +- 1.4. For a 25m by 25 m pixel, you would like around 25 laser data points to get good coverage with 5 m diameter spots. This means when the DEM is constructed, the height for that pixel is supposed to be an average height of the surface, but really it is the height average of from 0% to 12% of the surface area within the pixel.
(3) How does the laser data point treats the area it "paints"? Is this the average height within the 5 m spot or the highest spot or what?
With coarser grids (240 m by 240 m/pixel), the percentage of surface area with laser data spots is around 8%.
Thus the magic of creating the DEM (i.e. sausage making) has alot of aspects that people need to realize and see if it applies to their usage. I have been stymied from doing illumination analysis because of these concerns. Sure I can do it and have done it with my analysis tools and use either the DEMs or the actual laser points, but I cannot create an error bar, so I have to reassess this laser data DEM.
QUOTE (James Fincannon @ Aug 14 2010, 12:51 PM)
Thus the magic of creating the DEM (i.e. sausage making) has alot of aspects that people need to realize and see if it applies to their usage. I have been stymied from doing illumination analysis because of these concerns. Sure I can do it and have done it with my analysis tools and use either the DEMs or the actual laser points, but I cannot create an error bar, so I have to reassess this laser data DEM.
James,
we discussed that offline, but I do not agree that we need to paint the whole Moon to have a realistic map at say 25m resolution. Indeed the current filling ratio of the 25x25m near the poles was 72% when we discussed that in June, but it will keep on improving.
The September release in a couple of weeks will have side products for each of the DEMs containing the counts of laser shots in each pixel. People can use that as a mask to see where you can be more or less confident in the measurement averaging (actually a median).
But I am not sure that is what will capture the interest of most people here. And having "gaps" in the DEMs to reflect the actual sampling would not necessarily make it better; I would expect most people want a full map, and do not want to do their own interpolation (they may not be familiar with the tools to do so) when they want to render a given region.
To reassure you, the data is not put through magic black boxes, and the workflow is actually pretty straightforward. It just gets messy to deal with when you have billions of points and those high resolutions.
QUOTE (James Fincannon @ Aug 14 2010, 12:51 PM)
With coarser grids (240 m by 240 m/pixel), the percentage of surface area with laser data spots is around 8%.
Do you mean globally? In June, polewards of ~85deg, we had ~90% coverage at that resolution.
All,
The September release is coming very soon, and the DEMs will be updated this time, with more than 2 billion (good) points which went into them.
I updated the Celestia products, and they are already available here: http://imbrium.mit.edu/EXTRAS/CELESTIA/
They were made from the to-be-released 128ppd grid. Annoying seams should be gone (note to djellison and John). We are also releasing a 256ppd map (in four tiles), but I do not have the time currently to do it from that source (that would bring us to level6). And currently, it might be overkill. Others are welcome to try it out!
As for the new polar maps you saw in Maria Zuber's Ames presentation, this is not exactly what is going to be released. I'm not going into details here, but basically, the PDS release will still show some (reduced compared to before) orbit streaks near the poles. I will try to provide a better image of the South Pole, as it seems to be of interest here

Erwan
as has been stated before these things take time
at least it is not1960 to 1980's and the only way, outside a big university , was on a tape drive and in published print
at least it is not1960 to 1980's and the only way, outside a big university , was on a tape drive and in published print
"I do not agree that we need to paint the whole Moon to have a realistic map at say 25m resolution."
What is the meaning of the word "realistic"? It may be realistic for people who want to render topographic surfaces for illustrative purposes or animations or simulations that do not require interacting with the surface. But I think one would not consider it realistic if one is planning a rover path or doing certain types of illumination analysis.
I think you and your team are doing great work, but I think some accuracy/realism aspects go over most users heads and are ignored.
"Indeed the current filling ratio of the 25x25m near the poles was 72% when we discussed that in June, but it will keep on improving."
This is the number I quoted before and is what bothered me because the DEMs show continuous surfaces where they cannot really be definitive as such (other than interpolation). Yes, given enough time you should get "100%" (meaning, to other readers, at least one 5 m diameter laser spot within all of the polar 25m by 25 m areal elements). But I have a little trouble with the rationale of interpolating an entire pixel height based on maybe <4% of the area being painted by laser light (i.e. one laser spot for a surface that needs 25 laser spots to fully define). Maybe the LOLA data is meant just for a certain purpose and I am trying to use it for a purpose that was not intended and I should really use the stereo imagery derived terrain instead.
>The September release in a couple of weeks will have side products for each of the DEMs containing the counts
>of laser shots in each pixel. People can use that as a mask to see where you can be more or less confident in the
>measurement averaging (actually a median).
This will be helpful.
>And having "gaps" in the DEMs to reflect the actual sampling would not necessarily make it better; I would
>expect most people want a full map, and do not want to do their own interpolation (they may not be familiar
>with the tools to do so) when they want to render a given region.
Gaps would be no good in the DEM, but what I think some users would like is the number of shots per pixel (0 shots would tell them it is pure interpolation). It would also be nice to have an error estimate for each pixel (maybe based on the difference between the interpolation pixel height and the average of the heights of the laser spots within the pixel).
>To reassure you, the data is not put through magic black boxes, and the workflow is actually pretty straightforward.
Interpolation is kind of magical in that it is hard to intuitively know how the interpolation will work out all the time for every set of points. You are not simply drawing a straight line between points, it is much more complex.
>>With coarser grids (240 m by 240 m/pixel), the percentage of surface area with laser data spots is around 8%.
>Do you mean globally? In June, polewards of ~85deg, we had ~90% coverage at that resolution.
By this I mean, for a 240m by 240 m DEM, I created a grid of 5 m non-overlapping spots to fill it which gives you 48 by 48/ 5 m spots or 2304 laser spots needed to cover the whole pixel. Then using your average number of laser spots/pixel within 25 km of the south pole (136+-63), I get a maximum of 8.6% and an average of 6% of the area painted by laser light. Sure, the number of 240m by 240m pixels that have at least 1 laser spot is ~100% in the case, but what I am saying is the kind of interpolated height based on 6-8% of the surface area needs some sort of error bar associated with it, since it is very hard for any of us to figure it out just from the raw data.
>The September release is coming very soon, and the DEMs will be updated this time, with more than 2 billion (good) points which went into them.
This is great! Still, globally, this means you are covering ~.1% of the lunar surface with laser light. So will LRO be merging the stereo imaging with LOLA data for significant regions? Are you working with those guys?
QUOTE (zeBeamer @ Sep 1 2010, 03:57 PM)
All,
The September release is coming very soon, and the DEMs will be updated this time, with more than 2 billion (good) points which went into them.
I updated the Celestia products, and they are already available here: http://imbrium.mit.edu/EXTRAS/CELESTIA/
They were made from the to-be-released 128ppd grid. Annoying seams should be gone (note to djellison and John). We are also releasing a 256ppd map (in four tiles), but I do not have the time currently to do it from that source (that would bring us to level6). And currently, it might be overkill. Others are welcome to try it out!
Erwan
Quick noob question; what's the difference between an LDEM file and a CDEM file? Just noticed all the new file names added.
Rick
QUOTE (Rick Sternbach @ Sep 2 2010, 11:42 AM)
Quick noob question; what's the difference between an LDEM file and a CDEM file? Just noticed all the new file names added.
CDEM contains the counts. LDEM contains the altitude (discretized in half-meter levels).
Erwan
Here is one image of the South Pole region as shown by Maria Zuber in the Ames meeting about a month ago. Click for higher resolution.

It's a 25-m DEM constructed from ~4000 profiles. The axis labels are in kilometers (stereographic projection around 0,-90).
Still a few blemishes, but impressive enough I hope
Erwan

It's a 25-m DEM constructed from ~4000 profiles. The axis labels are in kilometers (stereographic projection around 0,-90).
Still a few blemishes, but impressive enough I hope
Erwan
QUOTE (zeBeamer @ Sep 2 2010, 12:56 PM)
CDEM contains the counts. LDEM contains the altitude (discretized in half-meter levels).
Erwan
Erwan
Oh, and I just noticed a lot of file names *missing*, like all the JPG2000 files. With my limited Mac software here, those were the only files I could get to look at and use in Terragen. I can get a file like LDEM_64.img to open in MacDEM as I did with the MOLA files, but now MacDEM can't figure out the height range (I think). Image comes out where I can see the terrain with directional lighting turned on, but the shades are all super contrasty and black-white splotchy. Probably time to get a new machine and better terrain software.

Thanks Erwan - lovely map. I was sorry to se that Maria's presentation file archived at NLSF 2010 was messed up so we couldn't see the images properly, but this takes care of that one!
Phil
Phil
just took a look at
http://imbrium.mit.edu/DATA/LOLA_GDR/
the img's have a sep3 date
PS. for the count files( CDEM_ ) pds2isis tosses en error about the " SAMPLE_BITS = 2" - isis wants 8 ,16 ,or 32
small edit in the LBL solves this
as per Rick Sternbach question there is a MAC isis3
and for just using pds2isis then > isis2raw most of the data dose not need to be installed just the BASE system ( small install ) and some of the data files
but you can remove the very large maps if space is an issue /isis_3/data/base/dems ~4.8 gig
http://imbrium.mit.edu/DATA/LOLA_GDR/
the img's have a sep3 date
PS. for the count files( CDEM_ ) pds2isis tosses en error about the " SAMPLE_BITS = 2" - isis wants 8 ,16 ,or 32
small edit in the LBL solves this
as per Rick Sternbach question there is a MAC isis3
and for just using pds2isis then > isis2raw most of the data dose not need to be installed just the BASE system ( small install ) and some of the data files
CODE
rsync -azv --delete isisdist.wr.usgs.gov::x86_darwin_OSX105/isis .
rsync -azv --delete isisdist.wr.usgs.gov::isis3data/data/base data/
rsync -azv --delete isisdist.wr.usgs.gov::isis3data/data/base data/
but you can remove the very large maps if space is an issue /isis_3/data/base/dems ~4.8 gig
QUOTE (JohnVV @ Sep 9 2010, 05:32 PM)
as per Rick Sternbach question there is a MAC isis3
Thanks; I looked into ISIS some time ago. Way, way, way over my head. - R.
QUOTE (JohnVV @ Sep 10 2010, 02:32 AM)
Nice!
From the label LDEM_64.IMG is updated with observation up to June 27 and there is a new LDEM_128.IMG to play with
i just imported the 128 into Nip2 and did a simple "emboss " filter
two screenshots from nip
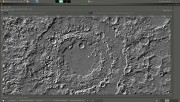
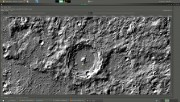
the second is zoomed in a bit
still need some work but better than the last set
give it a year and it will rival the MOLA
two screenshots from nip
the second is zoomed in a bit
still need some work but better than the last set
give it a year and it will rival the MOLA
Rick Sternbach and a few others i can post the 128 as a 2 gig raw image
500 meg north west,south west,north east , and south east
with 0 long and 0 lat in the center of the map ( -180 to 180)
--- rant ---
raw2isis has a bug, that i am about to report -- i would but the USGS is down for maintenance
16 bit unsigned ( my working format) gets saved as 32 bit REAL but the cubs say they are 16unsigned -- just a bit of an issue
and pds2isis is doing it too map2map is a MESS. telling isis it is 16 bit signed ( from the cube& img )when it is 32 bit float ( the data in the cube)
at least isis2raw IS WORKING the way it should
i have finally a 90north to 40 north ( polar), the same for the south pole and 45n to 45s ( simple cylindrical )
so i can clean them up a bit
QUOTE (JohnVV @ Sep 10 2010, 03:28 PM)
Rick Sternbach and a few others i can post the 128 as a 2 gig raw image
500 meg north west,south west,north east , and south east
with 0 long and 0 lat in the center of the map ( -180 to 180)
500 meg north west,south west,north east , and south east
with 0 long and 0 lat in the center of the map ( -180 to 180)
John - That's a generous offer; thanks. Even the individual 500MB tiles would be fine in my case, as I'd be exploring smaller areas in Terragen or TG2. Eventually for rapid prototyping a physical globe, I'd be getting with the smart folks who have the computing horsepower to work with the .img files and grow the resin parts, but right now I'm hoping to "look around" the surface in 3D. - Rick
QUOTE (Rick Sternbach @ Sep 11 2010, 11:14 AM)
I'm hoping to "look around" the surface in 3D.
I'd like to see what results you obtain with Terragen. Post some of your picture when you have them.
i will post links to them later on tonight ( i have to export them )
QUOTE (Rick Sternbach @ Sep 9 2010, 07:31 PM)
Oh, and I just noticed a lot of file names *missing*, like all the JPG2000 files. With my limited Mac software here, those were the only files I could get to look at and use in Terragen. I can get a file like LDEM_64.img to open in MacDEM as I did with the MOLA files, but now MacDEM can't figure out the height range (I think). Image comes out where I can see the terrain with directional lighting turned on, but the shades are all super contrasty and black-white splotchy. Probably time to get a new machine and better terrain software.
GeoJPEG2000 are forthcoming. We want to make sure they're correct, and we found some strange things happening with the programs used to make the conversion.
Anyway, release date has always been the 15th, if you can wait that long
As for the 128ppd being too large, we did not plan on splitting those up, but that could potentially be done in the next release, if enough people think it's worthwhile. The problem is that when we eventually release a 1024ppd, we don't want to break them up 256 tiles (each equivalent to a 64ppd global). 64 "128ppd" tiles will be quite enough already!
Erwan
As for the 128ppd being too large,
not for me but to upload a zip to a service like zshare , they need to be small
so there is a plan to release a 368640 x 184320 pixel image 68 megapixle map ( 1024 px per deg. )
not for me but to upload a zip to a service like zshare , they need to be small
so there is a plan to release a 368640 x 184320 pixel image 68 megapixle map ( 1024 px per deg. )
Looking forward to the new RDRs. Thanks.
QUOTE (zeBeamer @ Sep 11 2010, 06:03 PM)
GeoJPEG2000 are forthcoming. We want to make sure they're correct, and we found some strange things happening with the programs used to make the conversion.
Anyway, release date has always been the 15th, if you can wait that long
As for the 128ppd being too large, we did not plan on splitting those up, but that could potentially be done in the next release, if enough people think it's worthwhile. The problem is that when we eventually release a 1024ppd, we don't want to break them up 256 tiles (each equivalent to a 64ppd global). 64 "128ppd" tiles will be quite enough already!
Erwan
I see the new LDEM files with the "PPD" stuck in the middle, and I can open the 4, 16, and 64 JP2000 versions, but no way can I get the 128 to open in Photoshop, even with almost 1GB RAM devoted to the application and a healthy secondary HD. I get a message talking about trouble with a "file-interface module," which I have no idea how to fix. As before, I suspect I'd need a Mac Pro with 8GB of RAM to play in the bigger sandbox. Anyhow, I'm attaching a view of Copernicus from the 64 file, quick render in Terragen. - Rick
How are you guys processing the RDRs? I have found RDR2TAB and RDR2XYZ but they are for MAC only, has anyone found a win32 version? I have the fortran source code but no compiler.
Thanks for any help.
Thanks for any help.
QUOTE
How are you guys processing the RDRs? I have found RDR2TAB and RDR2XYZ
they take way to much work at this time
I use the GDR pds IMG files
http://imbrium.mit.edu/DATA/LOLA_GDR/
QUOTE (Mars3D @ Nov 25 2010, 02:26 PM)
How are you guys processing the RDRs?
I'm using custom software to do it - on Mac, so can't really help there. Yes, most people are using the GDRs.
Thanks for the replies.
I think I'll have a go at writing some code to process the rdrs. I have the code to do the gridding and bad data removal from the work I did with the MOLA data.
I think I'll have a go at writing some code to process the rdrs. I have the code to do the gridding and bad data removal from the work I did with the MOLA data.
QUOTE (Mars3D @ Nov 25 2010, 09:26 PM)
How are you guys processing the RDRs? I have found RDR2TAB and RDR2XYZ but they are for MAC only, has anyone found a win32 version? I have the fortran source code but no compiler.
Thanks for any help.
Thanks for any help.
Sorry, I do not know of a win32 version. I wrote my own FORTRAN RDR reader based on the description of the RDR file. Erwan M. described to me a lot of conversions needed to create a DEM. I skip those because I need to use the raw data points for my work. Also, I found I needed to examine segments carefully with a viewer to make sure no erroneous data points were included (they are not flagged yet, perhaps in future versions).
Anyone heard when the WAC LRO stereo DEM is going to be published?
QUOTE (Mars3D @ Nov 26 2010, 12:58 PM)
I think I'll have a go at writing some code to process the rdrs. I have the code to do the gridding and bad data removal from the work I did with the MOLA data.
Interesting. I've done the work and gotten results but haven't had time to release anything yet. At the moment I exclude bad LOLA data on a file-by-file basis. Fortunately they have cleaned up a lot of the data, just not quite all of it.
it should build in MinGW on windows but you would need to spend a week or two setting up MinGW ( unless you have done that a lot -- then a day or two )
However i have not done this for the rdr FORTRAN files , so it is a guess .
MinGW runs much faster than CygWin
However i have not done this for the rdr FORTRAN files , so it is a guess .
MinGW runs much faster than CygWin
I briefly tried MinGW but I was getting lots of compiler errors so I gave up. I have now written some c code to process the rdrs and it looks like its working ok. Now I just need to download all the rdrs which looks like its going to take a very long time.
This is a "lo-fi" version of our main content. To view the full version with more information, formatting and images, please click here.