MSL statistics, Odometry progress and other figures |

MSL statistics, Odometry progress and other figures |
 Sep 6 2012, 05:37 PM Sep 6 2012, 05:37 PM
Post
#1
|
||
 Senior Member  Group: Members Posts: 2492 Joined: 15-January 05 From: center Italy Member No.: 150 |
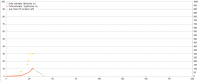
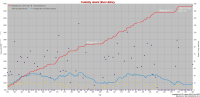
After first month on Mars, I think it's time to start a topic similar to MER one...
First odometry plot to start:
-------------------- I always think before posting! - Marco -
|
|
 |
 
|
|
 |
|
Oct 25 2013, 10:16 PM
Post
#2
|
|
 Member Group: Members Posts: 105 Joined: 13-July 05 From: The Hague, NL Member No.: 434 |
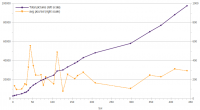
Since sol 402 the graph moves up in a straight line, about 30 m/sol. Can anybody comment on this average? Emily mentions in her blog that there is pressure to drive, drive, drive, but I also remember NASA's own Curiosity brochure that mentions "On average, Curiosity is expected to travel 200 m per driving day, depending on power levels, slippage, steepness of terrain, visibility.."
After more than 400 sols of building up experience with terrain, auto-nav etc. it may be possible to review this - on the face of it - 7-fold difference between "design" and "actual". Until then, every day I open the stats and the maps messages in UMSF I'm hoping to see this 200 m mark.. 
|
|
|
|
|
Oct 25 2013, 11:39 PM
Post
#3
|
|
|
Founder Group: Chairman Posts: 14434 Joined: 8-February 04 Member No.: 1 |
QUOTE (Harder @ Oct 25 2013, 02:16 PM)  Since sol 402 the graph moves up in a straight line, about 30 m/sol. Can anybody comment on this average? Look more closely at that graph - there are many days in that graph that are not drive days. The last 10 drives have averaged more than 70 meters each. ( thank you http://curiositylog.com/ ) QUOTE I also remember NASA's own Curiosity brochure that mentions "On average, Curiosity is expected to travel 200 m per driving day, depending on power levels, slippage, steepness of terrain, visibility.." That brochure should be considered...a brochure. It's not an engineering analysis, it's not a peer reviewed paper in an engineering journal - it's just...a shiny brochure. 200M represents a round number near the upper limit of what Curiosity may eventually reach given full deployment of Autonav, smoother terrain with better visibility etc etc. We may not see 200M in a sol - but in a perfect scenario we might. |
|
|
|
|
Nov 1 2013, 06:36 AM
Post
#4
|
||||
|
Senior Member Group: Members Posts: 2492 Joined: 15-January 05 From: center Italy Member No.: 150 |
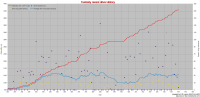
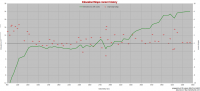
New medium-term Odometry/Elevation plots (last 4 months):
(last update: Nov,02 - Sol 440) Note: added also integral picture statistics -------------------- I always think before posting! - Marco -
|
|||
|
|
|
|||
|
Nov 27 2013, 11:16 AM
Post
#5
|
|||
|
Senior Member Group: Members Posts: 2492 Joined: 15-January 05 From: center Italy Member No.: 150 |
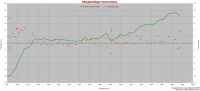
New medium-term Odometry/Elevation plots, with annotated stops:
(last update: Nov,26 - Sol 465) -------------------- I always think before posting! - Marco -
|
||
|
|
|
||
 dilo MSL statistics Sep 6 2012, 05:37 PM
 climber Thank you dilo! I was about to send you a PM t... Sep 10 2012, 08:42 PM
 dilo QUOTE (climber @ Sep 10 2012, 09:42 PM) (... Sep 10 2012, 09:03 PM climber QUOTE (dilo @ Sep 10 2012, 11:03 PM) Corr... Sep 11 2012, 01:25 AM dilo Cannot wait the end of the month...
2nd plot on p... Sep 29 2012, 05:16 AM dilo Update:
Oct 30 2012, 08:59 AM dilo Update:
Nov 29 2012, 04:32 PM dilo Update:
Dec 26 2012, 08:56 AM dilo This time I used the "drive log" in the ... Jan 20 2013, 09:59 AM dilo New, long awaited update with Sol272 drive: May 13 2013, 08:14 PM dilo Updated to drive 46 (Sol297), and waiting for the ... Jun 7 2013, 07:35 AM dilo Changed scales:
Edit: last update on drive#53, So... Jun 14 2013, 05:55 PM dilo Looking to plot above, during drive #50 MSL establ... Jun 18 2013, 04:55 PM dilo New month, new plots:
Jul 1 2013, 05:16 AM dilo Update:
Drive #55 established a new speed record,... Jul 7 2013, 08:32 AM dilo last important drives deserves a new post:
Jul 17 2013, 05:55 PM dilo New plots with new scales (zooming on last progres... Jul 25 2013, 05:04 PM jmknapp It's tempting to think of the descent as going... Jan 21 2013, 06:21 PM djellison Of course - that's a plot against time, not di... Jan 21 2013, 06:23 PM dilo QUOTE (djellison @ Jan 21 2013, 07:23 PM)... Jan 22 2013, 09:43 PM PaulH51 Hi all,
I have searched through this thread as we... Feb 4 2013, 12:38 PM dilo New Odometry/pictures plots, based solely on JPL-M... Feb 23 2013, 09:23 PM jmknapp Yes, I fixed the drive log page so there's no ... Feb 25 2013, 09:16 PM dilo Thanks for explaination, Joe (your log is fantasti... Feb 28 2013, 05:01 PM fredk That shows us about 5m higher than at landing, our... Jul 25 2013, 05:16 PM dilo Yes, fredk; in the following plots I also added la... Jul 26 2013, 06:33 AM dilo Update with a longer time baseline:
Interestingly... Jul 30 2013, 07:01 AM dilo Update with zoom on last drives:
With last huge d... Aug 2 2013, 10:54 AM dilo Landing anniversary deserves full history plots:
... Aug 5 2013, 02:59 PM dilo Update based on new drive-log data by Joe:
Edit: ... Aug 8 2013, 11:39 AM CosmicRocker Very nice. Thanks for these statistical updates, ... Aug 9 2013, 04:40 AM jmknapp I like the running average of the per-sol distance... Aug 10 2013, 09:52 AM dilo Thanks to Joe and CosmicRocker for appreciations... Aug 12 2013, 03:39 PM RoverDriver Marco, I'm confused about how you compute aver... Aug 12 2013, 03:49 PM dilo Paolo, scusa/sorry for late reply but I was out fo... Aug 15 2013, 09:34 AM jmknapp I guess it's kind of a loose definition, since... Aug 15 2013, 11:59 AM RoverDriver Understood. The 8 min pause between some steps is... Aug 15 2013, 02:51 PM dilo New Update.
Now lower plot reports slope angle in... Aug 20 2013, 04:17 PM dilo The new drive record (116m on Sol 371) deserves up... Aug 22 2013, 08:24 PM dilo Plots of last odometry:
(updated to Sol 377 - Aug... Aug 26 2013, 05:06 AM dilo After an "hot" summer of almost continuo... Aug 28 2013, 12:39 PM dilo Updated (more readable) plots:
Last update: Sol 3... Aug 29 2013, 10:11 PM dilo New impressive drive record on Sol 385 deserves up... Sep 6 2013, 05:57 AM fredk We're now at our highest elevation yet, sittin... Sep 6 2013, 06:16 PM ngunn I was thinking the same thing. Looking at the rou... Sep 6 2013, 08:46 PM dilo Update (Sol 392):
Sep 9 2013, 05:41 AM dilo Post-Waypoint1 update (Sol 396):
Sep 18 2013, 01:34 PM dilo Update with wider timeframe (starting from Glenelg... Sep 23 2013, 08:54 PM RoverDriver Has anyone added up the odometry of all rovers (So... Sep 23 2013, 11:14 PM djellison 100 + 7,730 + 38,340 + 2,852 = 49,022
50km here w... Sep 24 2013, 12:31 AM climber and I find 142 kms on the Moon once Lunakhod dista... Sep 24 2013, 10:39 AM dilo Update Sol 410:
Edit: on Sol 410, new positive e... Sep 27 2013, 08:50 PM dilo Update Sol 429:
Note1: total Odometry doubled (fr... Oct 4 2013, 09:54 AM dilo Medium-term plots (last update on Sol 429) :
Not... Oct 16 2013, 11:57 AM dilo Short-term plots (last update on Sol 440) :
Note1... Oct 25 2013, 08:01 PM dilo New short-term plots after Waypoint 2 break:
(las... Nov 15 2013, 02:46 PM dilo New short-term Odometry/Elevation plots:
(last up... Dec 2 2013, 09:28 PM dilo Monthly odometry/elevation/picture plots (up to So... Dec 22 2013, 09:46 AM dilo Short-term update (up to Sol 508 / Jan, 09):
Dec 30 2013, 04:07 PM dilo Short-term update (up to Sol 519 / Jan, 21):
(cha... Jan 13 2014, 09:32 PM dilo Medium term update (up to Sol 521 / Jan, 23):
(... Jan 23 2014, 09:42 PM dilo Short term update (up to Sol 535 / Feb,6):
(chang... Jan 26 2014, 11:00 PM dilo Now that Curiosity is leaving Dingo Gap, here belo... Feb 10 2014, 11:19 AM dilo Short term update (up to Sol 545 / Feb,16):
Great... Feb 12 2014, 08:52 PM dilo New short-term update based on new, corrected Odom... Feb 18 2014, 06:46 PM Explorer1 The terrain is just too rough for now; they can... Oct 25 2013, 10:30 PM Gerald There is certainly some space for interpretation a... Feb 19 2014, 12:48 AM PaulH51 QUOTE (Gerald @ Feb 19 2014, 08:48 AM) ..... Feb 19 2014, 03:50 AM dilo Another great drive on Sol 546, the longest in las... Feb 19 2014, 05:04 PM dilo Update to Sol 559/Mar,3:
Feb 25 2014, 03:58 AM dilo Update:
Up to Sol 562/Mar,06 Mar 5 2014, 04:33 PM dilo Update to Sol566/Mar,10
Mar 9 2014, 07:02 AM dilo Short-term update to Sol579/Mar,23
Mar 13 2014, 06:16 PM dilo Major Odometry update in Joe drive log (+7.5% on t... Mar 26 2014, 01:56 PM jmknapp Do we have a "ground truth" on the offic... Mar 27 2014, 01:54 AM PaulH51 QUOTE (jmknapp @ Mar 27 2014, 09:54 AM) D... Mar 27 2014, 09:53 AM dilo While waiting for eventual further adjustments, th... Apr 1 2014, 03:04 PM jmknapp All right, someone tells me that as of sol 581 the... Mar 27 2014, 09:31 AM mcaplinger Are you familiar with the coastline paradox? http... Apr 1 2014, 03:55 PM jmknapp QUOTE (mcaplinger @ Apr 1 2014, 10:55 AM)... Apr 1 2014, 09:05 PM fredk QUOTE (jmknapp @ Apr 1 2014, 10:05 PM) th... Apr 2 2014, 01:37 AM jmknapp QUOTE (fredk @ Apr 1 2014, 08:37 PM) Pres... Apr 2 2014, 09:11 AM mcaplinger QUOTE (jmknapp @ Apr 1 2014, 02:05 PM) It... Apr 2 2014, 04:03 PM dilo New plots (up to Sol 597/Apr11):
Apr 9 2014, 04:25 PM dilo Updated plots (up to Sol 609/Apr23):
Apr 18 2014, 05:57 AM dilo Update of long term and short term plots, leaving ... May 16 2014, 05:20 PM dilo update to Sol 641:
May 27 2014, 04:53 AM Phil Stooke Odometry can also be reported in different ways. ... Apr 1 2014, 04:10 PM jmknapp [QUOTE (Phil Stooke @ Apr 1 2014, 11:10 A... Apr 1 2014, 11:40 PM RoverDriver QUOTE (jmknapp @ Apr 1 2014, 04:40 PM) ..... Apr 2 2014, 01:50 AM jmknapp Histogram of CHEMCAM shots by sol:
Just for fun... May 29 2014, 11:20 AM fredk QUOTE (jmknapp @ May 29 2014, 11:20 AM) J... May 29 2014, 02:44 PM mcaplinger QUOTE (jmknapp @ May 29 2014, 04:20 AM) J... May 29 2014, 07:08 PM jmknapp The binning is per degree 360x180 so I think the o... May 29 2014, 05:14 PM fredk Thanks for clarifying the heat map. What I was im... May 29 2014, 06:10 PM fredk On the other hand it might be interesting to trans... May 29 2014, 08:21 PM
dilo QUOTE (climber @ Sep 10 2012, 09:42 PM) (... Sep 10 2012, 09:03 PM climber QUOTE (dilo @ Sep 10 2012, 11:03 PM) Corr... Sep 11 2012, 01:25 AM dilo Cannot wait the end of the month...
2nd plot on p... Sep 29 2012, 05:16 AM dilo Update:
Oct 30 2012, 08:59 AM dilo Update:
Nov 29 2012, 04:32 PM dilo Update:
Dec 26 2012, 08:56 AM dilo This time I used the "drive log" in the ... Jan 20 2013, 09:59 AM dilo New, long awaited update with Sol272 drive: May 13 2013, 08:14 PM dilo Updated to drive 46 (Sol297), and waiting for the ... Jun 7 2013, 07:35 AM dilo Changed scales:
Edit: last update on drive#53, So... Jun 14 2013, 05:55 PM dilo Looking to plot above, during drive #50 MSL establ... Jun 18 2013, 04:55 PM dilo New month, new plots:
Jul 1 2013, 05:16 AM dilo Update:
Drive #55 established a new speed record,... Jul 7 2013, 08:32 AM dilo last important drives deserves a new post:
Jul 17 2013, 05:55 PM dilo New plots with new scales (zooming on last progres... Jul 25 2013, 05:04 PM jmknapp It's tempting to think of the descent as going... Jan 21 2013, 06:21 PM djellison Of course - that's a plot against time, not di... Jan 21 2013, 06:23 PM dilo QUOTE (djellison @ Jan 21 2013, 07:23 PM)... Jan 22 2013, 09:43 PM PaulH51 Hi all,
I have searched through this thread as we... Feb 4 2013, 12:38 PM dilo New Odometry/pictures plots, based solely on JPL-M... Feb 23 2013, 09:23 PM jmknapp Yes, I fixed the drive log page so there's no ... Feb 25 2013, 09:16 PM dilo Thanks for explaination, Joe (your log is fantasti... Feb 28 2013, 05:01 PM fredk That shows us about 5m higher than at landing, our... Jul 25 2013, 05:16 PM dilo Yes, fredk; in the following plots I also added la... Jul 26 2013, 06:33 AM dilo Update with a longer time baseline:
Interestingly... Jul 30 2013, 07:01 AM dilo Update with zoom on last drives:
With last huge d... Aug 2 2013, 10:54 AM dilo Landing anniversary deserves full history plots:
... Aug 5 2013, 02:59 PM dilo Update based on new drive-log data by Joe:
Edit: ... Aug 8 2013, 11:39 AM CosmicRocker Very nice. Thanks for these statistical updates, ... Aug 9 2013, 04:40 AM jmknapp I like the running average of the per-sol distance... Aug 10 2013, 09:52 AM dilo Thanks to Joe and CosmicRocker for appreciations... Aug 12 2013, 03:39 PM RoverDriver Marco, I'm confused about how you compute aver... Aug 12 2013, 03:49 PM dilo Paolo, scusa/sorry for late reply but I was out fo... Aug 15 2013, 09:34 AM jmknapp I guess it's kind of a loose definition, since... Aug 15 2013, 11:59 AM RoverDriver Understood. The 8 min pause between some steps is... Aug 15 2013, 02:51 PM dilo New Update.
Now lower plot reports slope angle in... Aug 20 2013, 04:17 PM dilo The new drive record (116m on Sol 371) deserves up... Aug 22 2013, 08:24 PM dilo Plots of last odometry:
(updated to Sol 377 - Aug... Aug 26 2013, 05:06 AM dilo After an "hot" summer of almost continuo... Aug 28 2013, 12:39 PM dilo Updated (more readable) plots:
Last update: Sol 3... Aug 29 2013, 10:11 PM dilo New impressive drive record on Sol 385 deserves up... Sep 6 2013, 05:57 AM fredk We're now at our highest elevation yet, sittin... Sep 6 2013, 06:16 PM ngunn I was thinking the same thing. Looking at the rou... Sep 6 2013, 08:46 PM dilo Update (Sol 392):
Sep 9 2013, 05:41 AM dilo Post-Waypoint1 update (Sol 396):
Sep 18 2013, 01:34 PM dilo Update with wider timeframe (starting from Glenelg... Sep 23 2013, 08:54 PM RoverDriver Has anyone added up the odometry of all rovers (So... Sep 23 2013, 11:14 PM djellison 100 + 7,730 + 38,340 + 2,852 = 49,022
50km here w... Sep 24 2013, 12:31 AM climber and I find 142 kms on the Moon once Lunakhod dista... Sep 24 2013, 10:39 AM dilo Update Sol 410:
Edit: on Sol 410, new positive e... Sep 27 2013, 08:50 PM dilo Update Sol 429:
Note1: total Odometry doubled (fr... Oct 4 2013, 09:54 AM dilo Medium-term plots (last update on Sol 429) :
Not... Oct 16 2013, 11:57 AM dilo Short-term plots (last update on Sol 440) :
Note1... Oct 25 2013, 08:01 PM dilo New short-term plots after Waypoint 2 break:
(las... Nov 15 2013, 02:46 PM dilo New short-term Odometry/Elevation plots:
(last up... Dec 2 2013, 09:28 PM dilo Monthly odometry/elevation/picture plots (up to So... Dec 22 2013, 09:46 AM dilo Short-term update (up to Sol 508 / Jan, 09):
Dec 30 2013, 04:07 PM dilo Short-term update (up to Sol 519 / Jan, 21):
(cha... Jan 13 2014, 09:32 PM dilo Medium term update (up to Sol 521 / Jan, 23):
(... Jan 23 2014, 09:42 PM dilo Short term update (up to Sol 535 / Feb,6):
(chang... Jan 26 2014, 11:00 PM dilo Now that Curiosity is leaving Dingo Gap, here belo... Feb 10 2014, 11:19 AM dilo Short term update (up to Sol 545 / Feb,16):
Great... Feb 12 2014, 08:52 PM dilo New short-term update based on new, corrected Odom... Feb 18 2014, 06:46 PM Explorer1 The terrain is just too rough for now; they can... Oct 25 2013, 10:30 PM Gerald There is certainly some space for interpretation a... Feb 19 2014, 12:48 AM PaulH51 QUOTE (Gerald @ Feb 19 2014, 08:48 AM) ..... Feb 19 2014, 03:50 AM dilo Another great drive on Sol 546, the longest in las... Feb 19 2014, 05:04 PM dilo Update to Sol 559/Mar,3:
Feb 25 2014, 03:58 AM dilo Update:
Up to Sol 562/Mar,06 Mar 5 2014, 04:33 PM dilo Update to Sol566/Mar,10
Mar 9 2014, 07:02 AM dilo Short-term update to Sol579/Mar,23
Mar 13 2014, 06:16 PM dilo Major Odometry update in Joe drive log (+7.5% on t... Mar 26 2014, 01:56 PM jmknapp Do we have a "ground truth" on the offic... Mar 27 2014, 01:54 AM PaulH51 QUOTE (jmknapp @ Mar 27 2014, 09:54 AM) D... Mar 27 2014, 09:53 AM dilo While waiting for eventual further adjustments, th... Apr 1 2014, 03:04 PM jmknapp All right, someone tells me that as of sol 581 the... Mar 27 2014, 09:31 AM mcaplinger Are you familiar with the coastline paradox? http... Apr 1 2014, 03:55 PM jmknapp QUOTE (mcaplinger @ Apr 1 2014, 10:55 AM)... Apr 1 2014, 09:05 PM fredk QUOTE (jmknapp @ Apr 1 2014, 10:05 PM) th... Apr 2 2014, 01:37 AM jmknapp QUOTE (fredk @ Apr 1 2014, 08:37 PM) Pres... Apr 2 2014, 09:11 AM mcaplinger QUOTE (jmknapp @ Apr 1 2014, 02:05 PM) It... Apr 2 2014, 04:03 PM dilo New plots (up to Sol 597/Apr11):
Apr 9 2014, 04:25 PM dilo Updated plots (up to Sol 609/Apr23):
Apr 18 2014, 05:57 AM dilo Update of long term and short term plots, leaving ... May 16 2014, 05:20 PM dilo update to Sol 641:
May 27 2014, 04:53 AM Phil Stooke Odometry can also be reported in different ways. ... Apr 1 2014, 04:10 PM jmknapp [QUOTE (Phil Stooke @ Apr 1 2014, 11:10 A... Apr 1 2014, 11:40 PM RoverDriver QUOTE (jmknapp @ Apr 1 2014, 04:40 PM) ..... Apr 2 2014, 01:50 AM jmknapp Histogram of CHEMCAM shots by sol:
Just for fun... May 29 2014, 11:20 AM fredk QUOTE (jmknapp @ May 29 2014, 11:20 AM) J... May 29 2014, 02:44 PM mcaplinger QUOTE (jmknapp @ May 29 2014, 04:20 AM) J... May 29 2014, 07:08 PM jmknapp The binning is per degree 360x180 so I think the o... May 29 2014, 05:14 PM fredk Thanks for clarifying the heat map. What I was im... May 29 2014, 06:10 PM fredk On the other hand it might be interesting to trans... May 29 2014, 08:21 PM |

|
Lo-Fi Version | Time is now: 21st September 2024 - 10:27 PM |
|
RULES AND GUIDELINES Please read the Forum Rules and Guidelines before posting. IMAGE COPYRIGHT |
OPINIONS AND MODERATION Opinions expressed on UnmannedSpaceflight.com are those of the individual posters and do not necessarily reflect the opinions of UnmannedSpaceflight.com or The Planetary Society. The all-volunteer UnmannedSpaceflight.com moderation team is wholly independent of The Planetary Society. The Planetary Society has no influence over decisions made by the UnmannedSpaceflight.com moderators. |
SUPPORT THE FORUM Unmannedspaceflight.com is funded by the Planetary Society. Please consider supporting our work and many other projects by donating to the Society or becoming a member. |
|