MSL statistics, Odometry progress and other figures |

  |
MSL statistics, Odometry progress and other figures |
 Sep 6 2012, 05:37 PM Sep 6 2012, 05:37 PM
Post
#1
|
||
 Senior Member  Group: Members Posts: 2492 Joined: 15-January 05 From: center Italy Member No.: 150 |
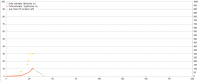
After first month on Mars, I think it's time to start a topic similar to MER one...
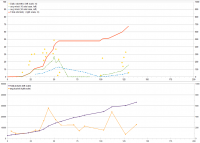
First odometry plot to start:
-------------------- I always think before posting! - Marco -
|
|
 |
 
|
|
|
Sep 10 2012, 08:42 PM
Post
#2
|
|
|
Senior Member Group: Members Posts: 2922 Joined: 14-February 06 From: Very close to the Pyrénées Mountains (France) Member No.: 682 |
Thank you dilo! I was about to send you a PM to know when we'll opened up this topic
 As Curiosity jumped one step (from nil to n°8 position), I put this uptade in MSL's. I also changed the second title from "from landing base" to "from landing place" since the term was no longer the right one. I have no means where I am to check Oppy's distance to the landing place but I guess she get closer to Eagle since sol 2654 instead of further. If I'm wrong I'll correct it later unless someone give me the info. Thanks. Actual total odometry 1. Lunokhod 2 37.00 km 2. Apollo 17 rover 35.89 km 3. Opportunity (3056) 35.02 km 4. Apollo 15 rover 27.76 km 5. Apollo 16 rover 26.55 km 6. Lunokhod 1 10.50 km 7. Spirit 7.73 km 8. Curiosity (29) 0.11 km 9. Sojourner 0.085 km Actual maximum distance from landing place 1. Opportunity (2743) 19.48 km 2. Lunokhod 2 14.39 km 3. Apollo 17 rover 7.2 km 4. Apollo 15 rover 5.0 km 5. Apollo 16 rover 4.6 km 6. Spirit 3.62 km 7. Lunokhod 1 2.26 km 8. Curiosity (29) 0.08 km 9. Sojourner 0.01 km -------------------- |
|
|
|
|
Sep 10 2012, 09:03 PM
Post
#3
|
|
|
Senior Member Group: Members Posts: 2492 Joined: 15-January 05 From: center Italy Member No.: 150 |
QUOTE (climber @ Sep 10 2012, 09:42 PM)  (BTW you mean "similar to MER", I guess). Corrected, thanks! About Oppy maximum distance from landing point, using Theseiner map on Google Earth I found 19.48 km on Sol2703 (Chester lake). -------------------- I always think before posting! - Marco -
|
|
|
|
|
Sep 11 2012, 01:25 AM
Post
#4
|
|
|
Senior Member Group: Members Posts: 2922 Joined: 14-February 06 From: Very close to the Pyrénées Mountains (France) Member No.: 682 |
QUOTE (dilo @ Sep 10 2012, 11:03 PM) Corrected, thanks! About Oppy maximum distance from landing point, using Theseiner map on Google Earth I found 19.48 km on Sol2703 (Chester lake). Thanks, also corrected -------------------- |
|
|
|
|
Sep 29 2012, 05:16 AM
Post
#5
|
||
|
Senior Member Group: Members Posts: 2492 Joined: 15-January 05 From: center Italy Member No.: 150 |
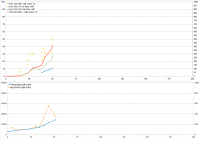
Cannot wait the end of the month...
2nd plot on picture statistics is based on figures reported on top of MSL "row images" pages and should include also thumbnails... -------------------- I always think before posting! - Marco -
|
|
|
|
|
|
|
Oct 30 2012, 08:59 AM
Post
#6
|
||
|
Senior Member Group: Members Posts: 2492 Joined: 15-January 05 From: center Italy Member No.: 150 |
Update:
-------------------- I always think before posting! - Marco -
|
|
|
|
|
|
|
Nov 29 2012, 04:32 PM
Post
#7
|
||
|
Senior Member Group: Members Posts: 2492 Joined: 15-January 05 From: center Italy Member No.: 150 |
Update:
-------------------- I always think before posting! - Marco -
|
|
|
|
|
|
|
Dec 26 2012, 08:56 AM
Post
#8
|
||
|
Senior Member Group: Members Posts: 2492 Joined: 15-January 05 From: center Italy Member No.: 150 |
Update:
-------------------- I always think before posting! - Marco -
|
|
|
|
|
|
|
Jan 20 2013, 09:59 AM
Post
#9
|
||
|
Senior Member Group: Members Posts: 2492 Joined: 15-January 05 From: center Italy Member No.: 150 |
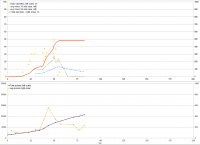
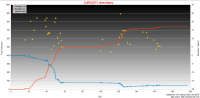
This time I used the "drive log" in the excellent "Curiosity Rover raw Image browser" for a new plot containing also elevation (referred to Bradbury station) and "instant" speed (actually, average speed during each single drive):
UPDATE on Jan,25: I added last drive (#42) LAST UPDATE on Feb,24 -------------------- I always think before posting! - Marco -
|
|
|
|
|
|
|
Jan 21 2013, 06:21 PM
Post
#10
|
|
 Senior Member Group: Members Posts: 1465 Joined: 9-February 04 From: Columbus OH USA Member No.: 13 |
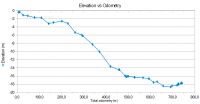
It's tempting to think of the descent as going down a series of terraces.
-------------------- |
|
|
|
|
Jan 21 2013, 06:23 PM
Post
#11
|
|
|
Founder Group: Chairman Posts: 14434 Joined: 8-February 04 Member No.: 1 |
Of course - that's a plot against time, not distance. But I think we would see a stair-step entering the Yellowknife Bay area.
|
|
|
|
|
Jan 22 2013, 09:43 PM
Post
#12
|
||
|
Senior Member Group: Members Posts: 2492 Joined: 15-January 05 From: center Italy Member No.: 150 |
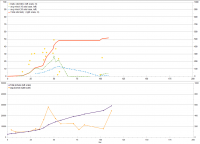
QUOTE (djellison @ Jan 21 2013, 07:23 PM) Of course - that's a plot against time, not distance. This plot confirms Doug's words:
PS: Further update on the odometry plot above highlight drive transitions. -------------------- I always think before posting! - Marco -
|
|
|
|
|
|
|
Feb 4 2013, 12:38 PM
Post
#13
|
|
 Senior Member Group: Members Posts: 2431 Joined: 30-January 13 From: Penang, Malaysia. Member No.: 6853 |
Hi all,
I have searched through this thread as well as the internet and can not locate any statistics from the REMs weather station package on the MSL rover. I use the marsweatherdotcom page but this only provides selected information (max / min etc). If anyone knows where I can find the detailed archives or the site where I can see a wider range of raw data I would be eternally grateful. TIA, Paul |
|
|
|
|
Feb 23 2013, 09:23 PM
Post
#14
|
||
|
Senior Member Group: Members Posts: 2492 Joined: 15-January 05 From: center Italy Member No.: 150 |
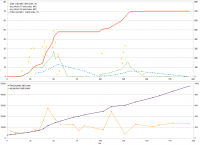
New Odometry/pictures plots, based solely on JPL-MSL press release info:
In the meantime, I noticed Odometry fugures in the drive log were retouched (-1%) and now they are consistent with cumulative drive distance; perhaps, original NAIF data files were somehow refined (see updated plot above) -------------------- I always think before posting! - Marco -
|
|
|
|
|
|
|
Feb 25 2013, 09:16 PM
Post
#15
|
|
|
Senior Member Group: Members Posts: 1465 Joined: 9-February 04 From: Columbus OH USA Member No.: 13 |
Yes, I fixed the drive log page so there's no longer a discrepancy between the odometer reading and the sum of the individual drives.
One thing that's kind of interesting philosophically though is how to exactly measure distance in the first place. The actual path of a point on the rover (say, the MSL_ROVER frame origin) in the "real world" can be quite complicated, akin to a fractal on smaller and smaller scales. For instance, say the whole vehicle is vibrating--intuitively we wouldn't want to count that toward an odometer reading, but it is moving! My code samples the rover position as given in the NAIF data every second. I take the x,y and z coordinates of the rover and get the distance from the prior sample. Sampling at different intervals could well give different results, although probably not too different, particularly with somewhat idealized NAIF data. -------------------- |
|
|
|
|

|
Lo-Fi Version | Time is now: 21st September 2024 - 06:29 AM |
|
RULES AND GUIDELINES Please read the Forum Rules and Guidelines before posting. IMAGE COPYRIGHT |
OPINIONS AND MODERATION Opinions expressed on UnmannedSpaceflight.com are those of the individual posters and do not necessarily reflect the opinions of UnmannedSpaceflight.com or The Planetary Society. The all-volunteer UnmannedSpaceflight.com moderation team is wholly independent of The Planetary Society. The Planetary Society has no influence over decisions made by the UnmannedSpaceflight.com moderators. |
SUPPORT THE FORUM Unmannedspaceflight.com is funded by the Planetary Society. Please consider supporting our work and many other projects by donating to the Society or becoming a member. |
|